
It has been a while since we released a version, so it is with great pleasure that I am writing this announcement.
Yes. Our latest release is now out in the wild. We’ve upgraded our service on Sunday, so it is about time we take you for a quick roundup of the changes we’ve made.
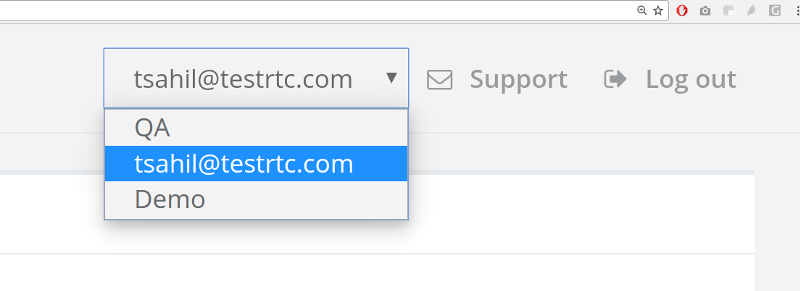
#1 – Support for projects and users
This one is long overdue. Up until today, if you signed up for testRTC, you had to share your credentials with whoever was on your team to work with him on the tests. This was impossible to work with, assuming you wanted QA, R&D and DevOps to share the account and work cooperatively with the tests and monitors that got logged inside testRTC.
So we did what we should have – we now support two modes of operation:
- A user can be linked to multiple projects
- So if your company is running multiple projects, you can now run them separately, having people focused on their own environment and tests
- This is great for those who run segregated services for their own customers
- It also means that now, a user can switch between projects with a single set of credentials in the system
- A project can belong to multiple users
- Need someone to work on writing the scripts and executing them? You got it
- Have a developer working on a bug that got reported with a link to testRTC? Sure thing
- The IT guy who just received a downtime alarm from the WebRTC monitor we run? That’s another user
- Each user has his own place in the project, and each is distinguished by his own credentials
If you require multiple projects, or want to add more users to your account just contact our support.
#2 – Longer, bigger tests
While theoretically, testRTC can run any test at any length and size, things aren’t always that easy.
There are usually two limitations to these requirements:
- The time they take to prepare, execute, run and collect results
- The time it takes to analyze the results
We worked hard in this release on both elements and got to a point where we’re quite happy with the results.
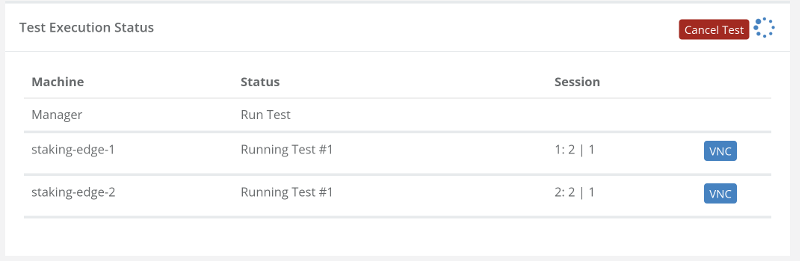
If you need long tests, we can handle those. One of the main concerns with long tests is what to do if you made a mistake while configuring them? Now you can cancel such tests in the middle if necessary.
If you need to scale tests to a large number of browsers – we can do that too.
We are making sure we bubble up the essentials from the browsers, so you don’t have to work hard and rummage through hundreds of browser logs to find out what went wrong. To that end, the tables that show browser results have been reworked and are now sorted in a way that will show failures first.
#3 – Advanced WebRTC analysis
We’ve noticed in the past few months that some of our customers are rather hard core. They are technology savvy and know their way in WebRTC. For them, the graphs we offer of bitrates, latencies, packet losses, … – are just not enough.
Chrome’s webrtc-internals and getstats() offer a wealth of additional information that we offered up until now only in a JSON file download. Well… now we also visualize it upon request right from the report itself:
These graphs are reachable by clicking the webrtc_internals_dump.txt link under the Logs tab of a test result. Or by clicking the Advanced WebRTC Analytics button located just below the channels list:
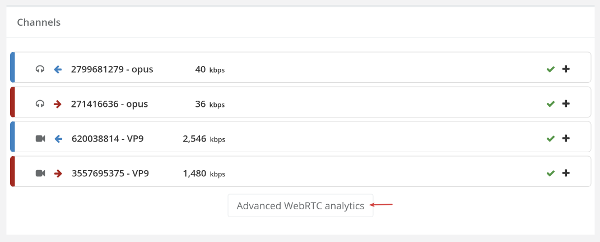
I’d like to thank Fippo for the work he did (webrtc-dump-importer) – we adopted it for this feature.
#4 – Simulation of call drops and dynamic network changes
This is something we’ve been asked more than once. We have the capability of modeling the network of our probes, so that the browser runs with a specific configuration of a firewall or via a specific type of simulated network. We’re modifying and tweaking the profiles we have for these from time to time, but now we’ve added a script command so that you can change this configuring in runtime.
What can you do with it? Run two minutes of a test with 2 Mbps, then close virtually everything for 20-30 seconds, then open up the network again – and see what happens. It is a way to test WebRTC in your application in dynamic network conditions – ones that may require ICE restarts.
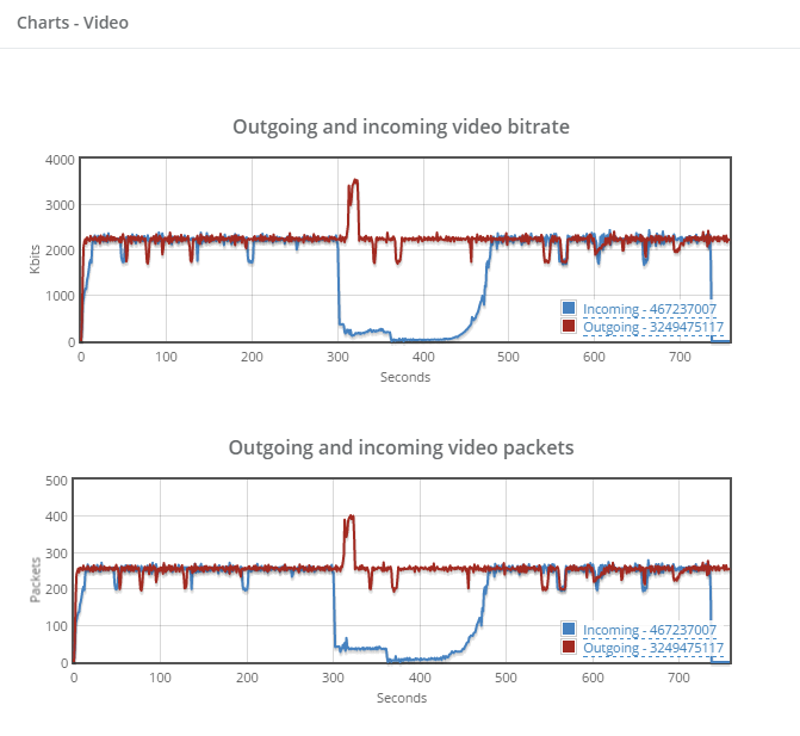
In the test above, we dynamically changed the network profile in mid-call to starve WebRTC and see how it affects the test.
How do you use this new capability? Use our new command rtcSetNetworkProfile(). Read all about it in our knowledge base: rtcSetNetworkProfile()
#5 – Additional test expectations
We had the basics covered when it came to expectations. You could check the number and types of channels, validate that there’s some bits going on in there, validate packet loss. And that’s about it.
To this list of capabilities that existed in rtcSetTestExpectations() we’ve now added the ability to add expectations related to jitter, video resolutions, frame rate, and call setup time. We’ve also taken the time to handle expectations on empty channels a lot better.
There’s really nothing new here, besides an enhancement of what rtcSetTestExpectations() can do.
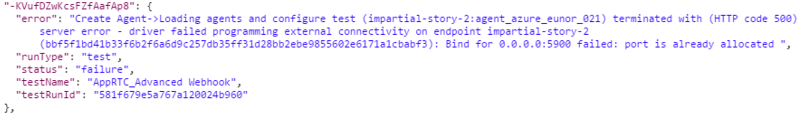
#6 – Additional information in Webhook responses
testRTC can notify your backend whenever a test or a monitor run ends on the status of that run – success or failure. This is done by configuring a webhook that is called at the end of the test run. We’ve had customers use it to collect the results to their own internal monitoring systems such as Splunk and Elastic Search.
What we had on offer in the actual payload that was passed with the webhook was rather thin, and while we’re still trying to keep it simple, we did add the leading error in that response in cases of failure:
#7 – API enabled to all customers
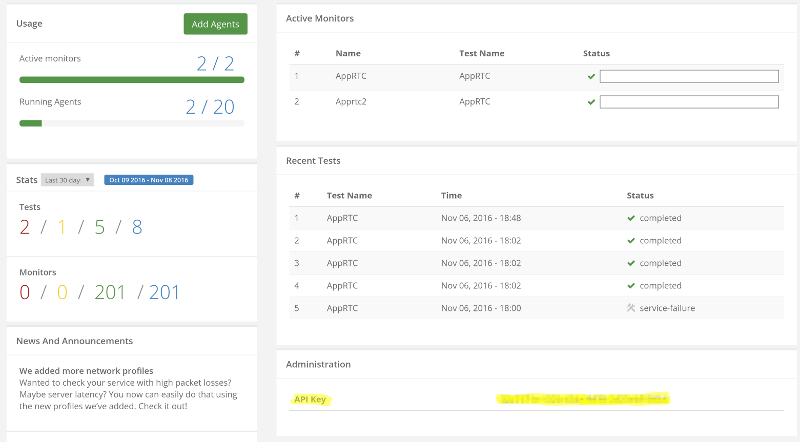
Yes. We had APIs in the past, but somehow, there was friction involved, with customers needing to ask for their API key in order to use the API for their continuous integration plans. It worked well, but the number of customers asking for API keys – both customers and prospects under evaluation – has risen to a point where it was ridiculous to continue doing this manually. Especially when our intent is for customers to use our APIs.
So we took this one step forward. From now on, every account has an API key by default. That API key is accessible from the account’s dashboard when you login, so there’s no need to ask for it any longer.
For those of you who have been using it – note that we’ve also reset your key to a new value.
Your turn
This has been quite a big release for us, and I am sure to miss an enhancement or two (or more).
Now back to you. How would you want to test WebRTC in your product?