That’s actually a great question. We get this every once in awhile, so I wanted to touch it here.
Our WebRTC monitor? It is like pingdom, just more complex and end-to-end – we make sure that if a user tries to access your system he will end up getting media and not just a web page. And that distinction is important. Pingdom only states if a given IP address is responsive or that a URL returns a response. We go the extra mile of connecting a media session.
Back to the original question:
We already have users. Why should we monitor WebRTC?
That’s how the question goes. The service is up and running. People are using the service. We’ve even connected the servers we run to Nagios. Or New Relic. Or someone else. You know what? We even collect the WebRTC statistics on our live production system and closely monitor how real users perceive our service. Why do we need another monitor?
For the same reason you have Nagios and New Relic in there in the first place. If you have customers and they are happy and you check their stats – why invest in monitoring the servers directly?
Here are 4 reasons I heard directly from our customers:
#1 – We want to know before our customers complain
While the best predictor of a customer issue is a customer complaining, I am not sure this is the best approach.
Many vendors prefer knowing about a problem before their customers do. This gives them time to try and solve the issue – or at least give them the ability to tell the customer that they know about it and are trying to resolve it already.
A good example here is the launch of a new browser version. These upgrades tend to break things or change behavior in one way or another. You can put a monitor in front of the latest stable Chrome version – or better yet – the beta version. That way, you can catch more issues in advance and be prepared for them.
I’d say this is the main reason why customers subscribe to our WebRTC monitoring service. They may take different routes in what exactly it is that they monitor (locations, different deployments, different frequencies, different user profiles), but they all want to monitor their service.
#2 – Everything was up and running, but calls didn’t connect
We recently had a company approach us due to downtime that their service experienced. What they said was that the application monitoring that they had in place indicated service running perfectly well, but the service was effectively down for their customers.
You see, knowing that your server’s CPU is below 80% and memory looks fine doesn’t really indicate that if someone tries to communicate he will succeed. This type of monitoring is necessary but not sufficient.
By using testRTC monitor, you can rest assured that your service is up and running. Why? Because we access your service from a real browser just like a user would, and we go through all the hoops of your service to get to that media. And once we do? We can validate that the media also meets your criteria – like specific bitrates or packetloss target thresholds.
#3 – Uptime and network quality isn’t the same thing
If what you do is collect network statistics on calls getting connected by looking at WebRTC stats then think again. It might be necessary and important, but not enough either.
The assumption of such an activity that the service is up and running, and the only thing missing is knowing the network quality by reviewing the quality experienced by users. But is that a good predictor of the next failure? If you only monitor successful calls in the system, then how would you know that calls are failing because they can’t even begin to connect?
With the testRTC monitor this is something that is checked each and every time. Making sure that users can get connected. Sure. We’ll check the quality and your criteria of it. But first and foremost, we’ll make sure that session that needs to connect – get connected.
#4 – How do you baseline a service performance?
When you try and use the statistics collected from your live audience, it tells you how well this audience is experiencing your service, but does it tell you if/how can you improve it?
One of the toughest things to do with WebRTC is to spec out the server. You’ve built a service to scale. You’ve put in place scale out mechanisms on one of the biggest cloud providers. You know for certain that whenever you’ll need more capacity, your system will automagically grown and do so economically. Or will it?
Can you see from real users what will be the experience of the next user to join? Is he experiencing packet losses because of his own network (running from a smartphone in a basement connected over 2G) or is it because your server has a bad network connection of its own towards the internet and it is leaking packets?
Part of what our WebRTC monitor does is add predictability into the process. Whenever the monitor is scheduled to run, it will run as flawlessly as it did last time, over the same type of connection and network conditions you’ve asked it to. So if you see packet losses – you know it has to be something on your end.
This enables the creation of a baseline of your service performance, and put hard criteria in place against that baseline, so whenever a testRTC WebRTC probe will poke at your service and come back unsatisfied – you will know about it, and you will be able to take actionable measures to solve it.
How do you monitor WebRTC?
WebRTC is still rather new and nascent, so there’s little in the way of best practices and experience that got collected around it.
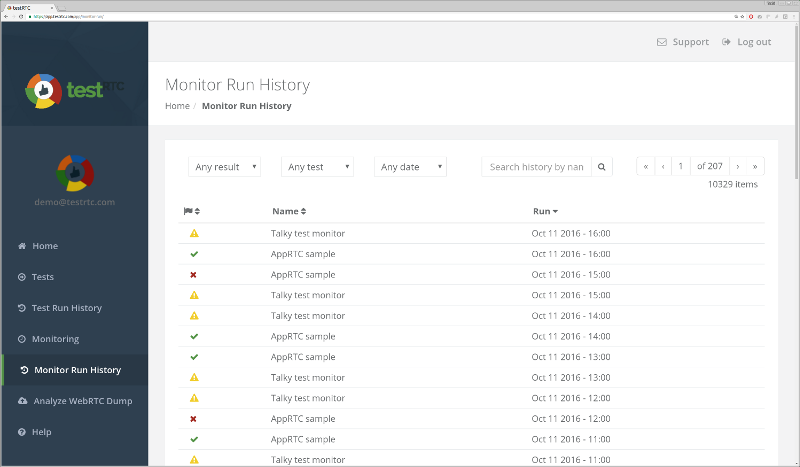
Here’s a screenshot I took just now from our demo account, where we run a few sample monitors in front of AppRTC and Talky (for no good reason other than the fact that we can):

I am really interested in understanding how you monitor your service. What is it that you do to make sure it is up and running for your customers.

