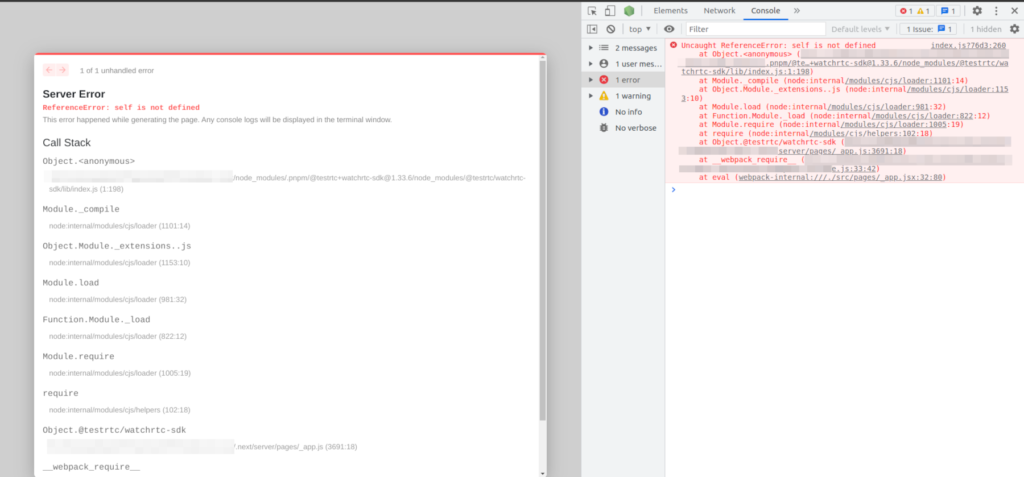
When using server side rendering frameworks such as Next.js, the watchRTC SDK gets integrated and built on a server platform instead of inside the browser itself. This may lead to execution errors once you import and include the watchRTC SDK.
You may bump into something like this error message:
To avoid this error message, you just need load our watchRTC SDK dynamically:
testRTC was always about simplifying the complex world of WebRTC for our clients. While most of our customers to date have been developers, we are starting to see more and more IT and support customers, who want to have a simpler interface – or at least figure out faster what is wrong as why.
Why am I sharing it with you? Because we are starting to work hard from this release and on improving that specific thing – how to figure out faster what is wrong and why.
We are starting with the results ribbons, adding threshold colors to them, and improving their readability. This is a first step in many that you will be seeing in our upcoming releases.
Single Sign-on
SSO is coming to testRTC!
We are now able to offer single sign on for our enterprise clients.
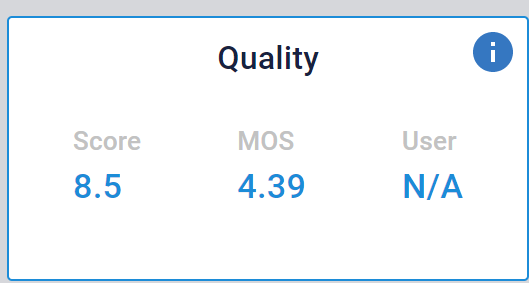
We started with simplicity, so we’ve now added (i) icons to the ribbon boxes. Clicking them will get you to our knowledge base where each of the values is explained
We’ve added colors to the Quality box in the ribbon as well. This is configurable (on our end), so if you need changes to the threshold just let us know
There’s a download button now available on Advanced WebRTC Analytics. This can make it easier to share or analyze the data outside of testRTC
qualityRTC
We’ve added some more logic to the email notifications and PDF reports that can be generated in qualityRTC:
PDF files can now contain the full logs of the test if needed
Users can be prompted at the end of the test if they want to send the results to your support
Thorough tests can be configured to try multiple data center regions sequentially when needed
Logs can be limited to not display certain elements and information if needed
probeRTC
probeRTC can now be installed on Mac machines
You can configure an automatic end date for a probe
watchRTC
Notifications now include trends in traffic and quality metrics:
Here and there
Analysis of potential failures was limited to the first RTCPeerConnection. We are now conducting the analysis across all peer connections collected
Trends charts now split bitrate and packet loss metrics between incoming and outgoing
testRTC supports SSO for its clients. You can authenticate and login to our service using SSO.
In such a configuration, users get authenticated and authorized for access directly via your SSO provider. Upon authentication, a user account will be created in testRTC for a first time login for the given user in your project on testRTC.
You can use Azure Active Directory to sign in to testRTC.
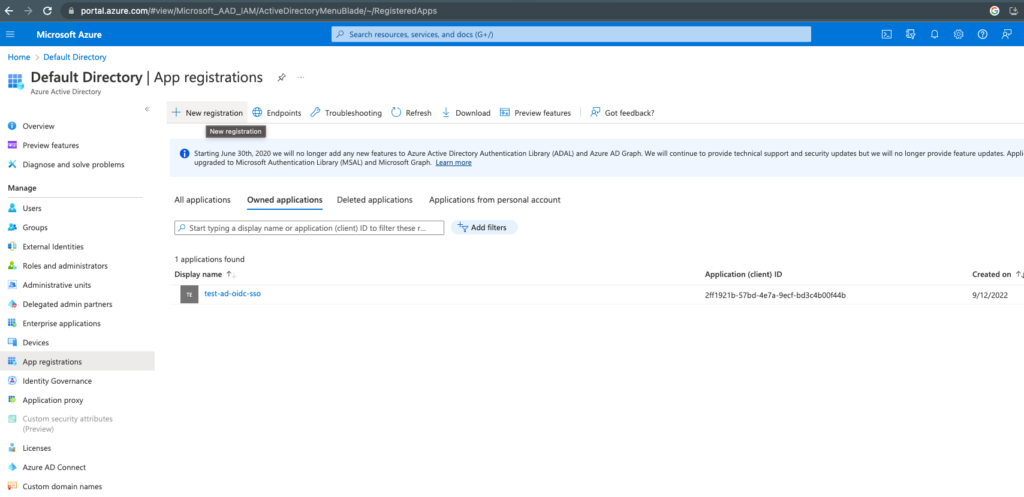
In your Azure account, navigate to Active Directory.
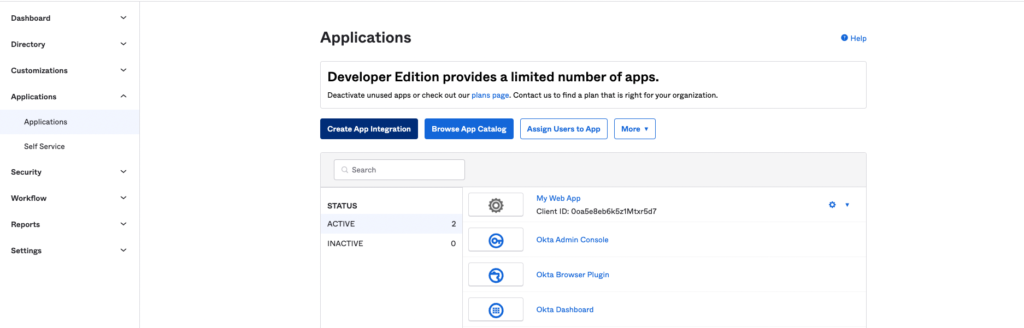
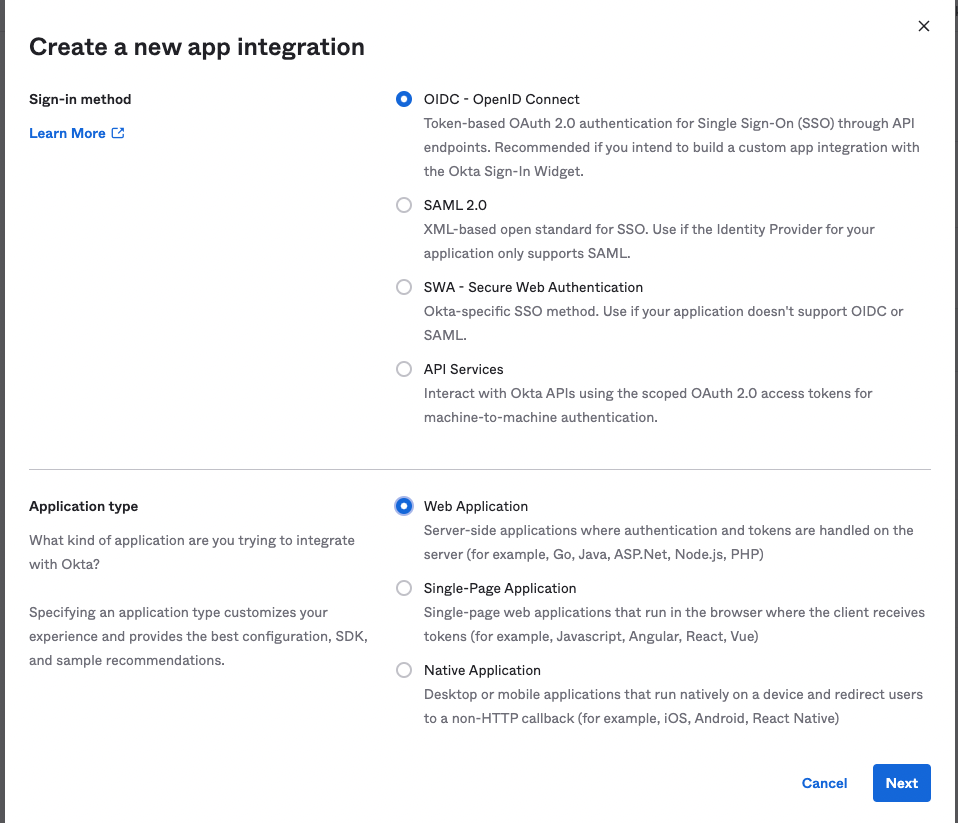
Select App registrations on the left side panel and then select New registration on the top bar.
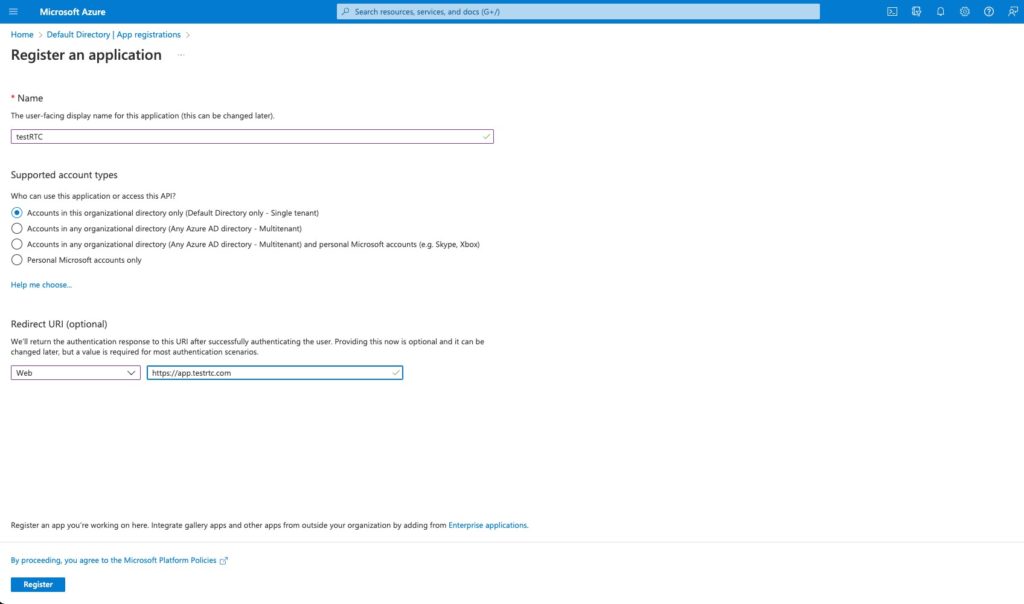
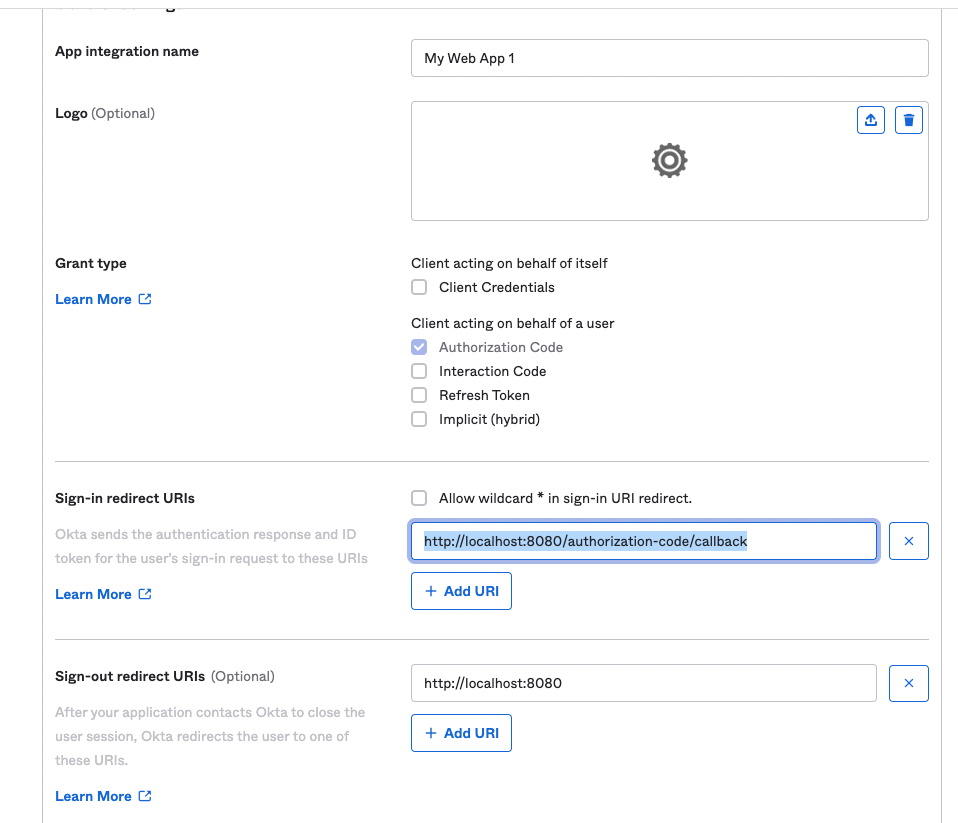
Choose the Name of the application and the account type. Set the Redirect URI to https://app2.testrtc.com/auth/azure/{your-domain}/authorization-code/callback
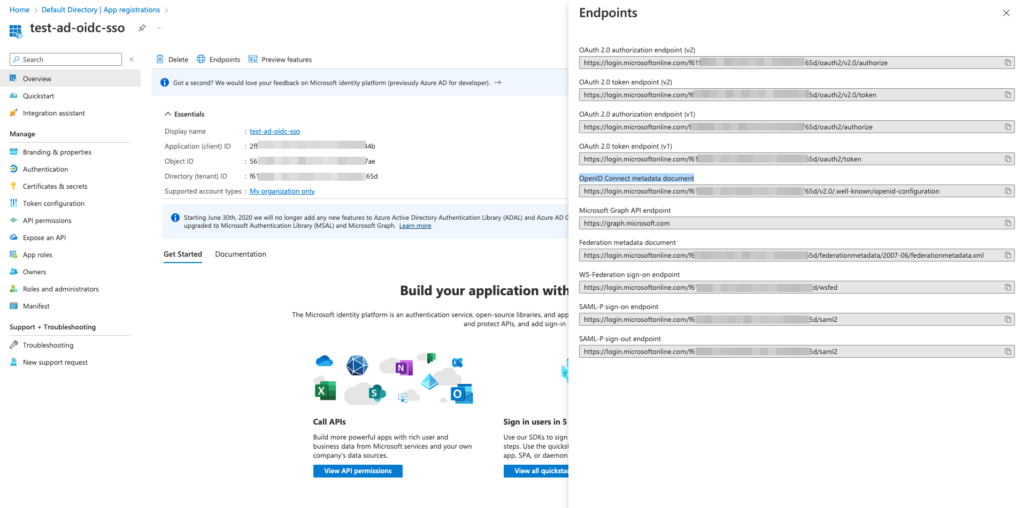
Now that you created your application in the directory, it is time to configure it a bit and get the information needed on our end.
On the application page click Endpoints, then copy the link under OpenID Connect metadata document – we’ll need this later
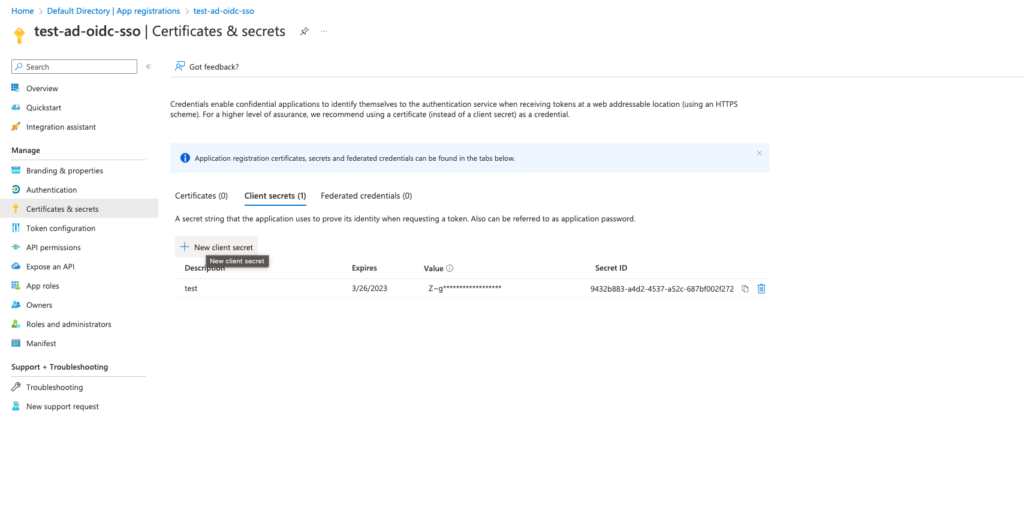
Now click on Certificates and secrets on the application page, and create new client secret
Once completed, please provide our support the following information:
From OpenID Connect metadata document JSON:
issuer
authorizationURL (authorization_endpoint)
tokenURL (token_endpoint)
userInfoURL (userinfo_endpoint)
clientID (Application ID) – can be found on the application page
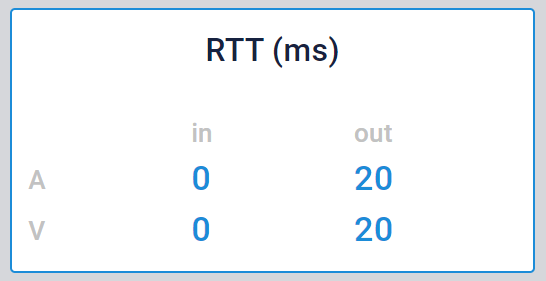
RTT indicates the round trip time (latency) observed. The higher the RTT, the lower the overall media quality of the session is. testRTC shows RTT information at the top ribbon results across the various solutions available for testing and monitoring:
The RTT values shown indicate the outgoing round trip time in milliseconds and are split between audio and video channels. The data is averaged throughout the duration of the session.
RTT threshold
When the round trip time value is above a certain threshold value, it will be marked in red.
The default configuration is set to 250 milliseconds. This threshold can be changed through our support.
Things you should know about RTT
Here are a few things to remember in the back of your mind about round trip time:
Delay, latency and RTT. All these come to describe the time it takes to receive media packets. Delay and latency are one-way and round trip time is two-way in nature (and what is measured by WebRTC)
RTT is measured only on outgoing channels. The receiver of the outgoing media sends feedback that is then used to measure the round trip time
The lower the round trip the better the media quality will be – remember that what we are aiming for is real-time and conversational in nature
The round trip time measured is the network one – it isn’t glass-to-glass. Additional delays caused by the camera and display processing are left out of the measurements done here
High RTT may indicate any of the following:
Connecting to a peer located remotely
Connecting to a media server located remotely (when a closer one may be available)
Using proxies or VPNs that route traffic through a remote server
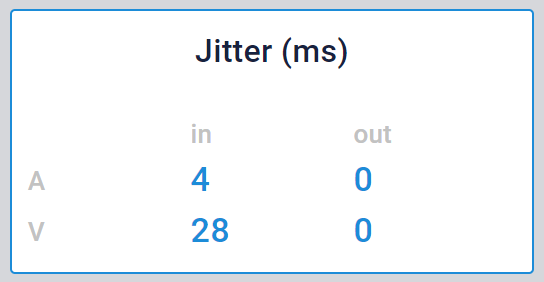
Jitter indicates the deviation from the periodic receival of media packets in milliseconds. The higher the jitter, the lower the overall media quality of the session is. testRTC shows jitter information at the top ribbon results across the various solutions available for testing and monitoring:
The jitter values shown are split between incoming and outgoing jitter in milliseconds to the user or probe, as well as between audio and video. The data is averaged throughout the duration of the session.
Jitter threshold
When the jitter value is above a certain threshold value, it will be marked in red.
The default configuration is set to 30 milliseconds. This threshold can be changed through our support.
Things you should know about jitter
Here are a few things to remember in the back of your mind about jitter:
Jitter is highly affected by the stability of the system. This includes network conditions as well as device performance
In poor network conditions, you will be seeing high jitter, which will force WebRTC to either delay media playback in order to maintain smoothness or to drop audio and video frames arriving too late
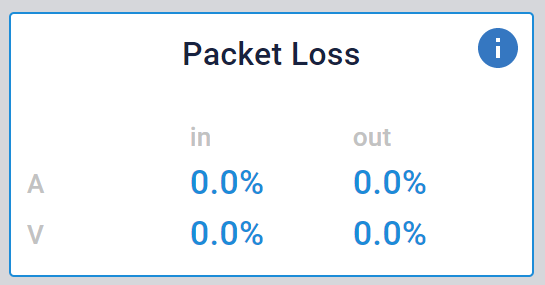
Packet loss percentage indicates the percentage of media packets that were lost along the way. The higher the packet loss, the lower the overall media quality of the session is. testRTC shows packet loss percentage information at the top ribbon results across the various solutions available for testing and monitoring:
The packet loss values shown are split between incoming and outgoing packet loss percentage to the user or probe, as well as between audio and video. The data is averaged throughout the duration of the session.
Packet loss threshold
When the packet loss value is above a certain threshold value, it will be marked in red.
The default configuration is set to 4% packet loss. This threshold can be changed through our support.
Things you should know about packet loss
Here are a few things to remember in the back of your mind about packet loss:
The lower the packet loss the better the media quality will be (0% packet loss is highly desirable, though not always realistic)
WebRTC has mechanisms to overcome packet loss issues which are rather good in dealing with many of the cases, though beyond a certain percentage of packet loss, media quality degrades significantly
Packet loss can be caused by many reasons
Distance from a WiFi access point (the farther away, the higher the chances for packet loss)
Cellular reception over cellular networks
Congestion over the local network
Congestion over the Internet
Congestion on media servers due to poor infrastructure management
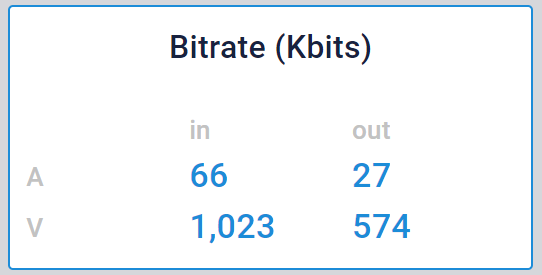
An important metric in media quality is bitrate. testRTC shows bitrate related information at the top ribbon results across the various solutions available for testing and monitoring:
The bitrate values shown are split between incoming and outgoing bitrate to the user or probe, as well as between audio and video. The data is averaged throughout the duration of the session.
Unlike other values on the ribbons, bitrate has no thresholds associated with it. This is due to the fact that different services and scenarios have very different expectations of what the required bitrate for them is.
Video bitrates
When it comes to video, there is no gold standard to what a good bitrate is. You can use the following best practices as a general rule, and then see how they apply to your application:
The higher the bitrate, the higher the video quality should be
In a 1:1 video call, bitrates of 1,000-2,500 kbps should offer good video quality. Higher than that is usually unnecessary
In group video calls, try not to get over 4,000 kbps of total average incoming video. That is rather wasteful and consumes more resources than are necessary. At such bitrates, you may experience reduced video quality due to CPU overload which will end up video data to get unprocessed, leading to a poor video quality and overall experience
The lower the video window on the screen is, the lower the video bitrate for that video channel should be
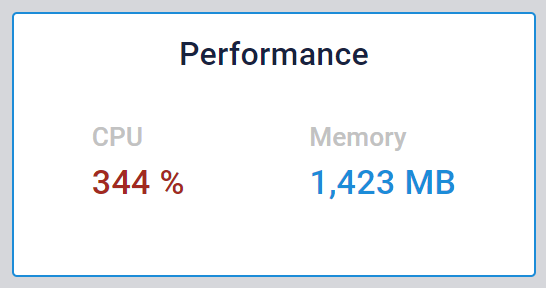
Part of the data collected by testRTC includes machine performance metrics. This information is available for testingRTC and upRTC. When opening test results, you can find the machine performance metrics at the top ribbon bar of the results:
CPU
The CPU metric indicates the percentage of cores throughout the duration of the test run were used by the probe. It should be noted that the size of the probe (i.e., how many cores were allocated for it) is configurable and defaults to 2 cores.
The threshold itself is also configurable and defaults to 90%. This means that for a core count of 2 per probe, the metric will appear in red if its value is above 180%.
Memory
The memory metric indicates the maximum amount of memory allocated by the application on the probe during the test run. It should be noted that the memory available per probe depends on the size of the probe allocated.
The threshold itself is also configurable and defaults to 90% of the memory available for the probe.
The silent GetUserMedia test can now also collect all connected devices and list them in the log
If you are using qualityRTC Invites system, you can now easily duplicate an invite
You can now pass the region parameter in probeRTC to probes you create. Read more on probe options in probeRTC
watchRTC
Please update to the latest version of our SDK. This is important to enjoy some of the new features (and to help us weed out some nagging collection bugs).
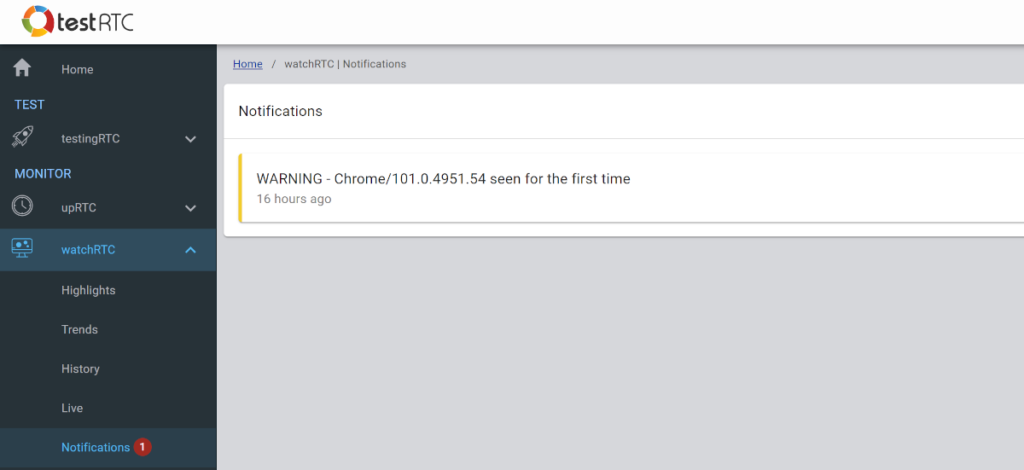
Notifications center
We’ve added a new Notifications center to the watchRTC sidebar.
What’s in there? Indication of new browsers that were seen for the first time. We will be adding some more interesting notifications in there moving forward.
This complements our custom alerts (now renamed from custom notifications) nicely – these are peer/room level notifications while the new notifications center is about deployment level issues.
Ever since we launched watchRTC, we have heard our clients asking to be able to collect console logs. It was time to add this to our watchRTC SDK 🥳
As you can see, we took it a step further and created a new trace window where we show all important logs from the system in a filterable table view. If this will be popular, we will be introducing it to our other services as well.
Our enterprise plans for watchRTC now enable you to stream the aggregate data on peer levels to your own external Business Intelligence system. At a high level view, we’ve got a standardized JSON structure, and we can populate data stream files on AWS S3 or similar storage services.
When you modify the filter of the views for Highlights or Trends, the URL will automatically change to match your filter. This makes it easy to create such filters on your own or to share specific views with others. Oh – and you can save and retrieve them easily as well.
Here and there
The SDK methods addKeys(), setUserRating(), addEvent() now return a Promise that you can await for
We had a bug cropping into the SDK which didn’t close peer connections properly. This has been fixed
Our SDK is now more persistent and will try to reconnect to the server if it gets disconnected
You can now manually connect and disconnect the watchRTC SDK from the server. Why would you want to do that? To collect failures better when you don’t even end up with a peer connection… read more on connecting to watchRTC
Custom events now get queued if they are added when the SDK isn’t connected to the watchRTC server
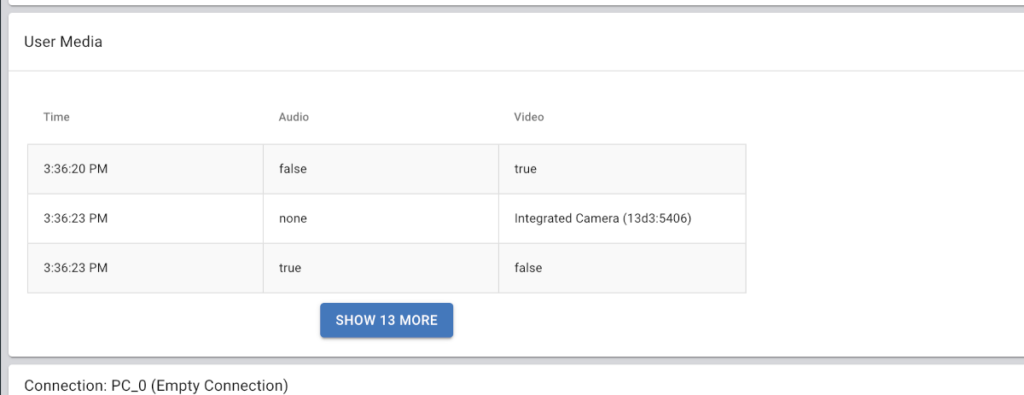
If you’re calling GetUserMedia() a lot in your application, we’re going to squeeze this a bit, so it doesn’t clutter the view in Advanced WebRTC Analytics:
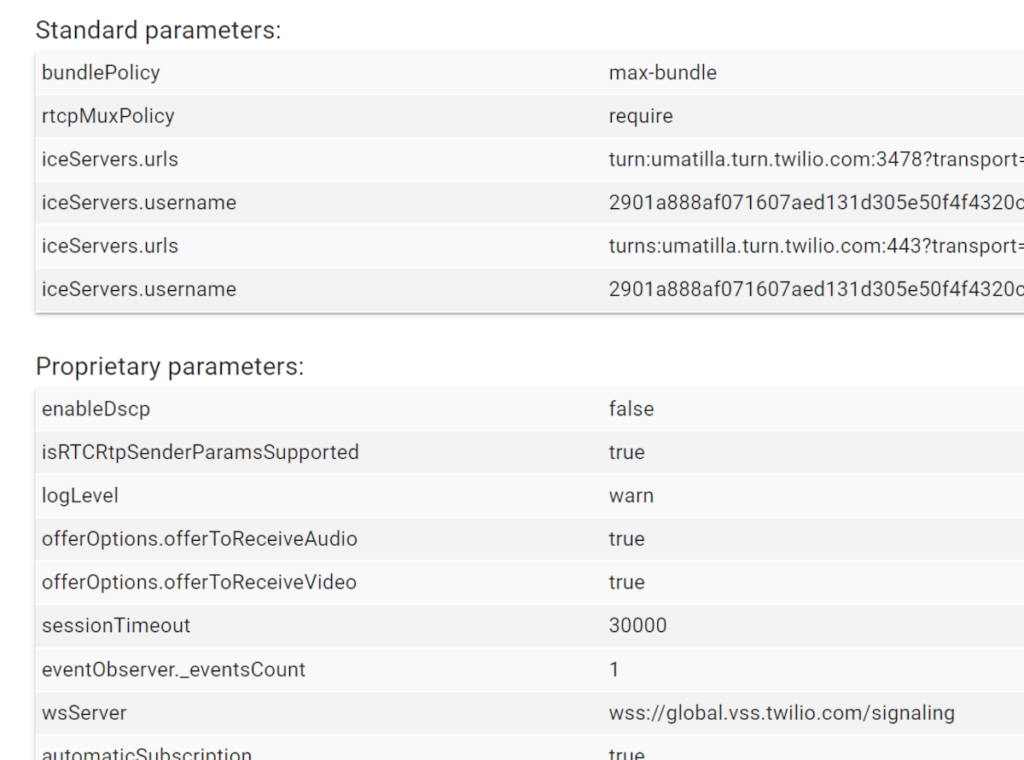
We’ve noted vendors sometimes add their own stuff on the RTCPeerConnection object, making our Advanced WebRTC Analytics peer configuration view hard to read (we’re talking to you Twilio). So we’re now sorting the configuration parameters there to the standard ones and the proprietary ones:
In room details, if there are many peers and pagination is used, we now have pagination controls also at the bottom of the table
Internally we are now maintaining watchRTC allowed domains list in wildcard notation (it used to be substring)
watchRTC has a notification center that holds notification messages the system deems as relevant to your needs. You can reach the notification center by selecting watchRTC | Notifications in the sidebar.
The notification center collects and alerts you of the following conditions:
A new browser version was first seen in the last couple of weeks
Whenever there’s a new browser version, you need to be aware of it
Newer browsers tend to change WebRTC behavior from time to time, so knowing users are now using them in your service can be useful in correlating it with new complaints coming from users
Weekly traffic changes
If the number sessions, peers or minutes changes by more than 5% on a weekly basis, this will be indicated by a notification