Instructs the test run to ignore errors that contain certain text.
rtcIgnoreErrorContains() enables you to force the test to succeed when certain types of failure messages are caught and you’d like to ignore them. This can be useful for web applications trying to connect via localhost addresses to an installed native or Electron application for example (since such attempts throw exceptions in the console log when the application isn’t installed). It can also be useful to ignore failing to load a page’s favicon for example.
Arguments
Name
Type
Description
errorMessage
string
The error text to ignore
Notes
When the errorMessage text appears as a substring of an error or warning message (as exact match) then it will not cause the test to fail or throw a warning
The message itself still gets collected and will show as an issue on the probe level, but will not affect the probe’s test run result or appear in the aggregate test result page
Multiple such commands can be added to a test script as needed
watchRTC offers the ability to set up custom alerts. You can use webhooks in order to catch these custom alerts in your application or external monitoring service.
Once a room is “closed” and analyzed by watchRTC, the custom alerts are checked against. If any of these custom rules apply, then a webhook will be invoked on that given room. The webhook is invoked on the room, detailing all peers and alerts associated with them.
You’ll get the webhook invoked on the room level, but you’ll know exactly which peers had which issues.
Example | watchRTC webhook result
Below is an example body from a watchRTC alert webhook which includes custom keys. It indicates the time and roomId along with an array of the alerts for that room:
watchRTC is our most recent addition to the testRTC product portfolio. It is a passive monitoring service that collects events information and metrics from WebRTC clients and analyzes, aggregates and visualizes it for you. It is a powerful WebRTC monitoring and troubleshooting platform, meant to help you improve and optimize your service delivery.
It’s interesting how you can start building something with an idea of how your users will utilize it, to then find out that what you’ve worked on has many other uses as well.
This is exactly where I am finding myself with watchRTC. Now, about a year after we announced its private beta, I thought it would be a good opportunity to look at the benefits our customers are deriving out of it. The best way for me to think is by writing things down, so here are my thoughts at the moment:
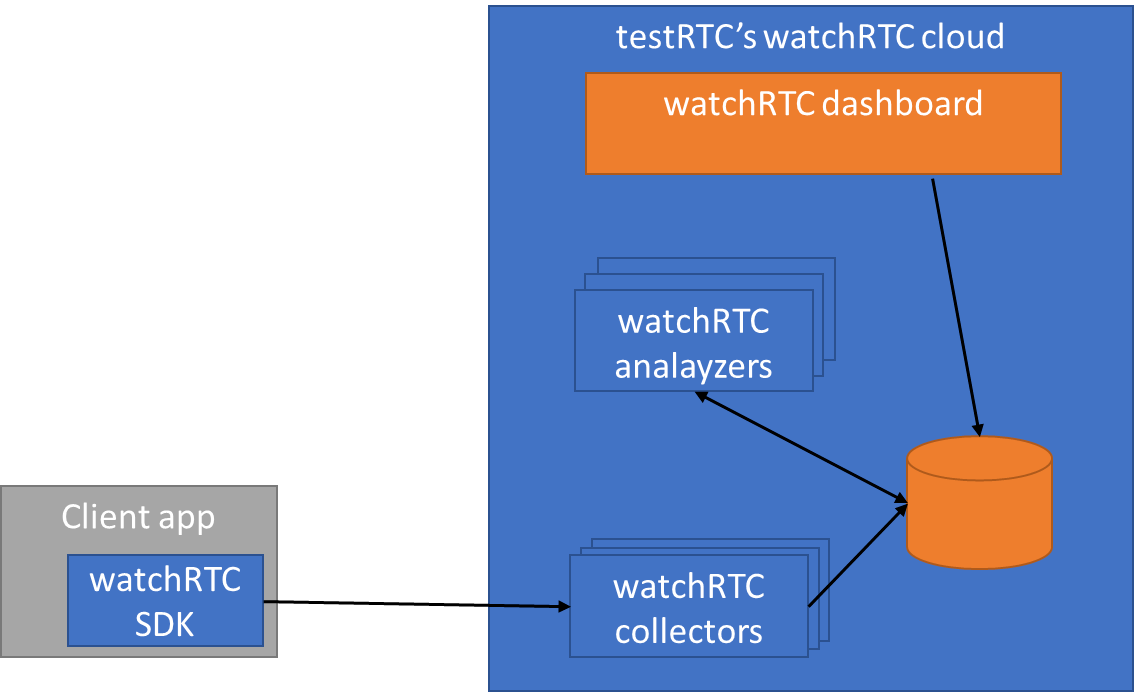
watchRTC collects WebRTC related telemetry data from end users, making it available for analysis in real time and in aggregate.
For this to work, you need to integrate the watchRTC SDK into your application. This is straightforward integration work that takes an hour or less. Then the SDK can collect relevant WebRTC data in the background, while using as little CPU and network resources as possible.
On the server side, we have a cloud service that is ready to collect this telemetry data. This data is made available in real-time for our watchRTC Live feature. Once the session completes and the room closes, the collected data can get further analyzed and aggregated.
Here are 3 objectives we set out to solve, and 6 more we find ourselves helping with:
#1- Bird’s eye view of your WebRTC operations
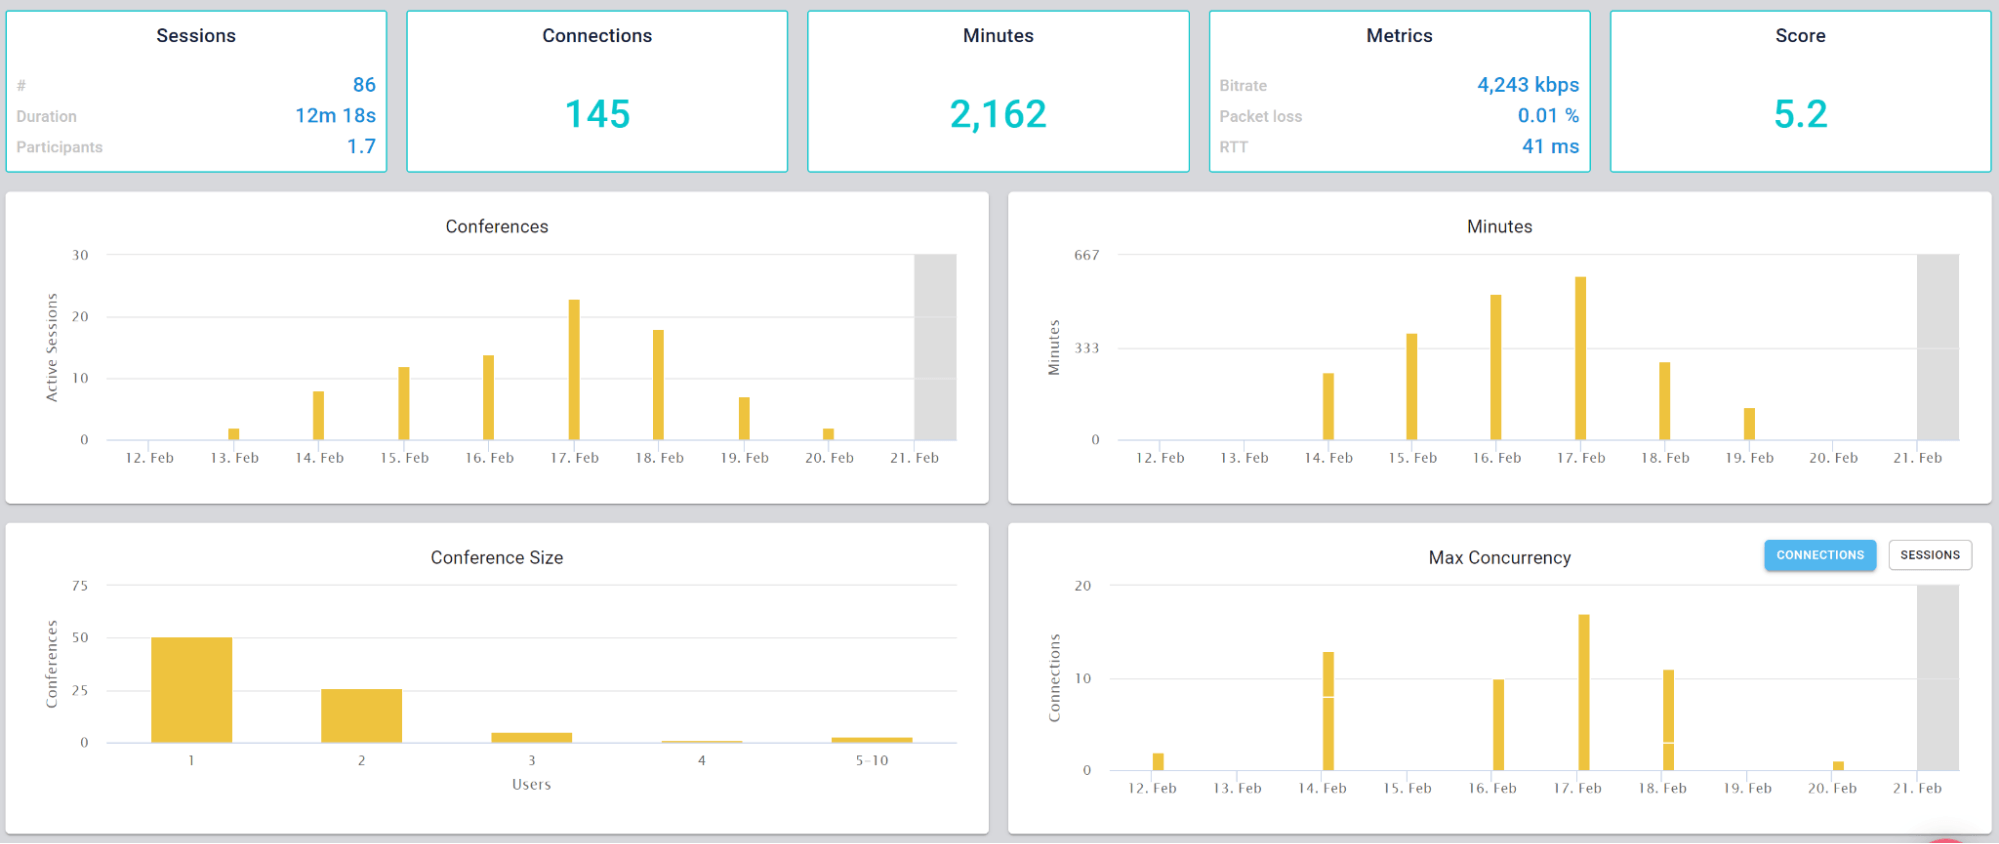
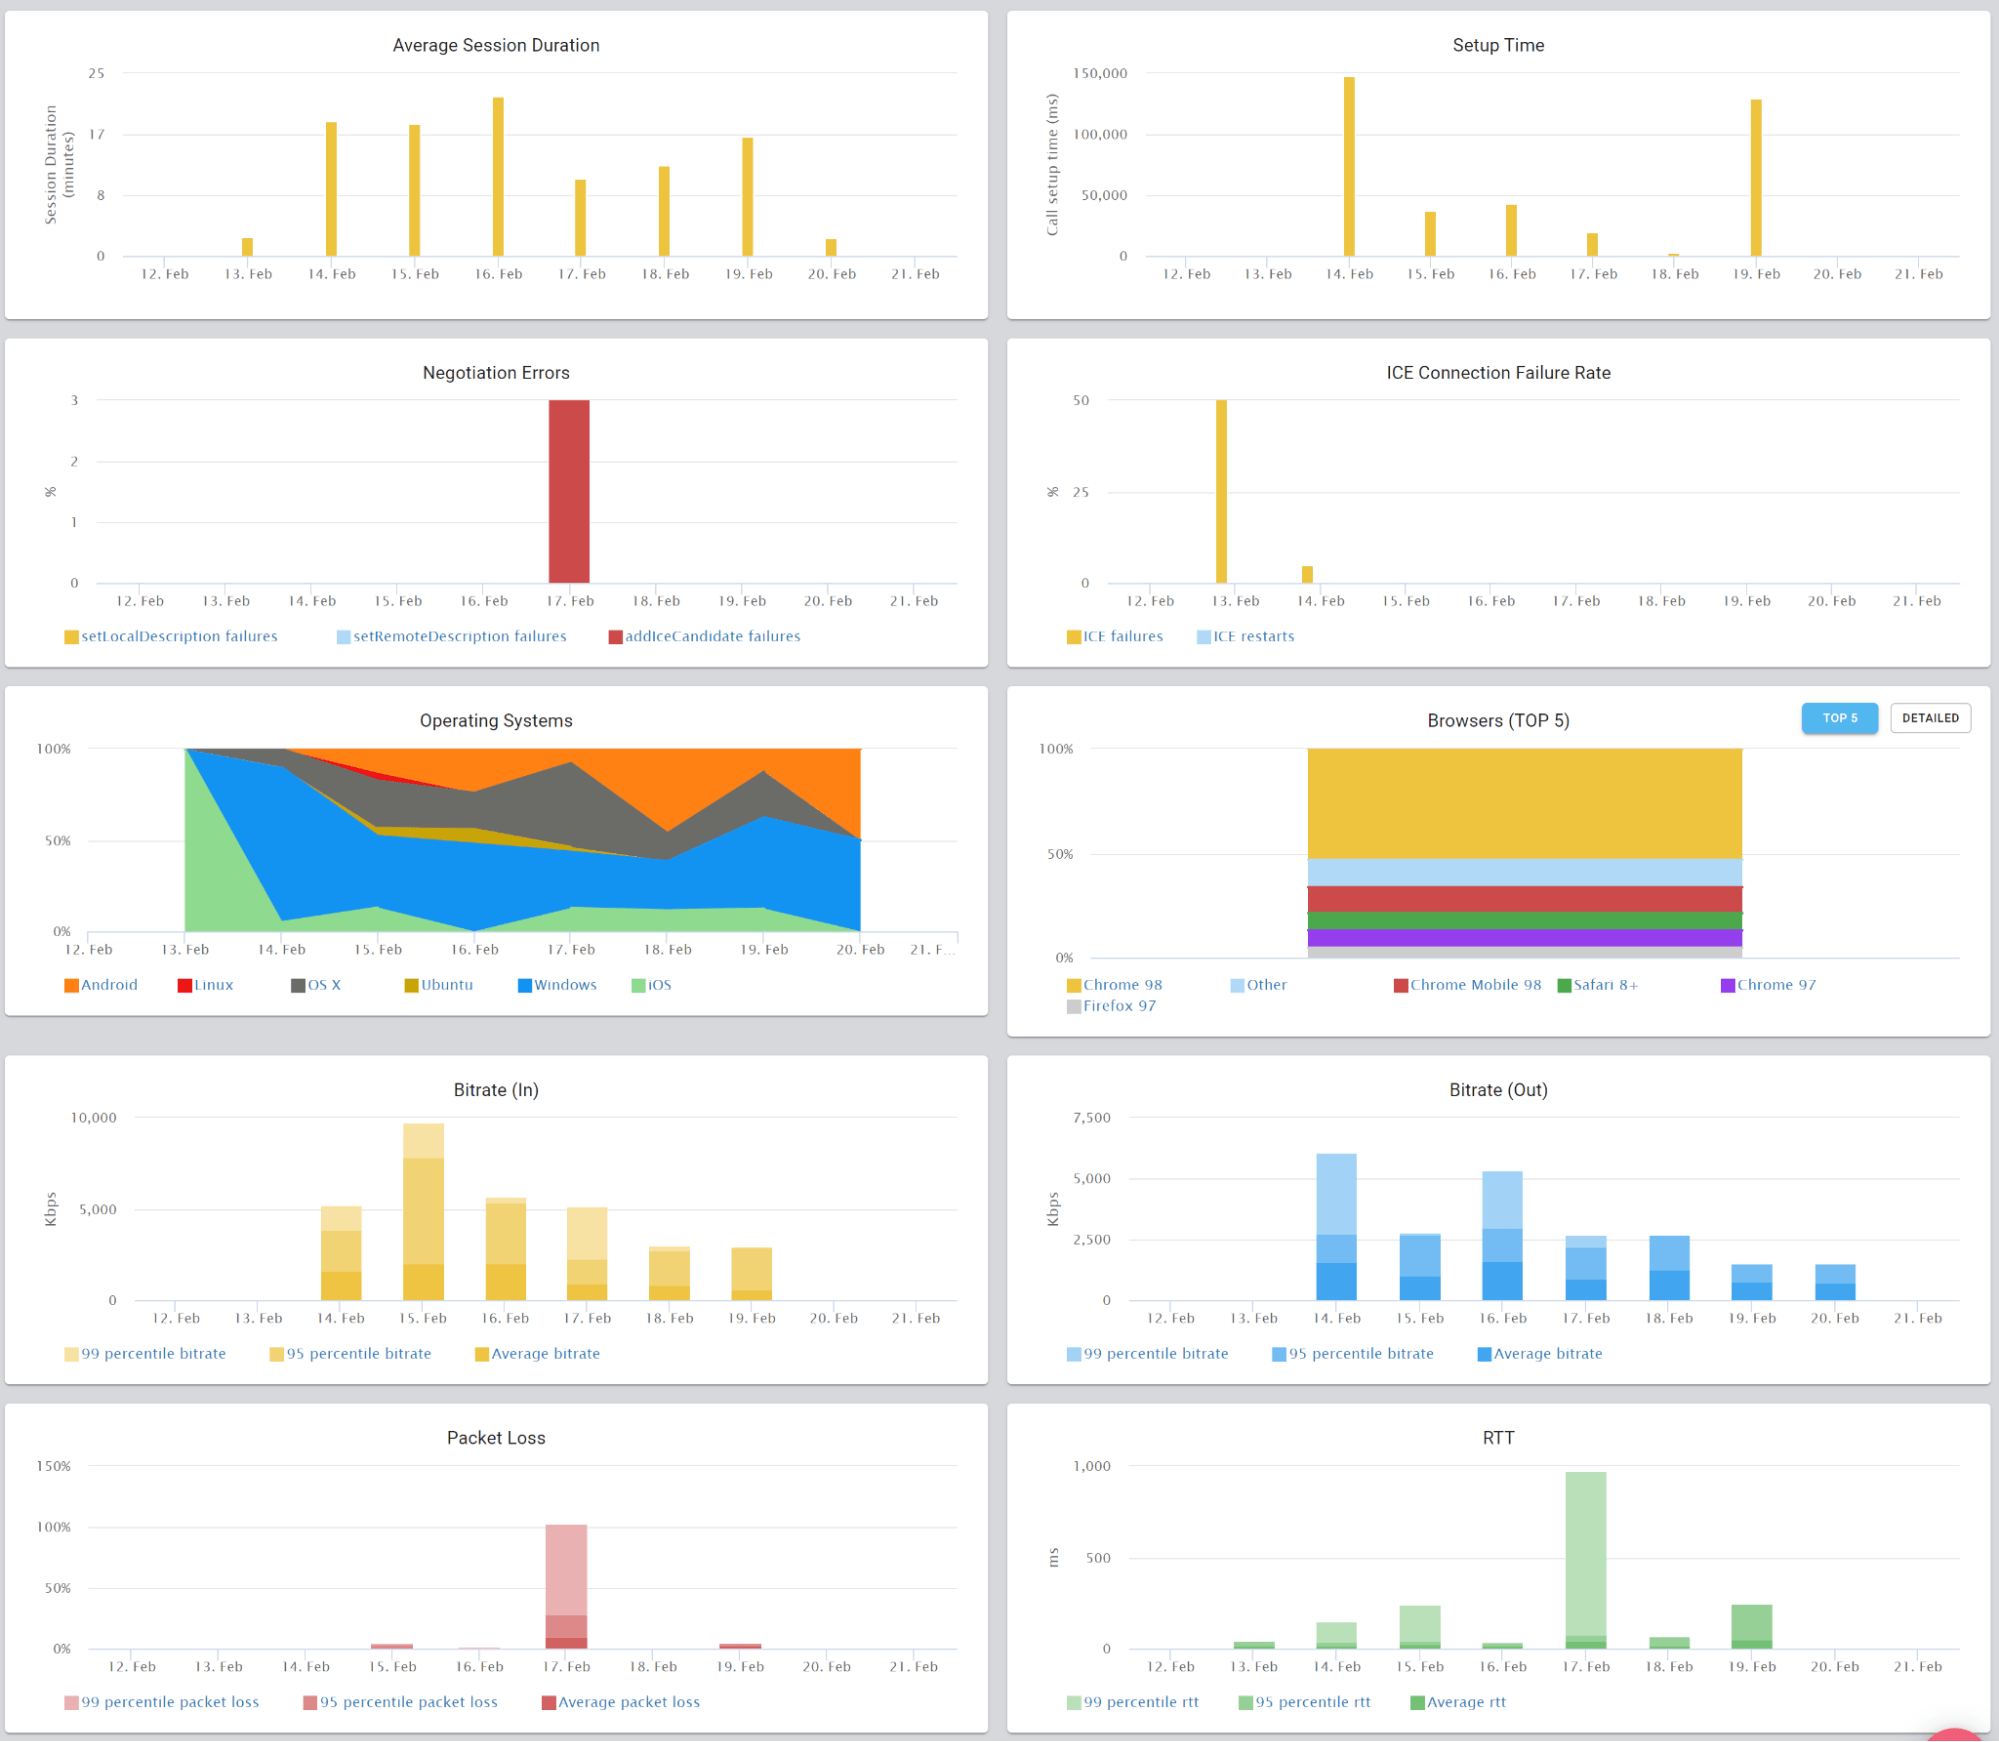
This is the basic thing you want from a WebRTC passive monitoring solution. It collects data from all WebRTC clients, aggregates and shows it on nice dashboards:
The result offers powerful overall insights into your users and how they are interacting with your service.
#2- Drilldown for debugging and troubleshooting WebRTC issues
watchRTC was built on the heels of other testRTC services. This means we came into this domain with some great tooling for debugging and troubleshooting automated tests.
With automated testing, the mindset is to collect anything and everything you can lay your hands on and make it as detailed as possible for your users to use it. Oh – and be sure to make it simple to review and quick to use.
We took that mindset to watchRTC with a minor difference – some limits on what we collect and how. While we’re running inside your application we don’t want to interrupt it from doing what it needs to do.
What we ended up with is the short video above.
From a history view of all rooms (sessions) you can drill down to the room level and from there to the peer (user) level and finally from there to the detailed WebRTC analytics domain if and when needed.
In each layer we immediately highlight the important statistics and bubble up important notifications. The data is shown on interactive graphs which makes the work of debugging a lot simpler than any other means.
#3 – Monitoring WebRTC at scale
Then there’s the monitoring piece. Obvious considering this is a monitoring service.
Here the intent is to bubble up discrepancies and abnormal behavior to the IT people.
We are doing that by letting you define the thresholds of various metric values and then bubbling up notifications when such thresholds are reached.
Now that we’re past the obvious, here are 5 more things our clients are doing with watchRTC that we didn’t think of when we started off with watchRTC:
#4 – Application data enrichment and insights
There’s WebRTC session data that watchRTC collects automatically, and then there’s the application related metadata that is needed to make more sense out of the WebRTC metrics that are collected.
This additional data comes in different shapes and sizes, and with each release we add more at our clients request:
Share identifiers between the application and watchRTC, and quickly switch from one to the other across monitoring dashboards
Add application specific events to the session’s timeline
Map the names of incoming channels to other specific peers in a session
Designate different peers with different custom keys
The extra data is useful for later troubleshooting when you need to understand who the users involved are and what actions have they taken in your application.
#5 – Deriving business intelligence
Once we started going, we got these requests to add more insights.
We already collect data and process it to show the aggregate information. So why not provide filters towards that aggregate information?
Starting with the basics, we let people investigate the information based on dates and then added custom keys aggregation.
Now? We’re full on with high level metrics – from browsers and operating systems, to score values, bitrates and packet loss. Slice and dice the metrics however you see fit to figure out trends within your own custom population filters.
On top of it all, we’re getting ready to bulk export the data to external BI systems of our clients – some want to be able to build their own queries, dashboards and enrichment.
#6 – Rating, billing and reporting
Interestingly, once people started using the dashboards they then wanted to be able to make use of it in front of their own customers.
Interestingly, not all vendors are collecting their own metrics for rating purposes. Being able to use our REST API to retrieve highlights for these, and base it on the filtering capabilities we have, enables exactly that. For example, you can put a custom key to denote your largest customers, and then track their usage of your service using our APIs.
Download information as PDFs with relevant graphs or call our API to get it in JSON format.
#7 – Optimization of media servers and client code
For developers, one huge attraction of watchRTC is their ability to optimize their infrastructure and code – including the media servers and the client code.
By using watchRTC, they can deploy fixes and optimizations and check “in the wild” how these affect performance for their users.
watchRTC collects every conceivable WebRTC metric possible, optimization work can be done on a wide range of areas and vectors as the results collected capture the needed metrics to decide the usefulness of the optimizations.
#8 – A/B testing
With watchRTC you can A/B test things. This goes for optimizations as well as many other angles.
You can now think about and treat your WebRTC infrastructure as a marketer would. By creating a custom key and marking different users with it, based on your own logic, you can A/B test the results to see what’s working and what isn’t.
It is a kind of an extension of optimizing media servers, just at a whole new level of sophistication.
#9 – Manual testing
If you remember, our origin is in testing, and testing is used by developers.
These same developers already use our stress and regression testing capabilities. But as any user relying on test automation will tell you – there are times when manual testing is still needed (and with WebRTC that happens quite a lot).
The challenge with manual testing and WebRTC is data collection. A tester decided to file a bug. Where does he get all of the information he needs? Did he remember to keep his chrome://webrtc-internals tab open and download the file on time? How long does it take him to file that bug and collect everything?
Well, when you integrate with watchRTC, all of that manual labor goes away. Now, the tester needs only to explain the steps that caused the bug and add a link to the relevant session in watchRTC. The developer will have all the logs already there.
With watchRTC, you can tighten your development cycles and save expensive time for your development team.
watchRTC – run your WebRTC deployment at the speed of thought
One thing we aren’t compromising with watchRTC is speed and responsiveness. We work with developers and IT people who don’t have the time to sit and wait for dashboards to load and update, therefore, we’ve made sure and are making it a point for our UI to be snappy and interactive to the extreme.
From aggregated bird’s eye dashboard, to filtering, searching and drilling down to the single peer level – you’ll find watchRTC a powerful and lightning fast tool. Something that can offer you answers the moment you think of the questions.
If you’re new to testRTC and would like to find out more we would love to speak with you. Please send us a brief message, and we will be in contact with you shortly.
As we settle into 2022, it seems like call center agents may continue in their WFH (work from home) mode even beyond the pandemic. This will be done either part time or full time, for some agents or for all of them. The reasons for that are wide and varied, but that’s probably a topic for another time. This time, I’d like to discuss what we are going to do moving forward, to ensure that those reaching out to your call center get the best call quality possible, even when your agents are working from home.
The shift of the call center agent to WFH
Since the pandemic started, those who are able to work remotely have been directed to do so. That includes call center agents – the people who answer the phone when we want to complain, book, order, cancel or do a myriad of other activities in front of businesses. The whole environment and architecture of the call center has changed due to the new world we live in today.
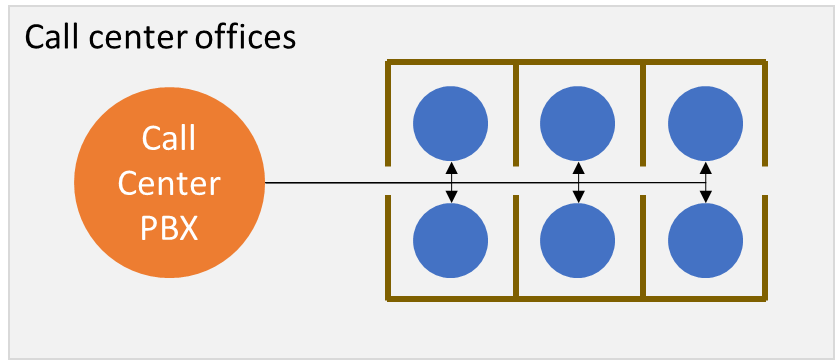
In the past, this used to be the call center:
The call center PBX, the network connections to the agents, the agent’s environment (room), computer and phone have all been in our control and in our office facilities.
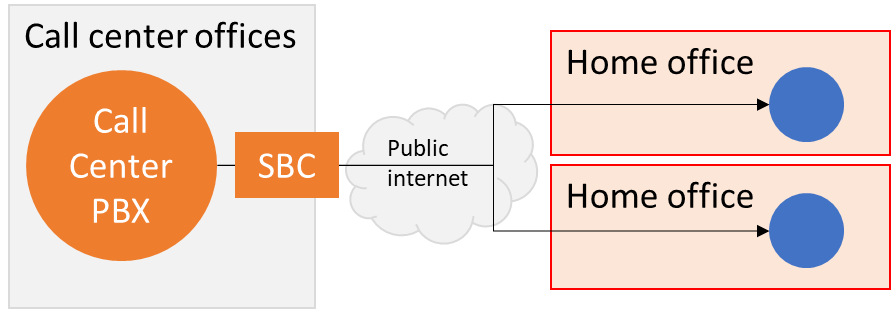
Now? It looks more like this for an on premise call center:
With an on premise call center and work from home agents, we’re likely to deploy an SBC (Session Border Controller) and/or a VPN to connect the agents back to the office. It adds more moving parts, and burdens the internet connection of the office, but it is the fastest patch that can be employed and it might be the only available solution if you can’t or don’t want to run your call center in the cloud.
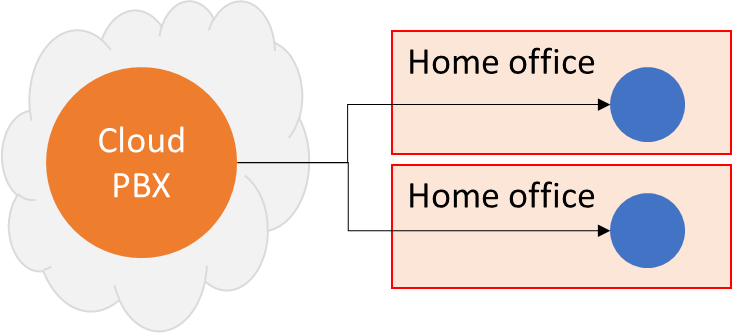
Or this for a cloud call center:
In a cloud call center, the agents connect directly to the cloud from their home office. Just like the on premise call center, the cloud solution ends up with some new challenges. Mainly – the loss of control:
We don’t control the network quality of the agent
The environment of the agent is out of our control
It is likely that the device and peripherals of the agent are still in our control. But that’s not always the case either
And, even with our best intentions in asking the agents to be on ethernet, on a good network and in a quiet environment, they can struggle with doing it well enough.
Can you hear me now?
With work from home call center agents our main challenge becomes controlling their home environment and network.
At home, agents will have noise around them. Kids playing, family members watching television, the neighbors renovating (I had my share of this one during the pandemic), or traffic noises from the street. By using better headsets and noise suppression these can be improved and even solved.
The network is the bigger headache though. Many of your agents are likely to be non-technical in nature. How do they configure their home network? Which ISP are they using and with which communication bundle? How are they even connected to the network – via wifi or ethernet? How far are they from the wifi access point? Who else is using their home network and how? How is their network configured? The answers to the questions above are going to affect the network quality and resulting audibility of their calls. Since we can’t control their network, we at least want to understand it properly to be able to make intelligent decisions, such as routing calls to agents that have better networks and environments or to assist our agents in improving their network and environment.
Assessing a WFH call center agent’s environment
They say that knowing is half the battle. In order to solve a call quality problem you should start from understanding what is causing it, and that comes from understanding the network and environment of your agent. There’s no specific, single solution or problem here, which is why the process usually takes a lot of back and forth interactions between the agent and the IT/support helping them out remotely.
What are the things that you’d like and need answers to?
What machine, operating system and browser is the agent using?
Are they using a headset? Is it a bluetooth one? Is it the one provided to them for this purpose?
Where is the agent located exactly? What ISP are they connected through?
Is the agent using a VPN? Are they behind a firewall? Has someone configured the agent’s DNS servers inappropriately? (you’ll be surprised)
Are their calls directed to the correct call center in a region nearby?
Can their calls flow over UDP or are they forced over TCP?
Are all of your applications needed by the agent available and reachable?
What does the agent’s network look like? Is it fiber? ADSL? Something else? Is their uplink accommodating enough for calling services?
How much VoIP traffic can their network handle?
When the agent connects to the PBX, what call quality do we measure?
Is his network clean or noisy with packet losses and jitter?
What’s the latency like?
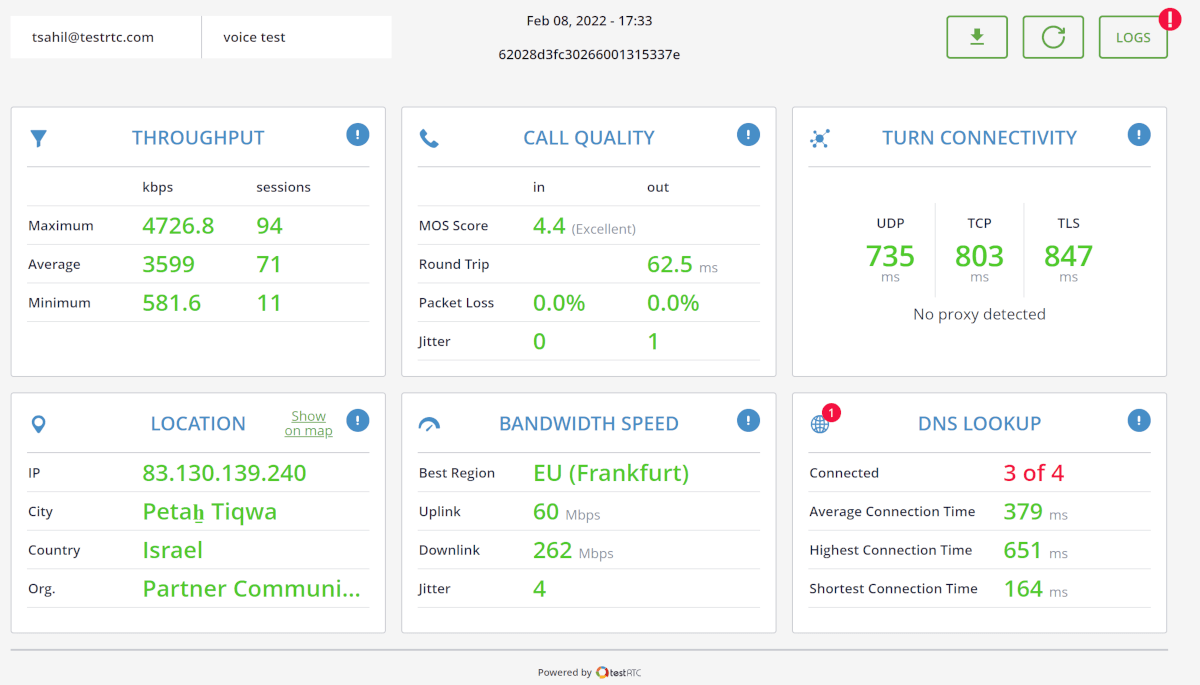
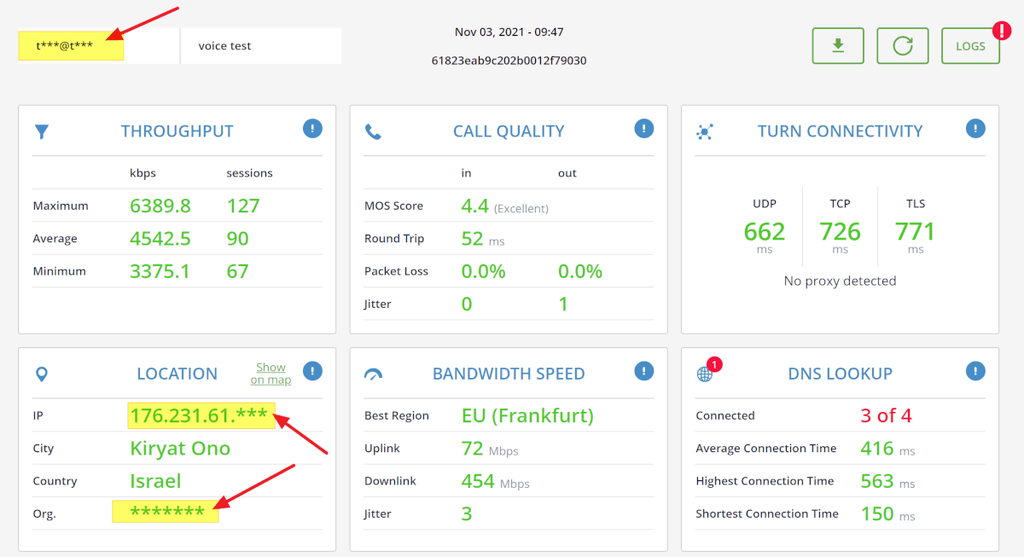
Getting answers to these questions quickly and accurately reduces the handling time of such issues. This is what our clients use our qualityRTC product for – to get the data they need as fast as possible to help them resolve issues sooner.
What’s your workflow?
Each call center has its own nuances – different infrastructure to test and different locations. You have your own workflow and support process to tackle issues. Do you empower agents with self service, or keep close tabs on when and how network tests are conducted? Some would rather have agents test their network daily at the beginning of the shift, while others want that to take place only when issues arise. Large call centers usually need access to the data for BI purposes. Others want to map all their call center agents’ status once in a while – just to understand where they stand.
We’ve built qualityRTC with the help of the biggest call center providers out there, so we’ve got you covered no matter your workflow. qualityRTC is flexible to the level you’ll need to help you in reducing your support strains of WFH agents and get you focused on what really matters – your customers.
If you want to really up your game in WebRTC diagnostics – for either voice or video scenarios – with Twilio, some other CPaaS vendor or with your own infrastructure – let us know. We can help using our qualityRTC network testing solution.
By default, when you give watchRTC a roomId, it will check if that room exists and is open. If it is, then it will add the new peer that just joined into the existing room. If that room doesn’t exist (or got closed), then it will create a new room with that roomId.
watchRTC doesn’t need a roomId to be unique over time – this means that you can reuse a roomId. The roomId will automatically be released and closed when there is no one left in the room. The moment the last peer that is collecting watchRTC statistics leaves the room – the room will close and get analyzed by watchRTC.
There are instances where you’d like rooms to be kept open when no one is left in them. This is usually the case for applications where scheduled events take place, where users might actually join early and then leave and rejoin for example. In such cases, your account on watchRTC can be configured on our end to wait a few minutes until it gets closed.
Doing so will also delay the analysis of the data in the room.
If you would like to configure your account for delayed room closure, please contact our support.
AppRTC is Google’s original sample/demo for a peer-to-peer WebRTC implementation. In December 2021, Google decided to no longer support the hosted version of it and only offer it as a github repository.
In the past, we provided the AppRTC test script as a sample of using our service, but ever since the hosted version of it was removed from the internet, we had to remove it from our own samples.
If you are using it as your baseline, then the script below is a good starting point.
Preparation
The script below creates random URL on AppRTC for the first probe joining the session, and then have the second probe joins the same random URL. You can use the script “as is” – just make sure the service URL points to your server.
Using the test script
In testRTC, create a new test script:
Copy the code from the bottom of this article to your test script (or use the existing sample in your account)
Decide the number of probes you want to use
2 Concurrent probes will be good starting point – keep it at an even number (you need pairs of probes for this)
Session size must be 2 for the AppRTC application to work properly
Replace the Service URL of the script with the URL where your AppRTC signaling server is located
Test execution
Run the script. It does everything for you.
Test script code
/*
This example shows how to automate AppRTC scenarios in testRTC
SCENARIO
* Browser 1 goes to appr.tc and creates a random room
* Browser 1 sends room URL to browser 2
* Browser 2 waits for room URL to arrive
* Browser 2 joins the room
* Both browsers run for 2 minutes
SCALING
To scale the test, change the number of concurrent users.
You can't change the number of users per session, as AppRTC only
allows 2 users in a room.
THINGS TO PLAY WITH
* Probe configurations (look after the script):
- Location of probes
- Media files to use
- Network configuration and quality
- Browser version
* Number of concurrent users (in a paid account. Evals limited to 2 max)
* Service URL - trying VP9 and H264 instead of VP8
NOTES
We've decided to run AppRTC here with VP8 (look at the Service URL above).
Just as easily, testRTC can support VP9, H.264 or any other codec and
feature supported by the browser being used.
*/// Variables that we will use in this examplevar agentType = Number(process.env.RTC_IN_SESSION_ID);
var sec = 1000;
// We set a few expectations. If these don't happen, the test will fail// In AppRTC case, we want to make sure we have:// 1. An incoming and outgoing audio and video channels// 2. Media being sent on these channels
client.resizeWindow(1280, 720)
.rtcSetTestExpectation("audio.in == 1")
.rtcSetTestExpectation("audio.out == 1")
.rtcSetTestExpectation("video.in == 1")
.rtcSetTestExpectation("video.out == 1")
.rtcSetTestExpectation("audio.in.bitrate > 0")
.rtcSetTestExpectation("audio.out.bitrate > 0")
.rtcSetTestExpectation("video.in.bitrate > 0")
.rtcSetTestExpectation("video.out.bitrate > 0");
if (agentType === 1) {
// Browser 1 actions take place here// Open initial AppRTC URL and join a randomly allocated room
client
.url(process.env.RTC_SERVICE_URL)
.waitForElementVisible('body', 10*sec)
.waitForElementVisible('#join-button', 10*sec)
.pause(1000)
.click('#join-button')
.waitForElementVisible('#videos', 30*sec)
.waitForElementVisible('#room-link', 30*sec)
.pause(5*sec)
.rtcScreenshot("Alone in call")
// Send the room URL to the second browser
.url(function (result) {
this.assert.equal(typeof result, "object");
this.assert.equal(result.status, 0);
var roomUrl = result.value;
this.assert.equal(!!roomUrl, true);
client
.rtcInfo('Sending Room url %s', roomUrl)
.rtcProgress("Waiting @ " + roomUrl)
.rtcSetSessionValue("roomUrl", roomUrl);
});
} else {
// Browser 2 actions take place here// Wait for Browser 1 to send us the URL for this call
client
.rtcWaitForSessionValue('roomUrl', function (urlToJoin) {
client
.rtcInfo('Joining ', urlToJoin)
.rtcProgress("Joining " + urlToJoin)
.url(urlToJoin)
.waitForElementVisible('body', 30*sec)
.waitForElementVisible('#confirm-join-button', 30*sec)
.pause(2*sec)
.rtcScreenshot("Joining")
.click('#confirm-join-button')
.waitForElementVisible('#videos', 30*sec);
}, 30*sec);
}
// Now that the browser is connected and in the room, we wait
client
.pause(60*sec)
.rtcScreenshot("in call")
.pause(60*sec)
.rtcProgress("Bye");Code language:JavaScript(javascript)
It was time to give the breadcrumbs some love and attention. We’ve normalized them across the dashboard pages and also pushed them to the header so you’ll have more room for the actual content
We’ve changed the icons for our products, streamlining them as well. We think the new ones look better
There are now new Settings menus for both upRTC and watchRTC, making it easier than ever to configure these products
testingRTC & upRTC
Analysis
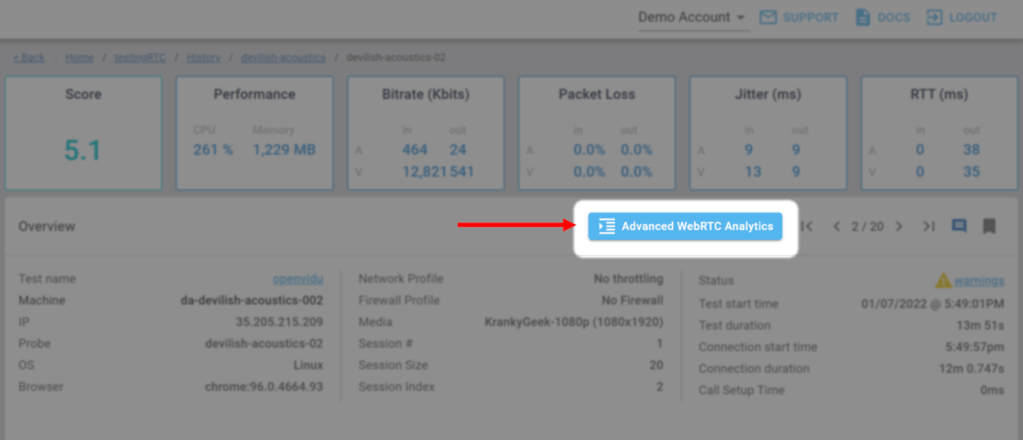
We moved the Advanced WebRTC Analytics button to the Overview section at the top of the page
Sizing buttons have been merged from 3 into a single button, making room for more controls
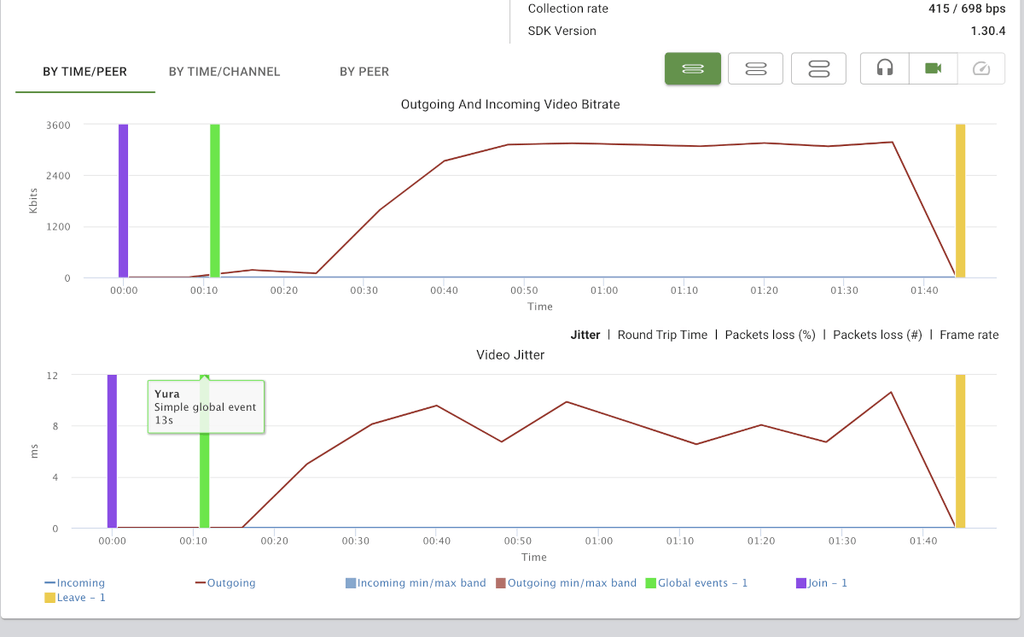
Speaking of controls, we now have stacked bitrate graphs
You might have noticed in the moving image above, we’ve also added some threshold values and ranges to some of the metrics in our graphs, making it easier than ever for you to focus on the areas affecting user experience and media quality
We’ve added some tooltips to the charts we show – both aggregate as wella s the single probe/peer ones. The intent here is to make these charts simpler and more approachable to our first time users
Call end indicator on high level charts now also show the exact probe that finished first and left the session
Incoming video jitter is now a first class citizen in our analysis throughout testRTC. That’s after Chrome 94 finally reports it properly and we can rely on the results we see there
There are times when there are just too many empty peer connections. These are used as placeholders, or for running different checks in application logic. We’re bumping into them more, so we decided to hide them in the Advanced WebRTC Analytics. They are still there if you’ll need them, but you won’t have to worry about seeing them too much
You know how mediasoup generates these nagging 1234 SSRC channels? Well, we now catch these and… make them go away, so when you use mediasoup, our dashboards are clean, pristine and usable. You can still access these 1234 channels through the Advanced WebRTC Analytics if you need to
Best effort mode was something we introduced this year. We now make it clear in the results that it was kicked in and how many probes were actually used
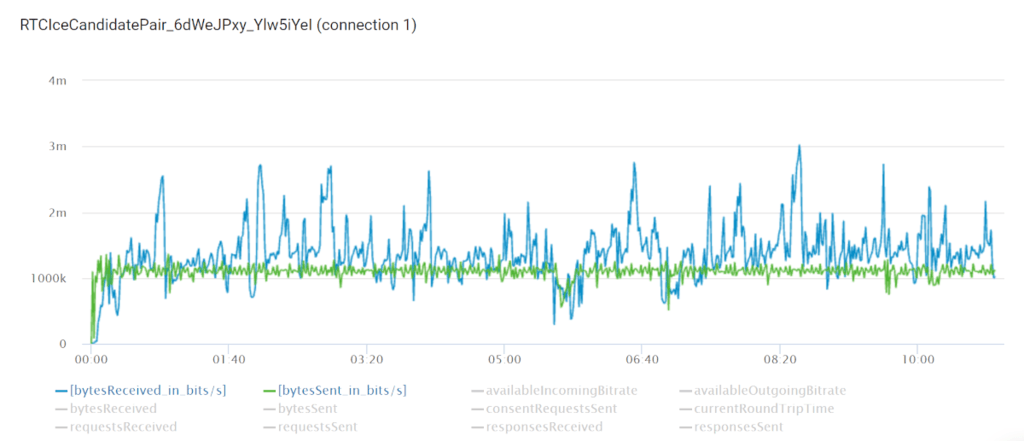
Oh, and in Advanced WebRTC Analytics we now also show bytesSent (in bits/s) and bytesReceived (in bits/s) for ICE candidate pairs:
qualityRTC
Improved PII
While qualityRTC collects very little data, we can now provide even more privacy.
Accounts can now be configured to redact identifiable information in the form of emails and IP addresses after a set amount of time.
As more and more integrations are created and worked on for our clients, we’ve decided to standardize the mechanism used to provide dynamic configurations in qualityRTC. This is done via a new REST API definition.
When you use your own speed testing machines, you can now install them in an active-active configuration, where the speed testing test will take place even when one of these machines are down.
watchRTC
Please update to the latest version of our SDK. This is important to enjoy some of the new features (and to help us weed out some nagging collection bugs).
Improved PII
While qualityRTC collects very little data, we can now provide even more privacy.
By default, we already “scrubbed” local IPv4 addresses. This has been extended to remote IP addresses and also to IPv6 variants.
Note that by default, watchRTC does not store any IP addresses – just redacted ones.
Custom notifications
UPDATE: In a later release, we’ve renamed custom notifications to custom alerts.
We are beefing up our data analysis and aggregated insights for watchRTC. The next step in this journey is the introduction of custom notifications. You can now decide what quality metric thresholds to use in watchRTC to indicate warnings or errors as notifications. These will then be automatically calculated across all sessions, highlighted and aggregated.
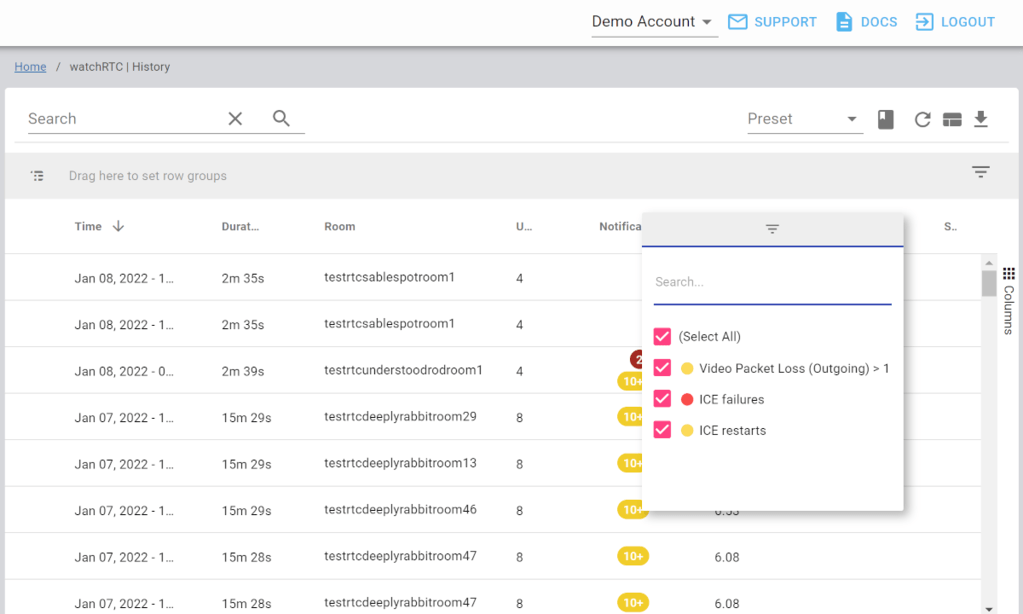
While at it, we’ve added two predefined notifications that you can filter in the History view – ICE failures and ICE restarts.
You can now indicate your own events to watchRTC via the SDK’s watchRTC.addEvent() function. When doing so, you’ll need to name the event and pick a type for it – events can appear only on the event log, show up on the peer’s graphs or also show up on the room level graphs. All depending on what it is you want to convey.
This is good for indicating mute/unmute events, screen sharing or any other application logic that is important for you to track.
Stream mapping
You know how mind boggling it is to convert the SSRC information into who sent what when looking at large group calls?
Well, you can now just let watchRTC know what are the names of the incoming streams and it will handle all that nagging part for you.
watchRC live which debuted in our last release is great. So great that we had clients complain already that they want it to work also on peers that left the room while the room is still running.
So now they can 😎
On top of that, we now show the location of the peers when you look at the Live table.
Analysis
Some browsers don’t support parameterless setLocalDescription() calls yet, but since this is something we’ve seen developers use, we had to make sure to support it as well, so now we do
IPv6 is now better supported. We display it properly and resolve location information based on it when possible
We now collect icecandidateerror and share that in the events log
Talking about collecting events, we also collect RTCRtpSender.setParameters() – Jitsi users of our service said this one is really handy for them
Here and there
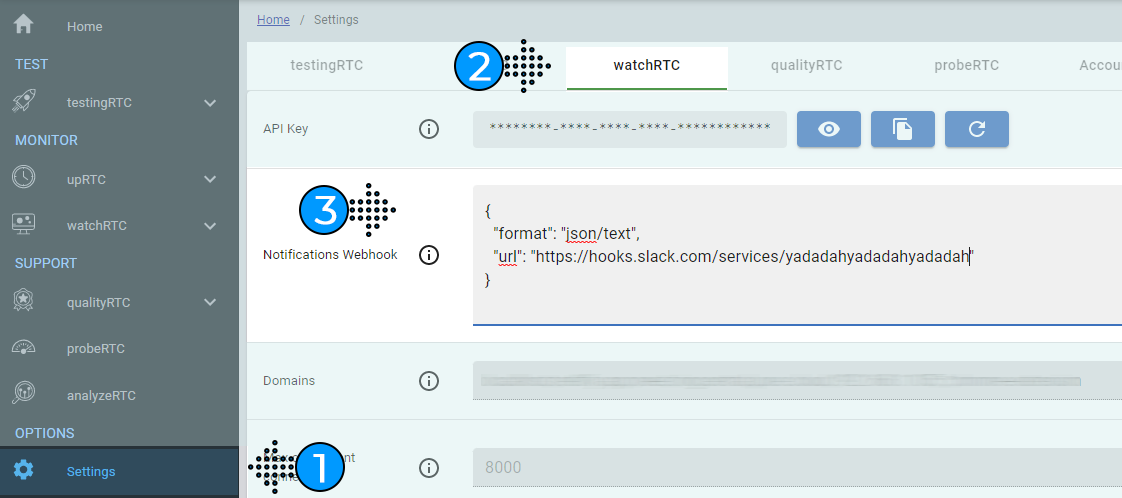
You can now configure your API key for watchRTC and regenerate it on your own. Just go to Settings | watchRTC for that
Custom keys can now have multiple values (if that’s what you need). More on that in our explanation on custom keys
Also, custom keys now show a lot nicer in the results and can be copied easily via the icon next to them. This is especially useful when their values are used as identifiers in other systems
We’ve added a new POST /watchrtc/highlights REST API. This enables you to pull out the aggregate highlights for the data collected by watchRTC
In the highlights dashboard we now show call setup time in milliseconds instead of seconds
Media channels in watchRTC are labelled based on the names assigned to them by WebRTC, which usually revolves around the SSRC of the streams.
In group sessions this can make figuring out which incoming channel comes from which participant in the session quite time consuming. To make this simpler, you can use watchRTC.mapTrack() API in the SDK to let watchRTC know what display name to use for the incoming streams:
watchRTC.mapTrack(id,name);
Where id is the RTCMediaStreamTrack with the trackIdentifier we wish to map, and name is the display name to associate with it.
Using this will cause the incoming channels on that media stream to show the display name instead of the track identifier, making it easier to associate the incoming media with its original sender.
For example, if you want to map the track identified by “oUx4qq5T0xvng4vr9XISNwZnGv0cIl0xSGxJ”, to the display name “John Doe”, then we would use:
watchRTC has a mechanism called alerts. With this mechanism, whenever a session completes and its collected data gets analyzed, watchRTC will review it against its own internal logic as well as thresholds you configure manually.
These thresholds are called custom alerts. They are rules related to media metrics in WebRTC, where you can define for example that a packet loss above 4% in incoming video channels should be considered as an issue to review later – either setting it up as a warning or an error.
watchRTC checks these custom rules and marks the peers and the rooms with the relevant warning and error messages.
You can setup custom alerts on the following metrics:
Alerts can be configured as errors or warnings. watchRTC makes no distinction of its own between the two – they are given as a means of providing different alert levels for your own monitoring logic.
Predefined alerts
watchRTC has its own predefined alerts. These will be automatically analyzed and available to you as well. They are focused around connectivity of sessions – mainly ICE failures and ICE restarts. You can filter these in the History view to understand such failure reasons.
Setting up custom alerts
To setup custom alerts, go to Settings | watchRTC and scroll down to the Alerts section at the bottom.
There, you can create or edit custom alerts for your account:
Pick the metric you want to be notified about
Decide on the operator to use (Greater, Lower, Equal)
Pick the threshold for the metric
Choose the type of alert – warning or error
Give a verbose message for the alert
And activate the alert
Once activated, all new sessions conducted and collected by watchRTC will start showing the alerts if needed. Older sessions will remain unaffected.
Reviewing alert highlights
At the bottom of the watchRTC | Highlights page you will find the Alerts table.
This table will display how many sessions and peers were found with each of the alerts configured. The actual timeframe and filter used for these numbers are based on how you filter this page.
Clicking a specific alert in this table will take you to the watchRTC | History page with the same filter with the details of the alerts. Note that you will only see in the history view the data available from the retention period of your account.
History filtering for alerts
When you look at the watchRTC | History page, where all sessions are detailed, there is a Alerts column. You can use it to filter out and review rooms that had specific aletrs on that. These alerts will include the automatic alerts available on watchRTC as well as the custom alerts you configure.
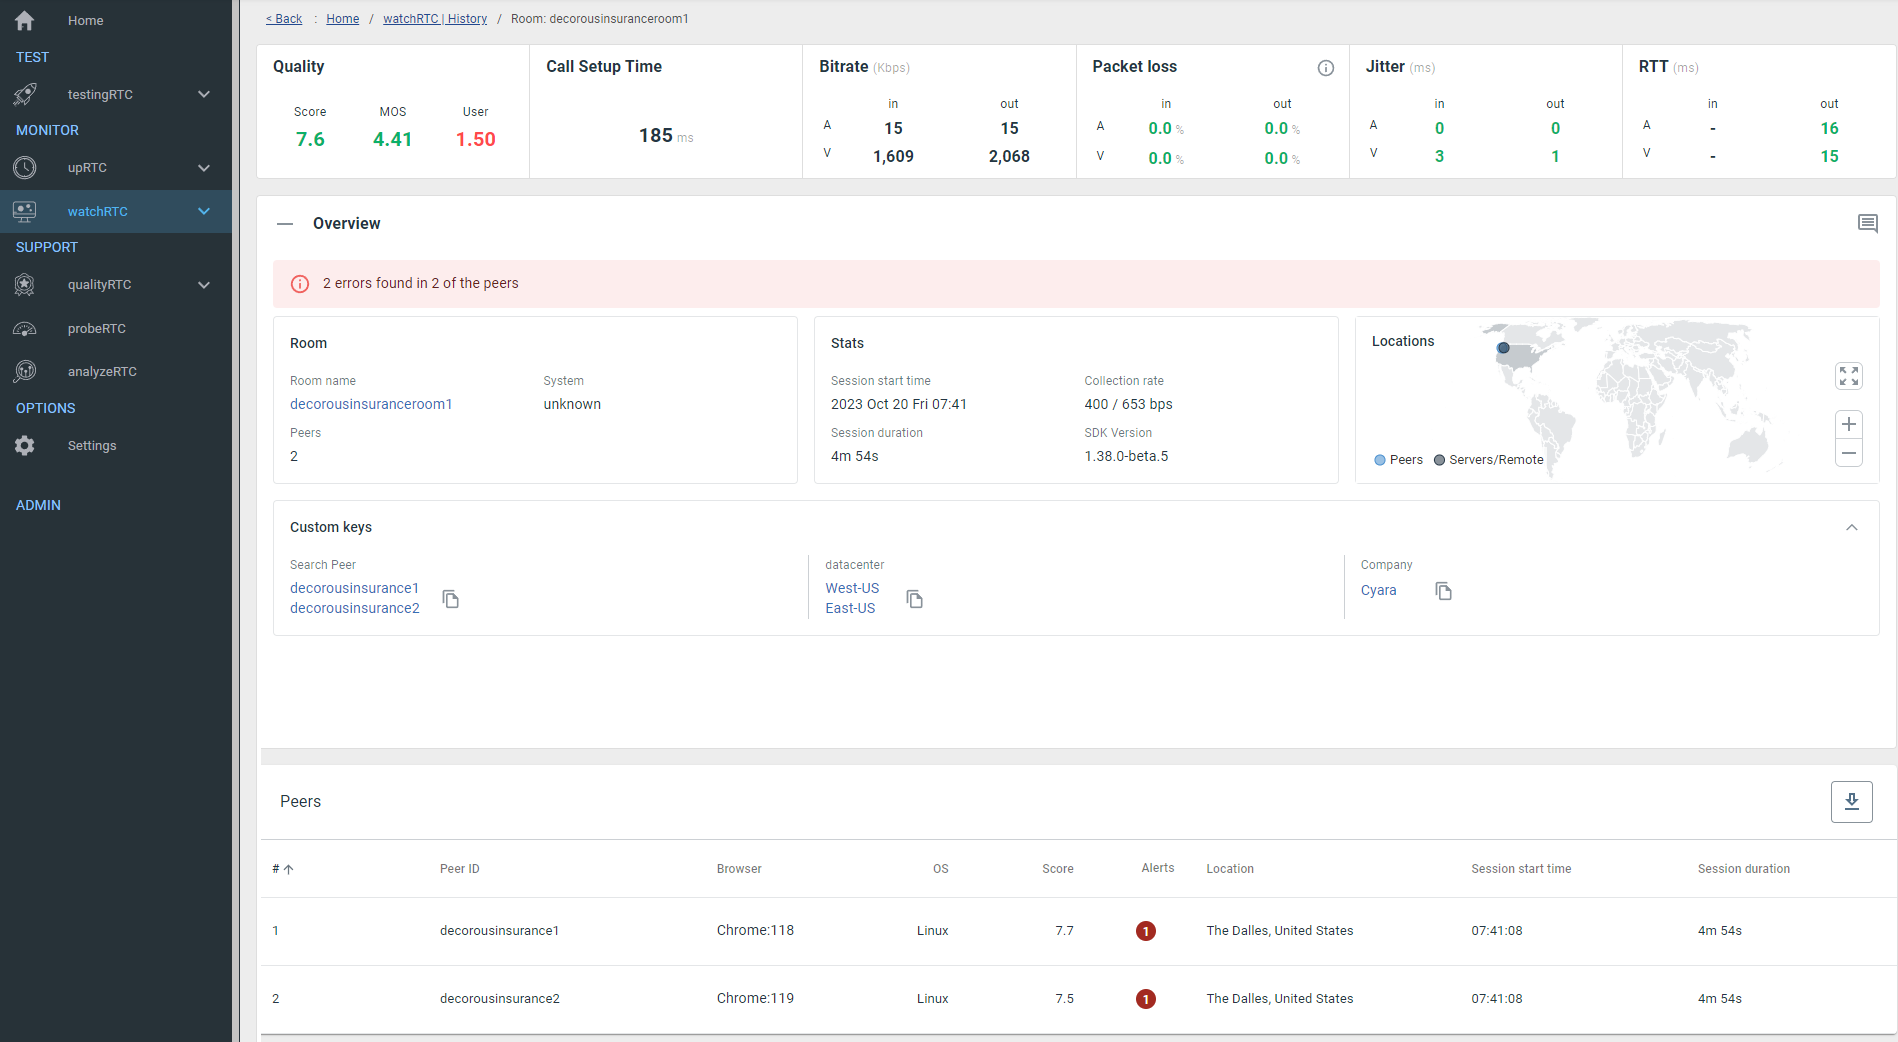
Individual room/peer alerts
Once you drill down into a specific room, the alerts of all the rooms will appear on the page. This includes an alert above the chart and as indicators in the peers table.
Drilling down to any of the peers will also show you the details of the alerts on that peer.
Catching alerts with webhooks
You can also catch custom alerts in watchRTC using webhooks.