We’ve seen complaints by some of our customers that the packet loss we report in our service is sometimes unreasonable.
The way we collect the media metrics is by using WebRTC’s getStats() API, so whatever the browser tells us is what gets collected on our end.
We have noticed that this happens when the service in question processes media on the server side, which means it has its own media engine code that implements SRTP and SRTCP. Since many of the metrics collected by the browser stem from incoming SRTCP packets, a reasonable reason is that the incoming reports are wrong. This isn’t an issue in testRTC but in the system under test, which has to be fixed.
This is a good example of how that can manifest itself in our reports. This is an alert for an outgoing channel with high packet loss.
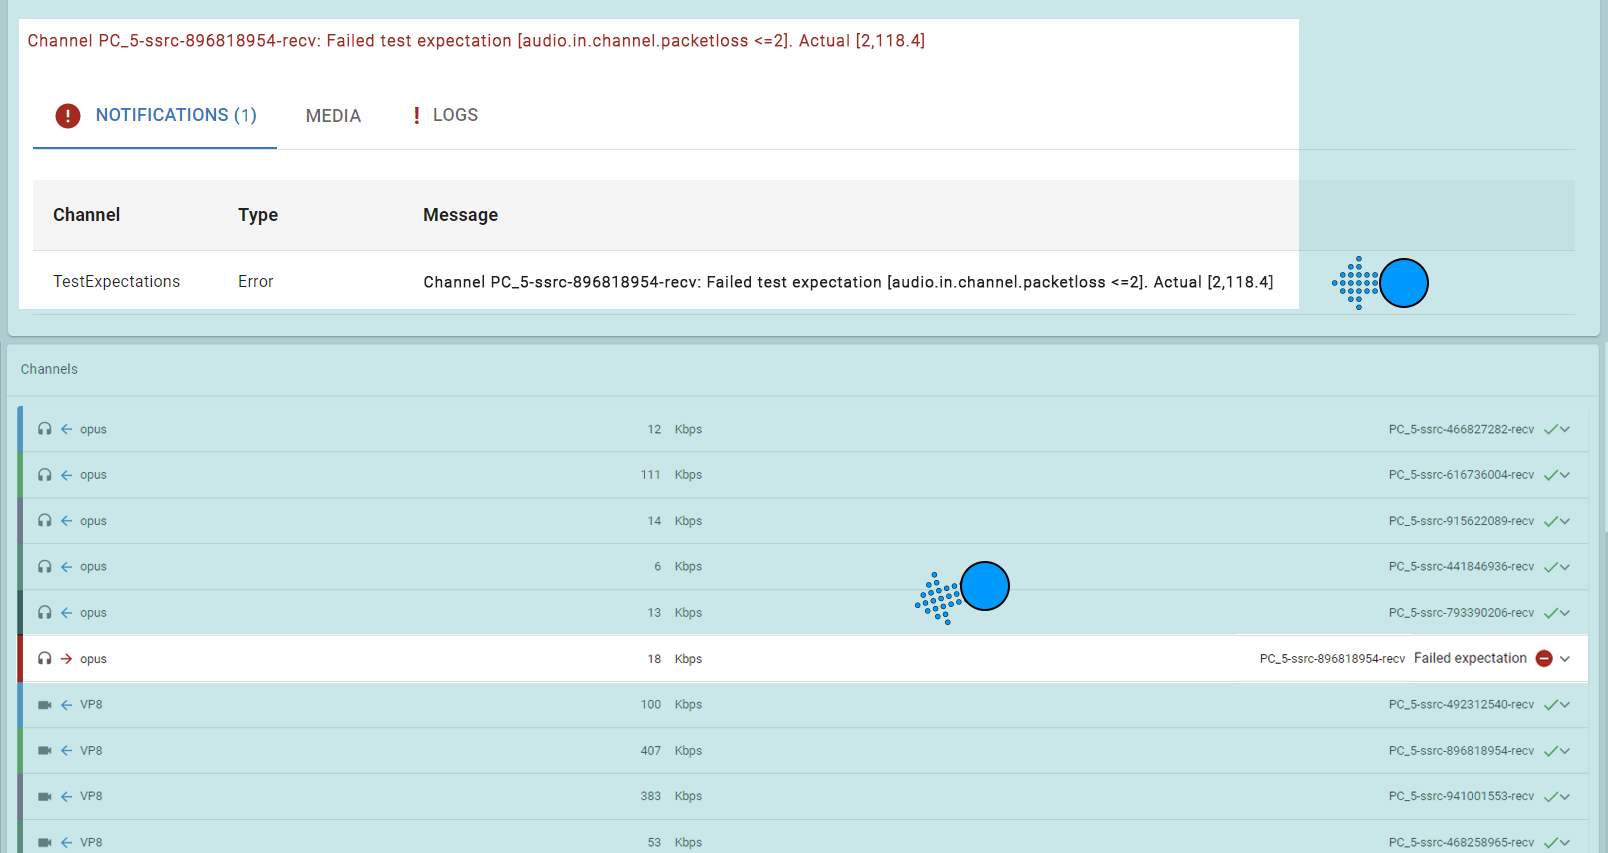
When we click into this channel we can see the details of the warning/error.
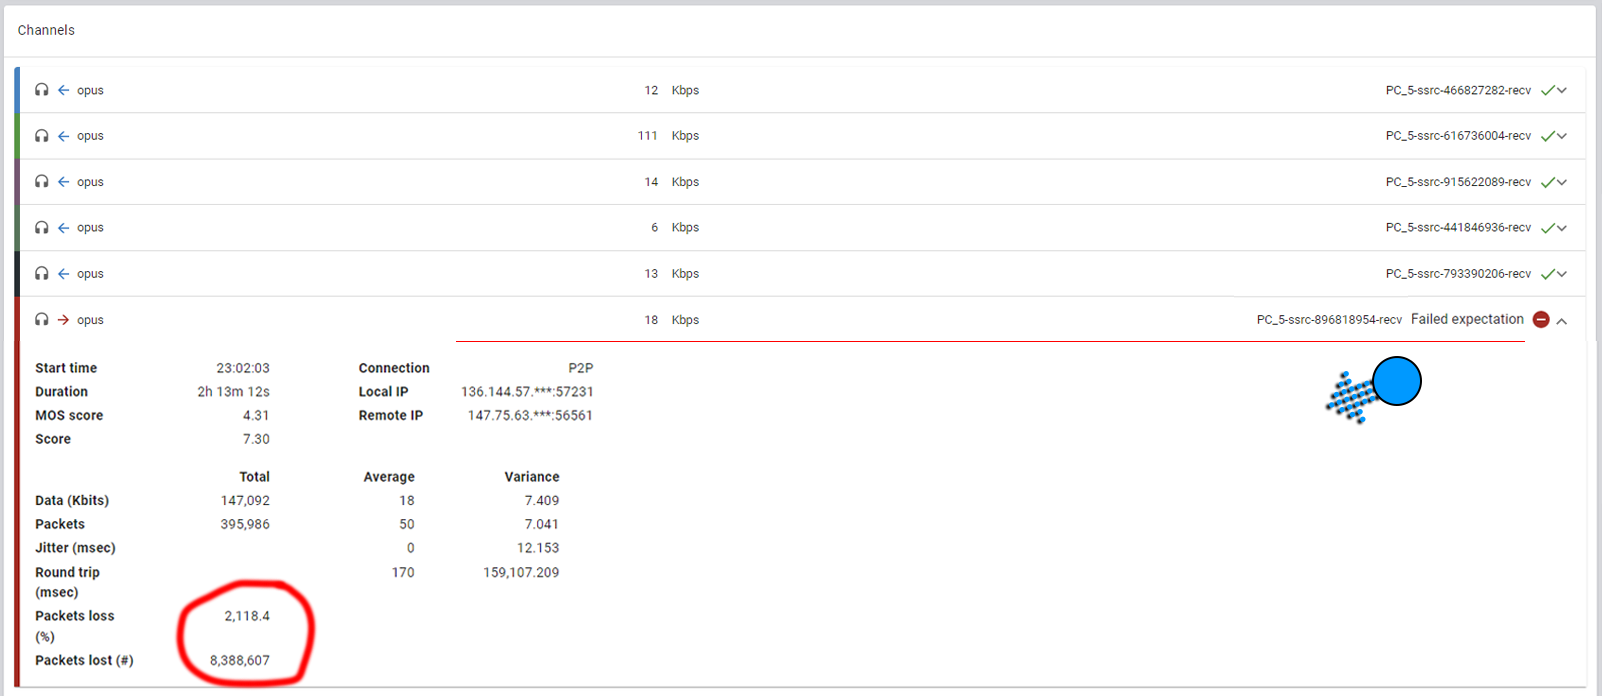
In cases like these, when packet losses are above 50% it usually means an unreasonable statistic reported by the service. In this case, over 2000% is plain impossible.
Note: To know the packet loss on an outgoing channel, the browser relies on incoming SRTCP receiver reports. These are reported by the media server.
Looking further in the same report, we see this:
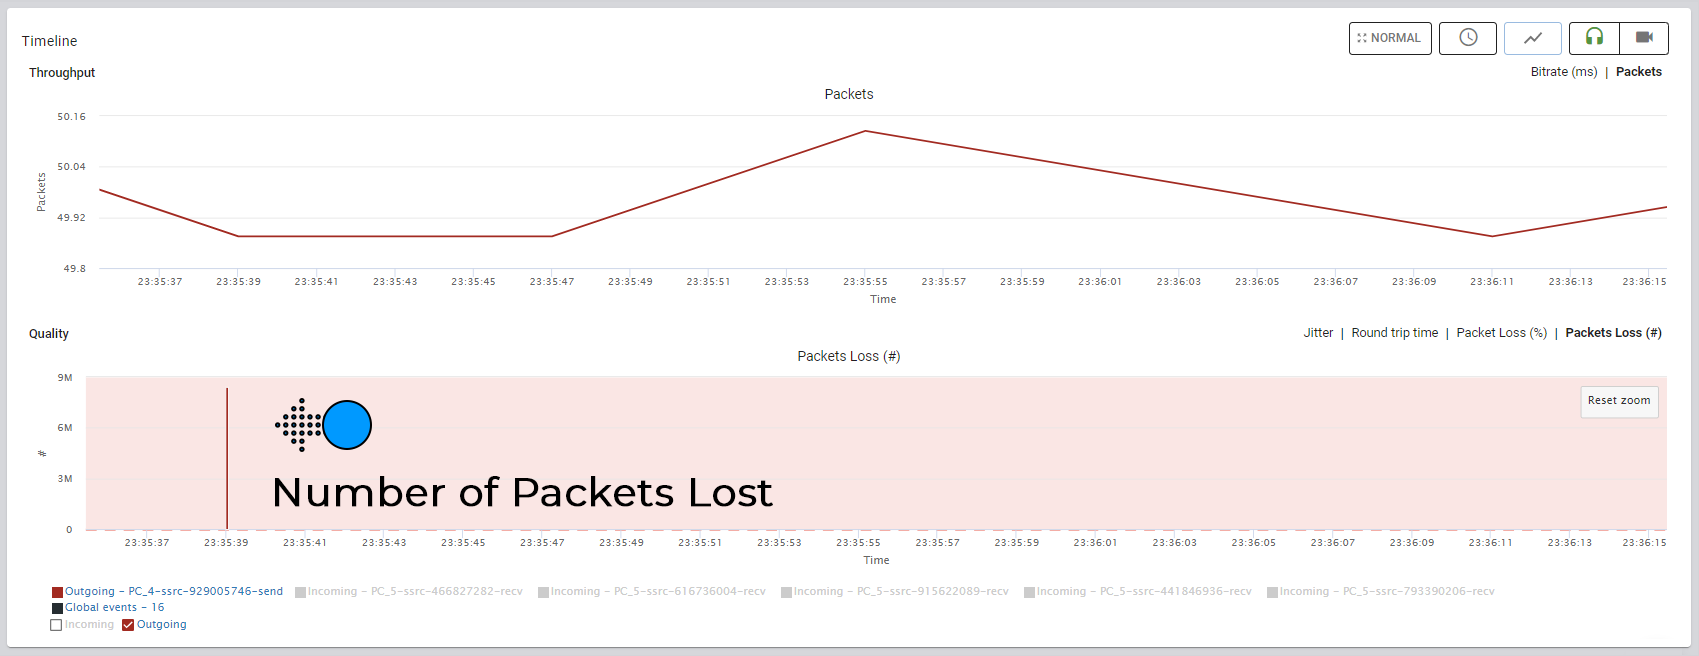
The number of packets lost here is in the millions, which makes no sense at all – there aren’t this many packets sent in such short time spans and the intervals here are also suspicious.
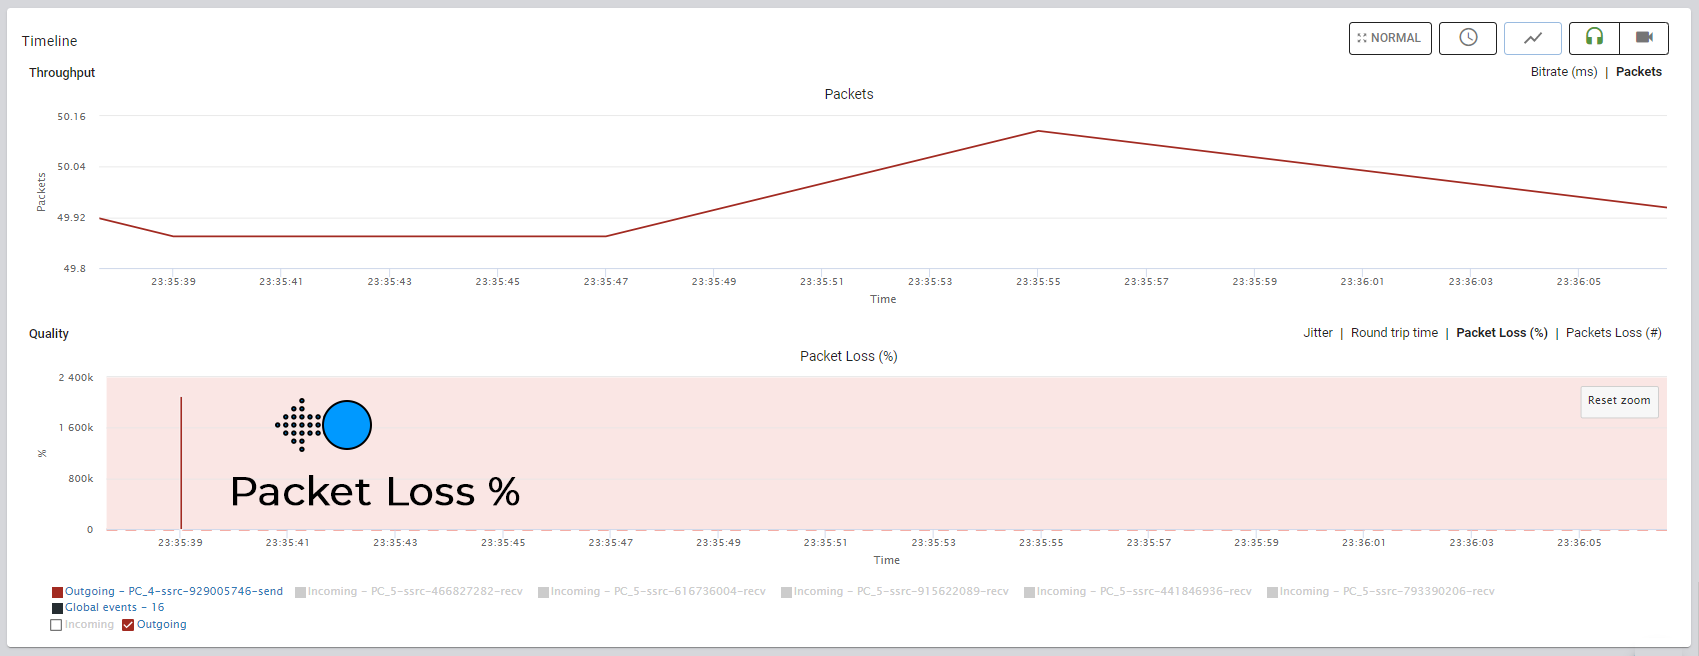
The unreasonable initial spike at the beginning of the media session indicates a wrong value reported by the media server.