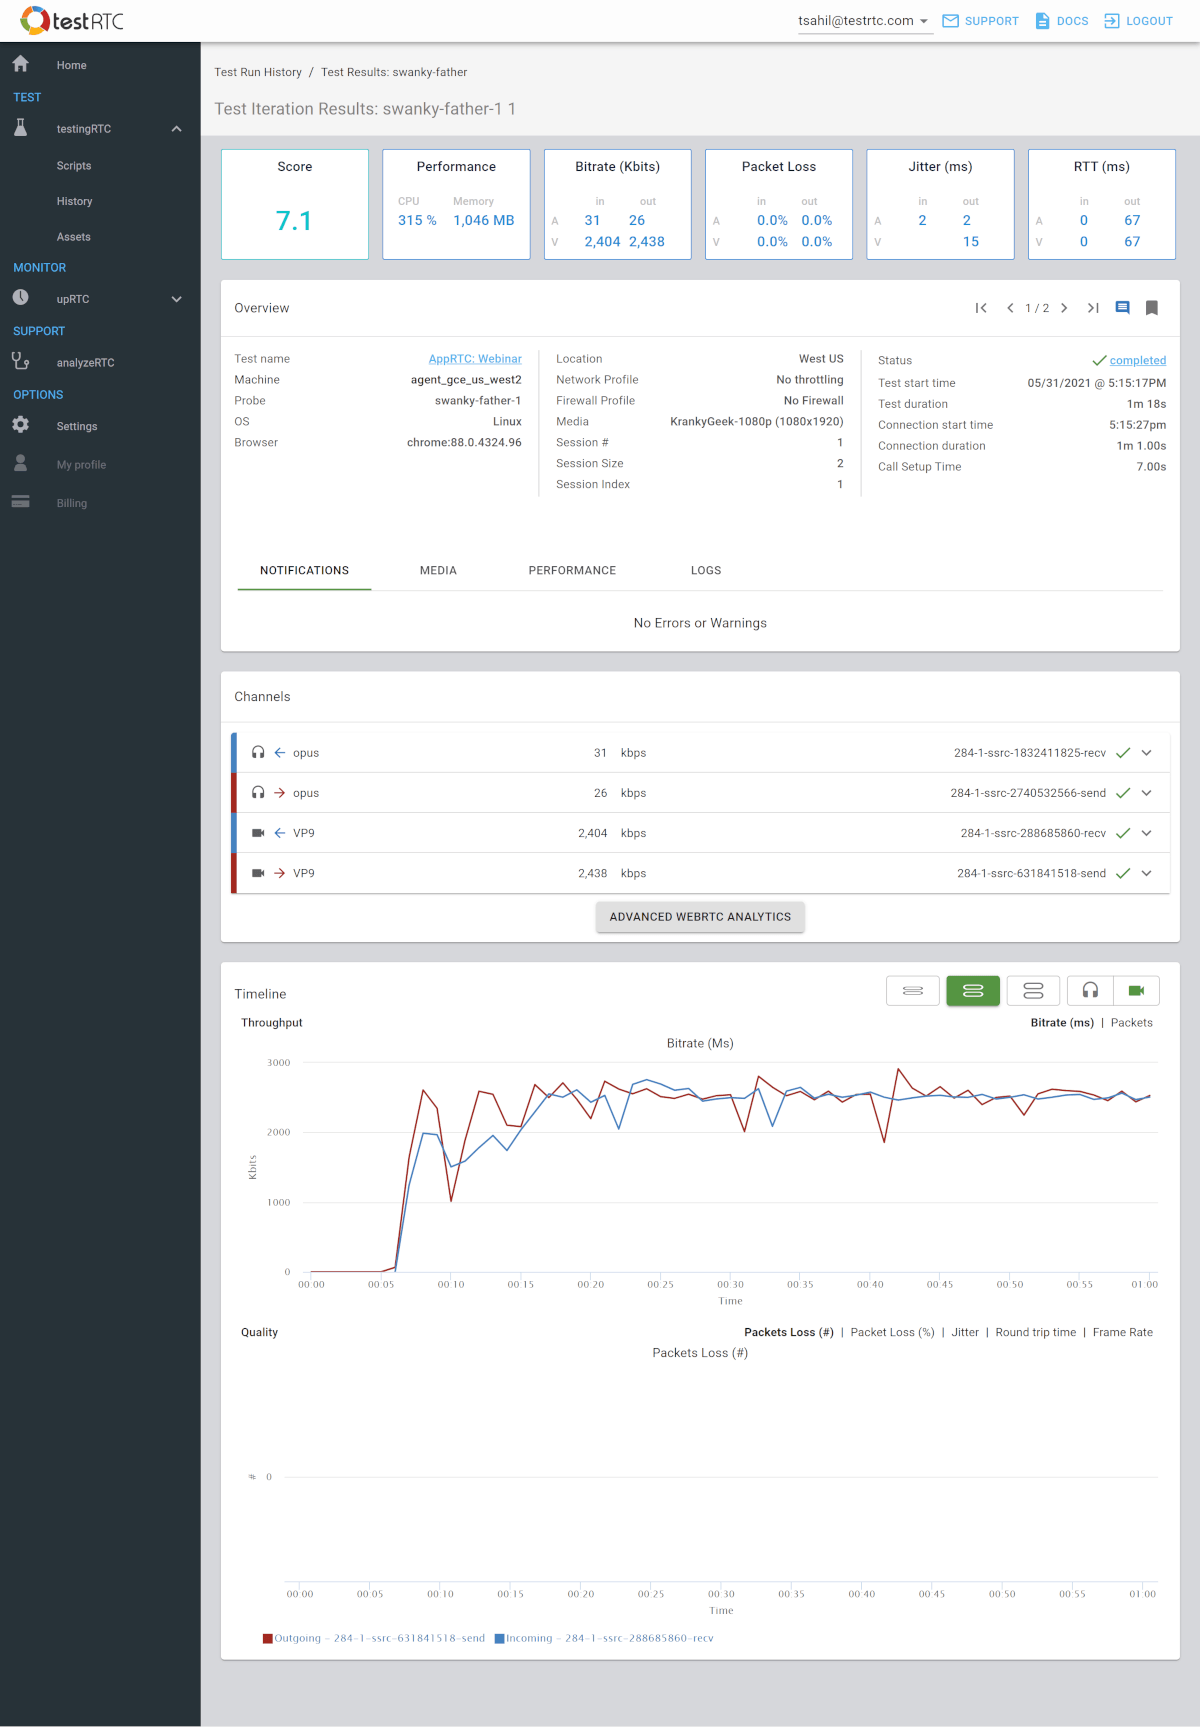
The Test Iteration Results page presents a single session results page (single session is defined as a single machine that executes a single iteration). This page offers rich and extensive set of graphs and KPIs (Key Performance Indicators) about the session’s streams. In addition, this page enables deep understanding of your application behavior and can help you debug it.
The Test Iteration Results page is composed of the following sections:
Session Summary Dashboard

The Session Summary Dashboard presents the following session’s main quality measurements:
- Score – the score calculated for this probe in the test. You can learn more about our WebRTC scoring algorithm
- Performance – the probe machine performance. This can give you an indication about CPU and memory utilization of your web application
- Bitrate – average bitrate in the test, split to voice and video, incoming and outgoing
- Packet Loss – average packet loss in the test, split to voice and video, incoming and outgoing
- Jitter – average jitter in the test, split to voice and video, incoming and outgoing. Note that incoming video jitter isn’t reported since Chrome doesn’t report it
- RTT – average round trip time in the test, split to voice and video. Note that usually you will have only the outgoing information available (that’s where calculation of RTT takes place)
Overview – Session Results Overview
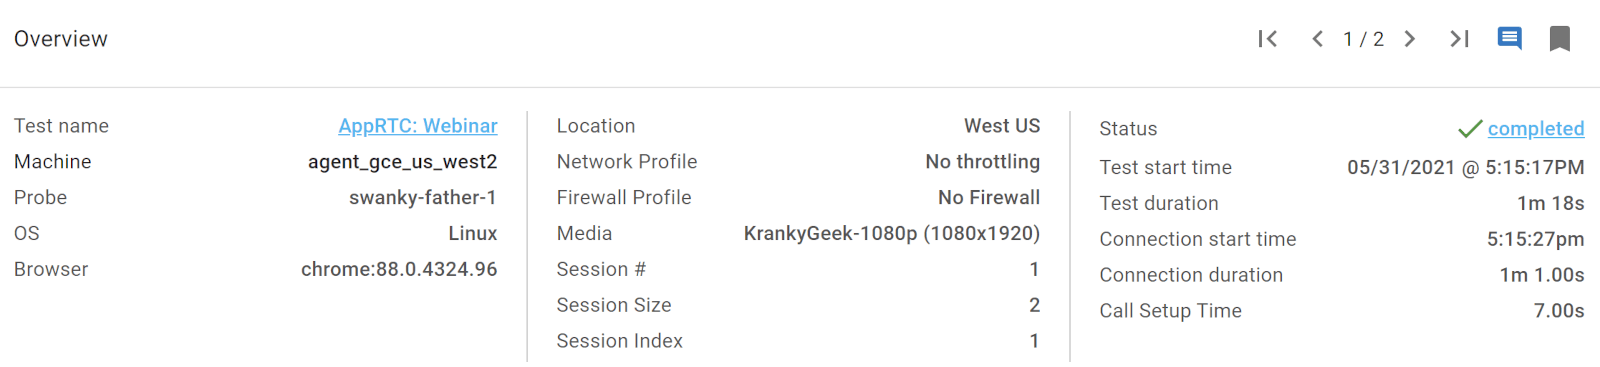
This section presents session’s basic information such as session start time, duration, probe location and browser version.
It presents also session’s custom metrics values, if defined. For further information about test custom metrics, please refer to Custom metrics commands.
The Session Results Overview section presents additional information in the following tabs:
- Notifications – list of errors and warnings encountered during the session execution. These errors and warnings are collected from the channels’ collected statistics, the browser’s console logs and Nightwatch logs.
- Media – includes the screenshots that were taken during the session execution and other media files if collected (such as a failure screenshot taken automatically whenever possible)
- Performance – collected performance graphs of the machine running the probe. These include CPU, memory and network metrics
- Logs – includes the browser’s console log, WebRTC internals dump, statistics, the script executed and other files if collected.
Channels – Channels’ details
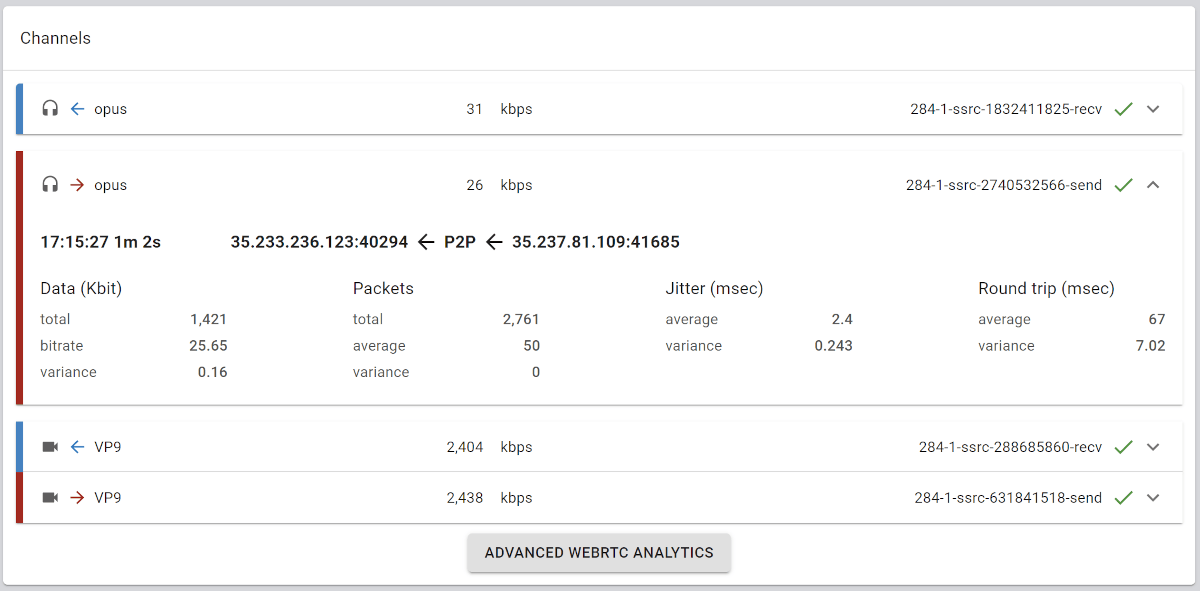
The channels details section includes all audio and video channels used in the WebRTC session. For every session, a session header will be presented with the following details:
- Channel type – Audio or video
- Channel direction – In or Out
- Codec used
- Average bitrate
- Channel ID
- Status – Successful, Warnings or Failed channel
By clicking on the channel’s header, the channel details section will be opened / closed. The channel details section includes bandwidth, packets, jitter and round trip detailed information.
At the end of the channels section, you can click the Advanced WebRTC Analytics button to get even further drill down details of the session.
Timeline – Audio and Video charts

The audio and video charts provide detailed QoS information about all WebRTC channels in the session.
In the audio and video charts, the charts’ start time is the time when the first WebRTC channel was created.
In these powerful timeline view you can:
- Switch between voice and video
- Compare bitrate/packets versus packet loss, jitter, round trip time and frame rate graphs
- Filter out incoming and outgoing channels as you see fit
- Zoom in to smaller time frames
- Increase and decrease height of the graphs