After a test is ended, the test results page is automatically loaded. It is also possible to reach this page by clicking on the ‘Test Run History’ menu item at the left side menu bar.
The test results page is composed of the following sections:
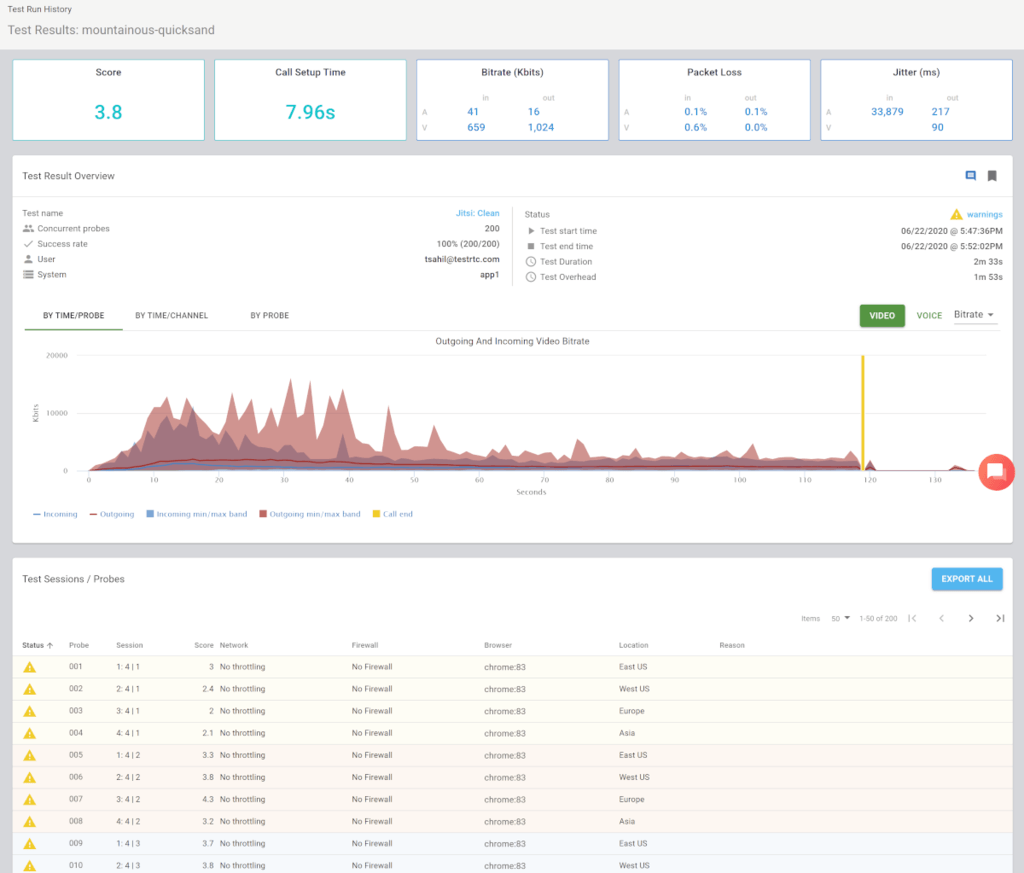
Test Results Page Sections
Results Ribbon

The Results Ribbon presents the test’s main quality measurements, providing a snapshot view of them:
- Score – the average score given for the media quality across all probes in the test run. For further information, check our test scoring system
- Call Setup Time – the average (for all sessions in the test) time in seconds it takes for each WebRTC channel in the session to exceed 50% of the channel’s average bit-rate. For further information, refer to Understand the test result’s ‘call setup time’ value
- Bitrate (Kbits) – the average (of all sessions in the test) effective bitrate, split between voice and video as well as incoming and outgoing directions
- Packet Loss – the average (of all sessions in the test) packet loss percentage, split between voice and video as well as incoming and outgoing directions
- Jitter (ms) – the average (of all sessions in the test) jitter, split between voice and video as well as incoming and outgoing directions
These metrics can give you an immediate high level understanding of the media metrics of a test result.
Test Result Overview
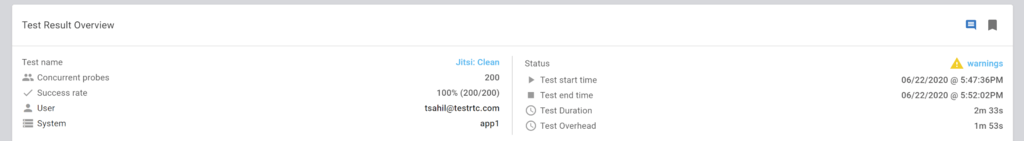
This section presents test’s basic information such as test start time, duration and total incoming and outgoing data.
You can mark and comment this test results by using the icons at the top right corner of this section.
This section presents also a test’s custom metrics, if defined. For further information about test custom metrics, please refer to Custom metrics commands.
Aggregation Charts
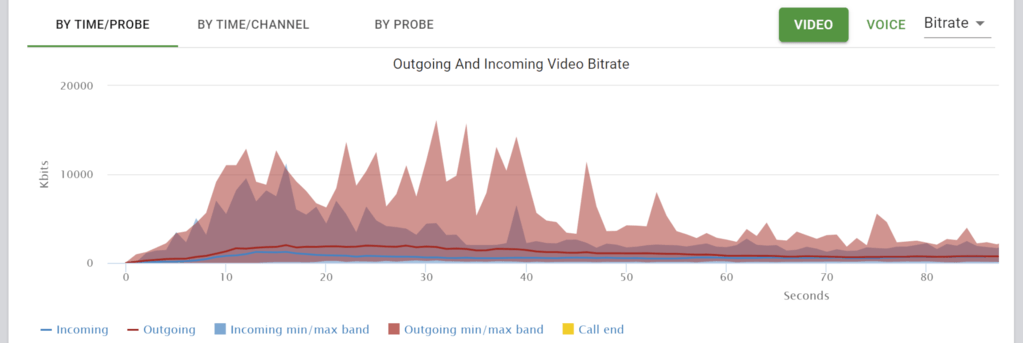
The aggregation charts offer a powerful analysis tool that enables you to quickly figure out the results in a test run, especially in bigger tests.
The tabs at the top offers different views towards the data:
- BY TIME/PROBE – the graphs here calculate the average metric values for the media by first summing the channel metrics on the probe level and then averaging them across all the probes in the test over the test’s duration
- BY TIME/CHANNEL – the graphs here calculate the average metric values for the media by averaging the channel metrics on the probe level and then averaging them across all the probes in the test over the test’s duration
- BY PROBE – the graphs here show the average metric values calculated for each probe separately over time, showing the results in a bars graph where each bar denotes a specific probe in the test
In each view, you can use the VIDEO and VOICE buttons to toggle between metrics related to video and voice channels.
The dropdown gives you the ability to select the metric to view – Bitrate, Jitter, Packets loss and Packets.
The legend below the table enables you to toggle on and off the various metrics displayed:
- Incoming and Outgoing represent the metric values for the incoming and outgoing channels
- min/max band shows the range of values that were found at that given point in time. This can be used to understand the variance across the probes in the test, hinting instabilities in performance of media servers
- Call end shows up as a vertical line that indicates when the first probe ended and left the test
- Any global events will appear on this graph as well
The video below explains how you can use these charts when analyzing your test results:
Test Sessions / Probes
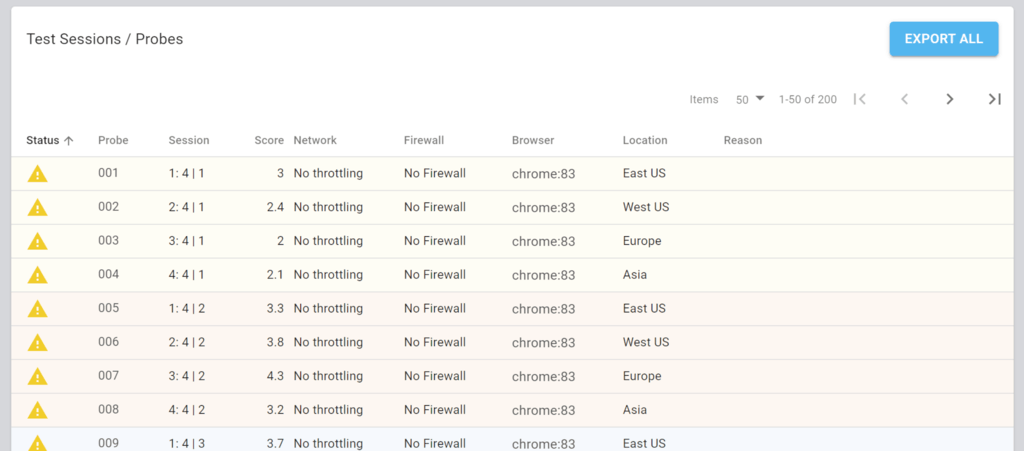
The ‘Test Sessions / Probes’ table lists the probes used in the test.
Each line in this table represents a probe in the test. If there is a large number of probes used, they will be paginated for easy browsing.
For each probe, you will be able to see its configuration as well as the media score that was calculated to it, along with the status of the test results for that probe. The background colors denote different sessions/rooms in the test.
Clicking a row on this table will drill down and open the results for that probe in the test.
You can use the EXPORT button to export the metrics information of the probes in the test as a .csv file.