New product!
We are launching a new product in a private beta called probeRTC.
It allows checking the network conditions from any location on any browser towards your infrastructure on a continuous basis.
Scroll down to learn more about this product.
Testing & Monitoring
Browser support
- Video frame rate graphs and expectation command now are now properly supported in Firefox
VNC
- VNC is disabled by default for monitoring. The VNC server takes up ports and resources, so we simply don’t run it where we don’t have to. If you need it for debugging a specific session, you can now use #force-vnc run option
qualityRTC: Network Testing
- We now support email and reason fields in URLs
- The intent is to pre populate the email and reason fields if you are linking to this from an authorized user, so that you don’t need to ask him for these fields again
- You can pre populate only the email or the reason if you’d like
- More information in our knowledge base
- New BI/Analytics dashboard for the Basic and Enterprise tiers
- Edit in the backend dashboard the email and reason fields
- Sort by multiple fields, including actual results
- Group by any fields
- Filter data based on any of the fields in the dashboard
- See this new dashboard in action in the YouTube video below
probeRTC: Zero install network probes
qualityRTC enables you to check network conditions in a given location. You run it once, collect the information within a minute. And… that’s about it.
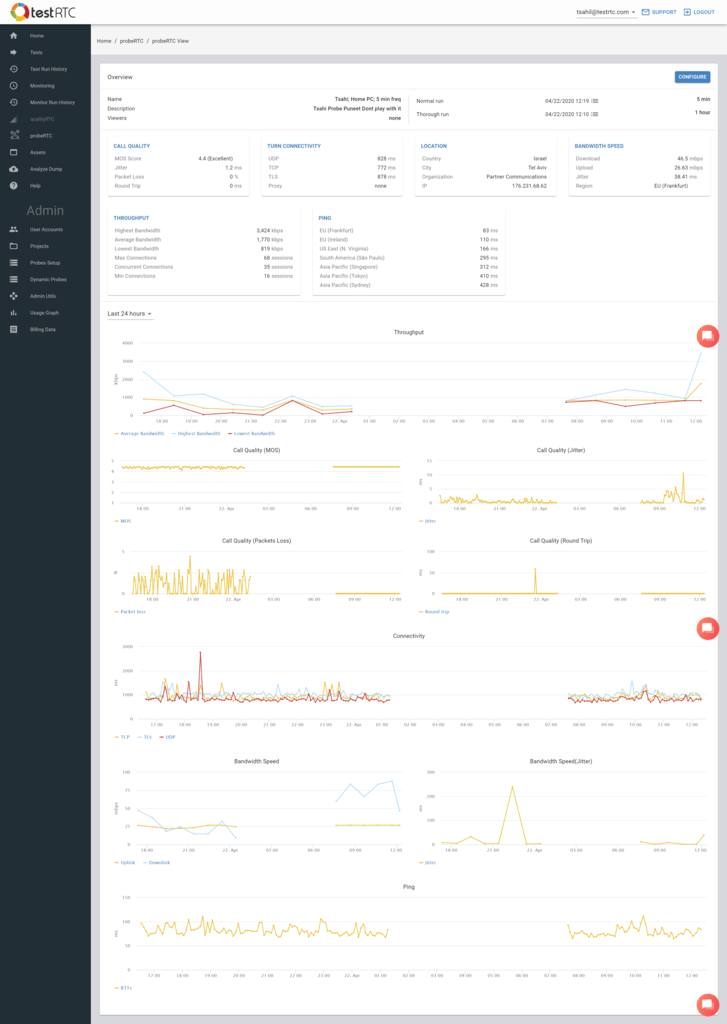
probeRTC does the same, but continuously over time. You create a special URL for your probe. You then give that URL to your client to run it in a location he wants monitored over time. Once opened on a device, it will continuously check the network, and you’ll get a great dashboard in the backend with all of the data.
Here’s how it looks like on my home network (I put my machine on sleep during the nights):