New Product: watchRTC in Private Beta
We have now added a new passive monitoring service, which collects metrics and data from real users running your system.
Why use testRTC for this?
- Enjoy the same look and feel, as well as the level of depth and analysis we offer today in our testingRTC and upRTC product – but on your own users’ sessions
- Fast to load, simple to use. Just as you’d expect from our other services
For now, this product is in private beta. If you’d like to join the private beta, contact us.
Facelift
We’ve introduced a new dashboard recently, to better fit the growing number of product lines we now offer at testRTC.

The new dashboard makes the information more accessible and will show data only to the products you’ve licensed, reducing clutter.
We also introduced estimated test runs for qualityRTC and we plan on expanding it to other products soon.
Other than that, we added more breadcrumbs to make navigating back and forth easier.
Testing & Monitoring
Analysis
In recent months we’ve seen an increase in the size of tests our clients want to run. We are working hard these days in improving and beefing up our service:
- Large tests results load slightly faster, using less memory and CPU while doing so
- We are now calculating scores properly when some of the probes fail to connect or collect media results
As in previous releases, we’re making it easier to read and analyze the results:
- Probe results now indicate the session sizes, so you don’t need to browse back
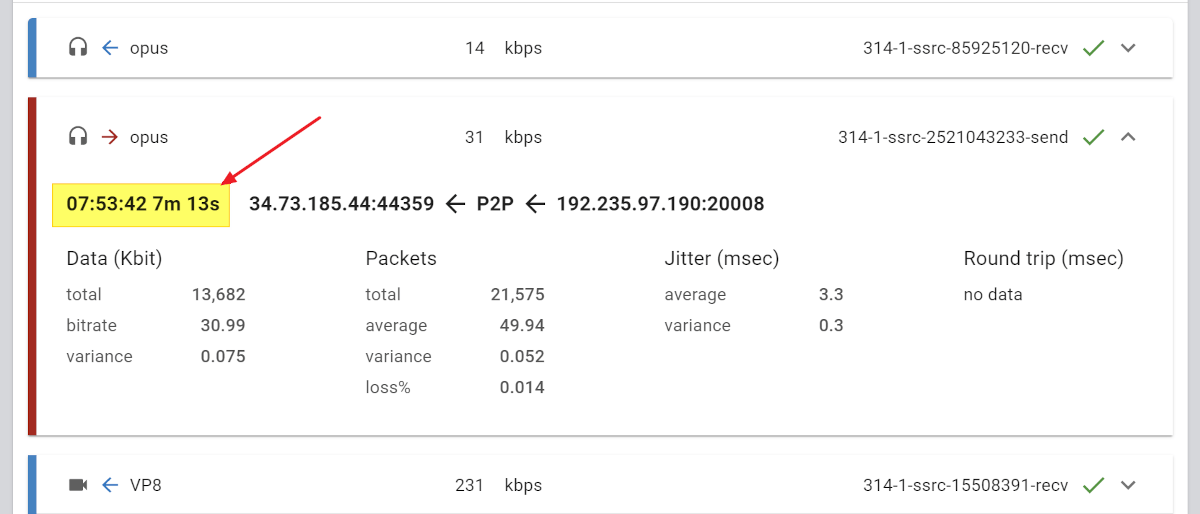
- Channels now show their start time and duration when you expand the channel details
Stress Testing
Large tests are different in nature. We’ve seen many clients using a growing number of probes in their tests recently, and we’ve added a few unique features towards these use cases:
- Best effort. Tests with more than 50 probes in them will run in a new best effort mode. This means that if not all probes were allocated at the beginning of the test (something that has a higher probability of happening the larger the test is), then the test will still execute with a lower number of probes. Learn more here
Testing
- .rtcCallWhenDone() is a new script command that enables you to create a function that will be called when testRTC wraps the test script – even if it fails prematurely
- .rtcCaptureCallData() now allows choosing the tab holding chrome://webrtc-internals. This is useful for restrictive services such as proctoring applications
- .rtcSetMetricFromThresholdTime() can now be used to calculate the time from a given event until metric values reach certain thresholds. This can be used for performance and bandwidth estimation purposes
- .rtcSetTestExpectation() – support for new metrics:
- We now support machine specific expectations such as CPU, memory and network data
- We now support more getstats metrics such as NACK and PLI counts
- A new environment variable RTC_SESSION_COUNT can be used to get the number of sessions allocated in a test
- Tests now collect machine performance metrics by default. You can use the run option #perf:false to disable this collection if needed
APIs
We’ve introduced more metrics out of test results so you can now collect and build your own dashboards:
- /testruns/{testId}/?detailed=true now retrieves more metrics data out of a test run
- /testagents/{testAgentId}/files was added. Now you can download the collected test data such as browser log and webrtc-internals dump file
- APIs got polished a bit, some were added a few additional fields
qualityRTC and probeRTC
We’ve got the release notes for these products separately this time, published earlier.