Testing & Monitoring
Scripts editor
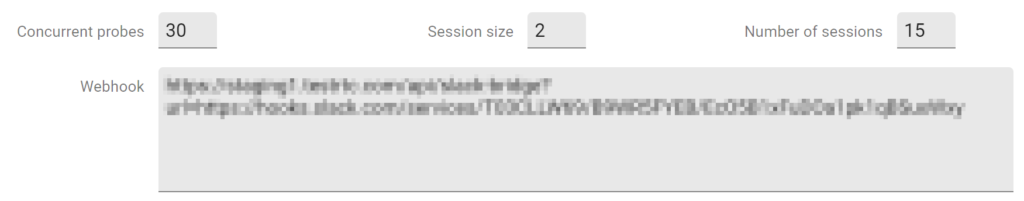
- #session has been taken out of the run options
- It is now available as a distinct field in the script editor
- The number of sessions field has also been added and is calculated automatically
- The old notation isn’t spported anymore
- #webhook has been taken out of the run options
- It is now available as a distinct field in the script editor
- This makes supporting complex webhook compounds easier to write
- We now have the ability to add hosts to the /etc/hosts configuration of our probes
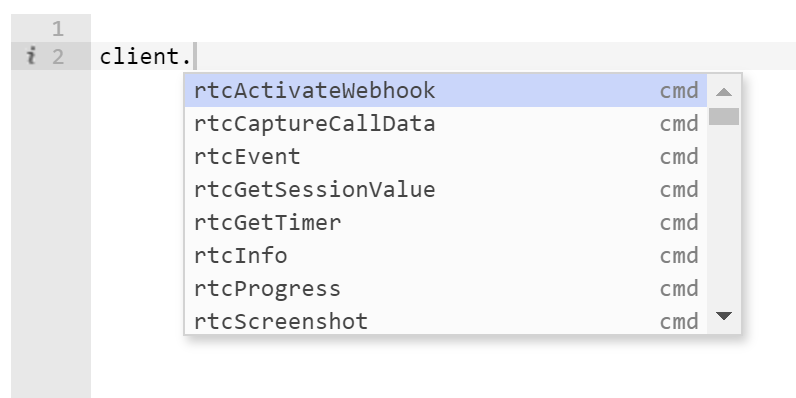
- Scripts editor now supports dropdown
- If you want to check what special commands are available, use Ctrl+Space after clicking “client.” to see a dropdown
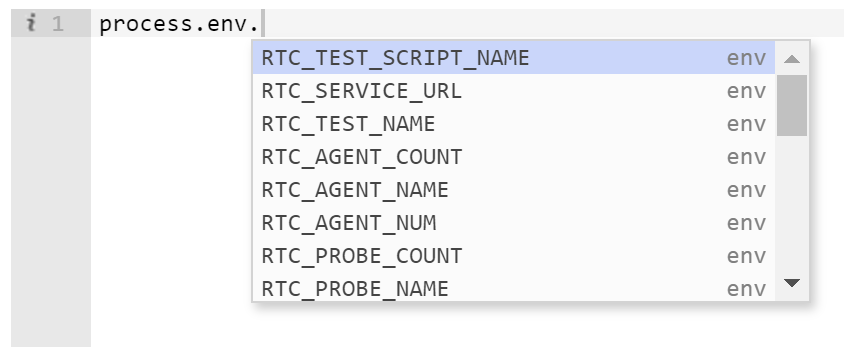
- If you want to check what special variables are available, use Ctrl+Space after clicking “process.env.” to see a dropdown
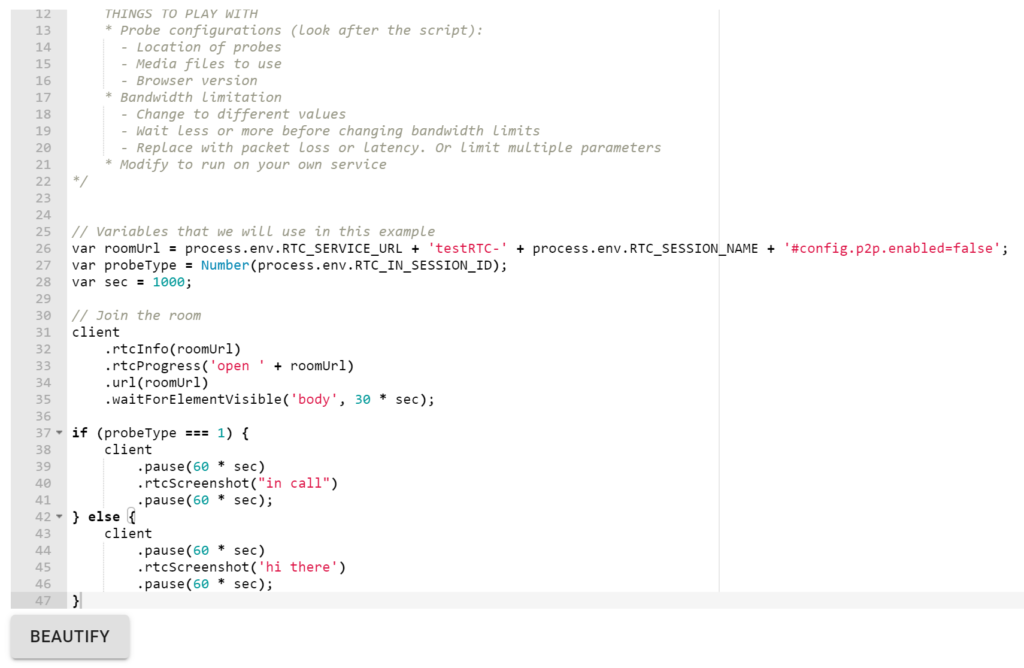
- There’s a new Beautify button at the button of the script editor
Script commands
- .rtcFail(): Calling .rtcFail() will cause the probe to fail at that point and stop running the script. You can indicate the reason as a text field in this command
- .rtcWarning(): Calling .rtcWarning() will cause a warning to be added for this probe in the test run with the reason you provide
- .rtcFailAll(): Calling .rtcFailAll() will cause the probe to fail at that point and notify all other probes running in the script to fail as well
- You can indicate the reason as a text field in this command
- Data and logs will not be collected from the other scripts
UI improvements
- We’ve redesigned the quick glance bar at the top of test results. It is now cleaner with more information such as split statistics between audio and video

- We are now using the spec-compliant getstats instead of legacy ones. This gives us access to more metrics. It also caused us to clean and refine our UI at the same time
- Your old tests will look and feel the same. New tests will look and feel somewhat differently
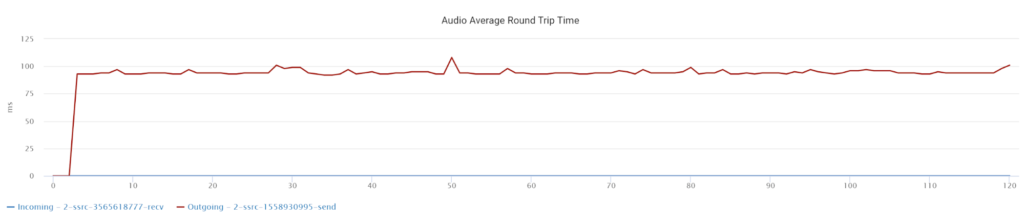
- Delay is now called Round Trip Time (which is what it really is)
- We’ve added an Audio Round Trip Time graph to the single probe results screen
- Jitter information collected
- We are now able to collect both incoming and outgoing jitter, something which wasn’t possible with the legacy stats
- That said, incoming video jitter doesn’t exist (a big in Chrome). Until that is resolved, for incoming video jitter, we expose the jitter buffer size instead (as we did in our previous releases)
- Analyze dump improvements
- Uploading a webrtc-internals dump file will now also show the Advanced WebRTC Analytics, giving users a lot more data
- We now also store and let you browser dump files you’ve uploaded in the past
Monitoring
- We’ve simplified monitor creation. You now don’t need to name a monitor or add description to it – just pick a test script you need
qualityRTC: Network Testing
- Call Quality Widget
- Separate widgets, supporting either G.711 or Opus over Twilio’s Programmable Voice (you can use both)
- Checks and shows the transport protocol used for the media (UDP, TCP or TLS)
- Verbose quality MOS score result, next to the MOS score number
- When microphone access isn’t allowed by the user, the widget now shows an appropriate warning message
- TURN Connectivity Widget
- Added a new proxy check to this widget. It will indicate if it detected that the web is being accessed via an HTTP proxy server
- New widget: Network Information
- Shows network information available directly by the browser
- Adds indication based on a new test created to see if the device is configured with an HTTP Proxy or not
- Test results link provided via the backend dashboard will now include the email and reason field filled in the page to add more context
- Knowledgebase articles
- We’ve written a knowledge base article per test widget (you can check them out here – click on the i icon on each widget)
- These are configurable and you can have them directed to your own knowledge base
- Responsive design – the test web page now looks better on mobile devices as well
- Verbose log now includes information about the browser and operating system running the test
API
- You can now use GET /tests/ to list all test scripts in your account. This is useful if you want to iterate them for nightly builds or similar tasks
- You can now access screenshots taken in a test using GET /testagents/{testAgentId}/screenshots
- You can now edit your assets using /assets/ APIs