Account Settings
We are starting to flesh out the user-facing account settings and profile settings. As such, you will see a new sidebar menu:

We are starting to build up the account configuration and user settings area of testRTC, starting with the testing and network testing products.
Here’s what you are now able to do through the settings screen:
- Update your API key
- Configure qualityRTC’s email delivery, webhook and password
- See who has access to the project
Webhooks
As we expand our user base and products portfolio, we get more and more requests for integrations. These include the need to provide webhook support.
We decided in this release to streamline and standardize the way we invoke webhooks and to offer richer formatting options. These now include templating, AWS SNS and CloudEvents among other options.
Check out our webhook formatting options.
Testing & Monitoring
Analysis
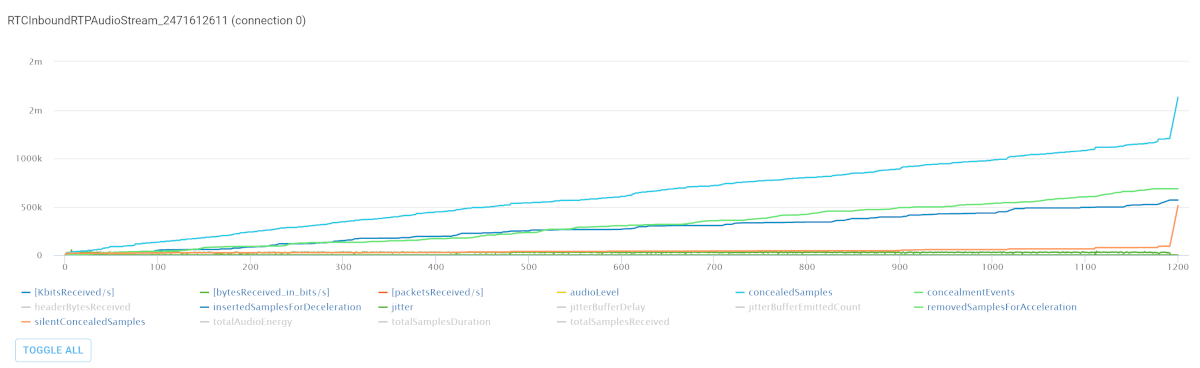
We’ve overhauled our graphs on the single probe results. The new view is a lot more powerful. Here’s a quick overview of what that means:
To make things even better, in the Advanced WebRTC Analytics, we’ve gone ahead and polished the interface as well:
- Static metrics that had no real use were removed
- Metrics we thought were less important are now disabled by default
- A toggle button was added to the legend, to make it easy to quickly select one or two metrics and display only them
Stress Testing
- We now ignore #har-file and #pcap run options on tests with more than 4 probes or longer than 10 minutes. These log files are heavy and affect performance, so we make sure to disable them on stress tests
- With large tests there’s a pagination mechanism to go through the probes. The pagination buttons are now placed at the bottom of the table as well as at the top
- We are deprecating #no-internals run option and replacing it with a #webrtc-internals run option:
- Not setting it will collect webrtc-internals for tests with a #timeout shorter than 30
- Setting it to true will always collect webrtc-internals
- Setting it to false will not collect webrtc-internals
- We’ve added the pagination bar for the probes list in test results to both the top and the bottom of the probes list. This makes it easier to navigate through them
Testing
- We now automatically allow using HTML5 Geolocation APIs in tests
- Exporting test results of a single test now provide more metrics
- Exporting test results of multiple tests from the History page now… works
- The API now includes an option to change the session size of a test when running it, making it easier to create programmable variations of tests
Monitoring
Monitoring ribbons have been rewritten to make them more useful.
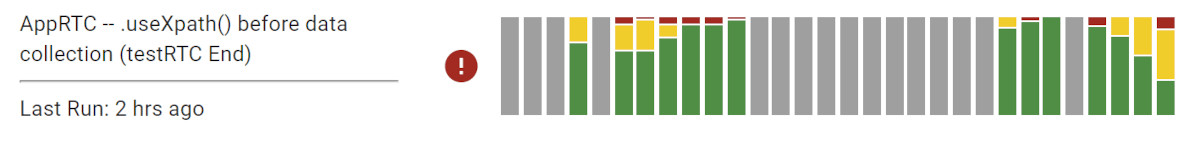
They now include information about the last 15 days, showing the distribution of daily monitor runs.
qualityRTC
We’ve got a new page on our website for qualityRTC! But I am guessing you’re here for the new capabilities of this product 😉
- When there are any issues found, the log button will show a red indication of that

- In the same spirit, when a specific test has issues found for it, it will list them next to its icon. Clicking the icon on the top left corner of each results widget will get you right to the relevant point in the log
- We’ve made camera and microphone access failures more verbose and explanatory, making them easier to figure out and troubleshoot
- We now collect and log the cores count of the machine running the test
- New silent test: GPS Location. We can now collect the GPS location of the user and place it in the log
- New silent test: Hardware availability. We can now try and figure out if hardware acceleration is used for video calls
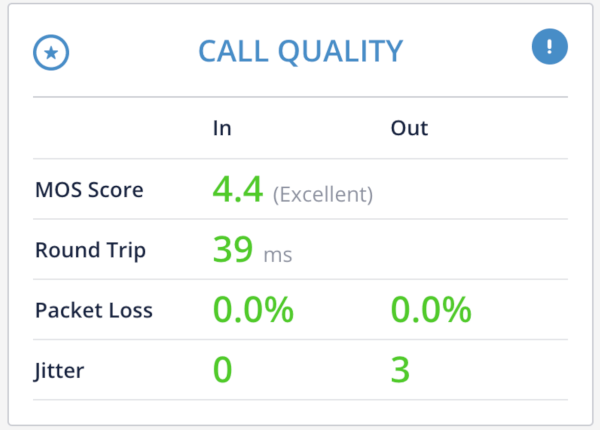
- Call Quality test
- The widget now writes to the log both incoming and outgoing metrics
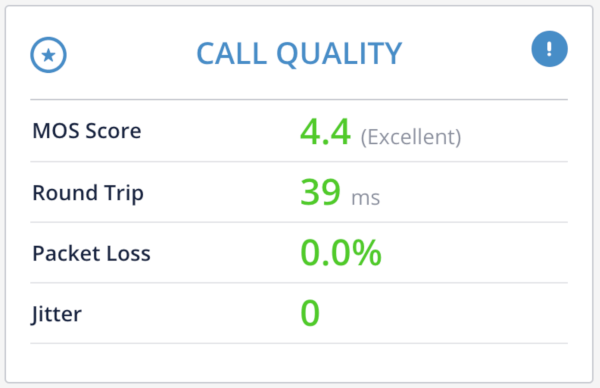
- Call Quality widget can now be configured to show one of 3 different layouts:
- Inbound only – this is the default view we had until today
- Combined – shows in a single column the highest value from inbound and outbound metrics for packet loss and jitter
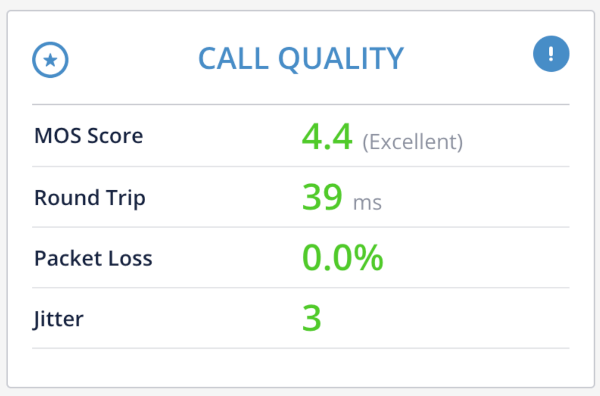
- Detailed – double column, splitting inbound and outbound
- Inbound only – this is the default view we had until today
- We now put in the log additional information such as the network type and IP+port pair of the connection
- Location widget
- Can now be configured to not display the “show on map” link
- IP insights add-on will also indicate cloud hosted machines
- Privacy
- Those with BI Analytics enabled can now delete test results
- We can now automatically scrape email and IP addresses from test results after a configurable number of days
- Entry fields in test can now be hidden if provided via URL parameters
- BI Analytics grid improvements
- We’ve made searching the table easier with a new global search option at the top of the grid
- We now shows video metrics as well if these are collected by your configuration
- Clients who have the account field configured can now edit its value in the backend dashboard
probeRTC
Installable service
- We can now offer probeRTC as an installable daemon application
- This works for Windows and Mac
Video graphs
- probeRTC is being adopted by more clients. Up until now, our focus has been call centers, but it seems other types of vendors are in need of this service as well – ones that also handle video calls
- This is why in this release, we’ve added graphs for the video tests that probeRTC can conduct
watchRTC
We are working on a new product for passive monitoring of your users’ WebRTC metrics.
This is still running in private beta with select clients. We are expanding the list of clients we work with on it on a weekly basis – reach out to us if you want to join the beta.