Dashboard & settings
We’ve continued to polish our dashboard:
- It was time to give the breadcrumbs some love and attention. We’ve normalized them across the dashboard pages and also pushed them to the header so you’ll have more room for the actual content
- We’ve changed the icons for our products, streamlining them as well. We think the new ones look better
- There are now new Settings menus for both upRTC and watchRTC, making it easier than ever to configure these products
testingRTC & upRTC
Analysis
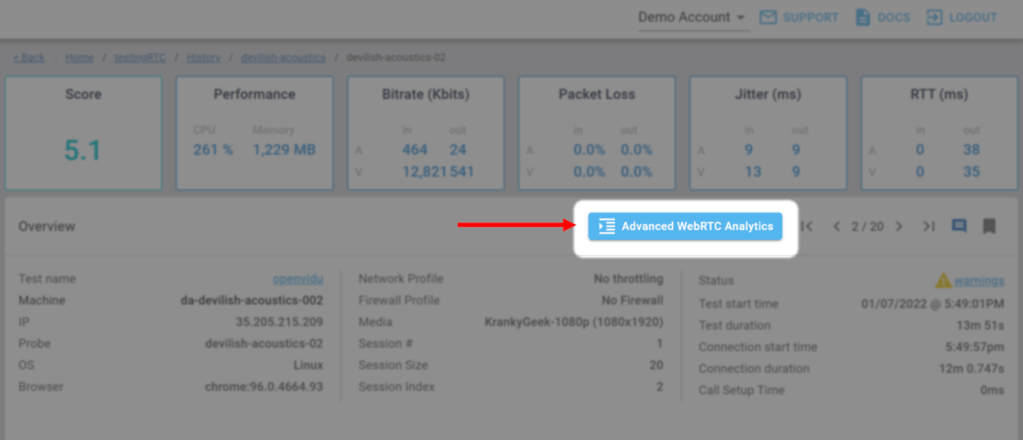
- We moved the Advanced WebRTC Analytics button to the Overview section at the top of the page
- Sizing buttons have been merged from 3 into a single button, making room for more controls
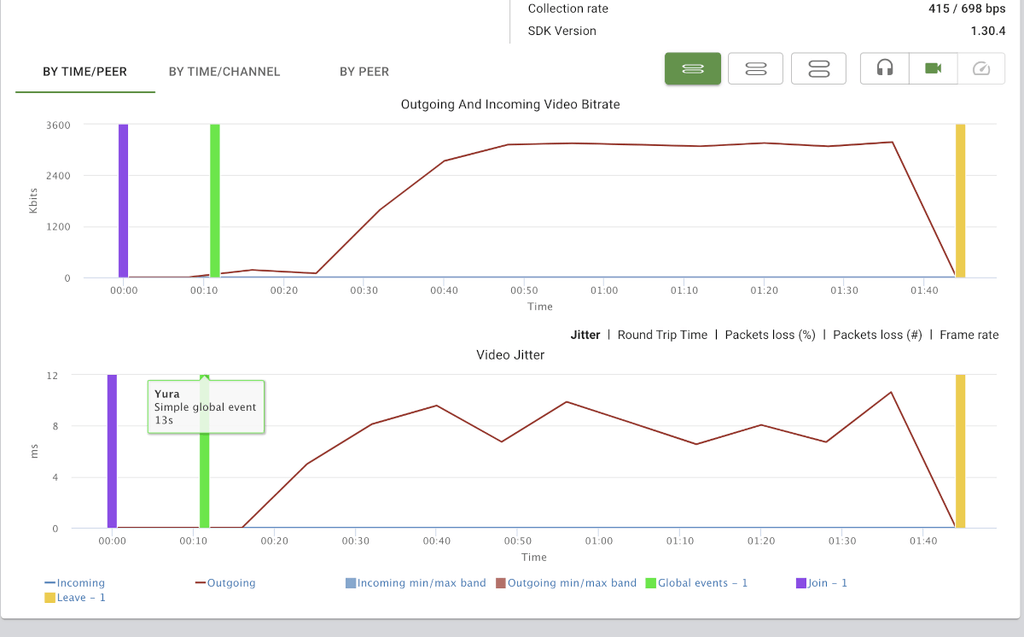
- Speaking of controls, we now have stacked bitrate graphs
- You might have noticed in the moving image above, we’ve also added some threshold values and ranges to some of the metrics in our graphs, making it easier than ever for you to focus on the areas affecting user experience and media quality
- We’ve added some tooltips to the charts we show – both aggregate as wella s the single probe/peer ones. The intent here is to make these charts simpler and more approachable to our first time users
- Call end indicator on high level charts now also show the exact probe that finished first and left the session
- Incoming video jitter is now a first class citizen in our analysis throughout testRTC. That’s after Chrome 94 finally reports it properly and we can rely on the results we see there
- There are times when there are just too many empty peer connections. These are used as placeholders, or for running different checks in application logic. We’re bumping into them more, so we decided to hide them in the Advanced WebRTC Analytics. They are still there if you’ll need them, but you won’t have to worry about seeing them too much
- You know how mediasoup generates these nagging 1234 SSRC channels? Well, we now catch these and… make them go away, so when you use mediasoup, our dashboards are clean, pristine and usable. You can still access these 1234 channels through the Advanced WebRTC Analytics if you need to
- Best effort mode was something we introduced this year. We now make it clear in the results that it was kicked in and how many probes were actually used
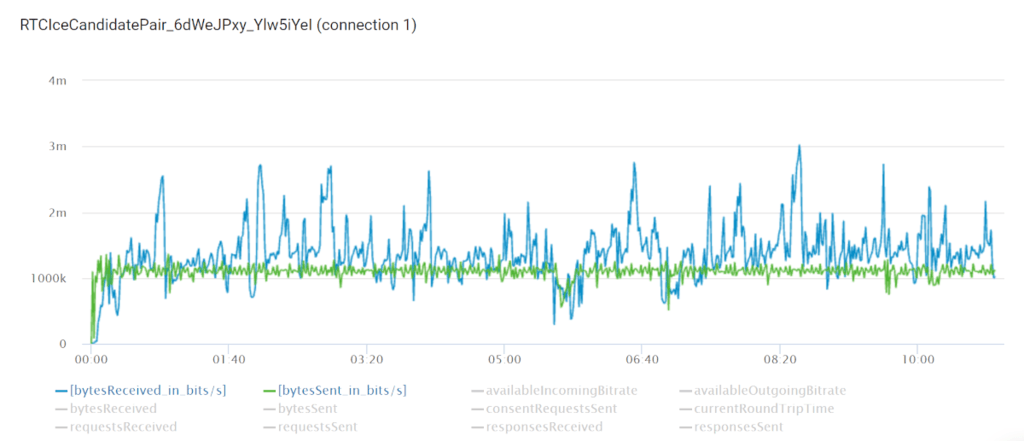
- Oh, and in Advanced WebRTC Analytics we now also show bytesSent (in bits/s) and bytesReceived (in bits/s) for ICE candidate pairs:
qualityRTC
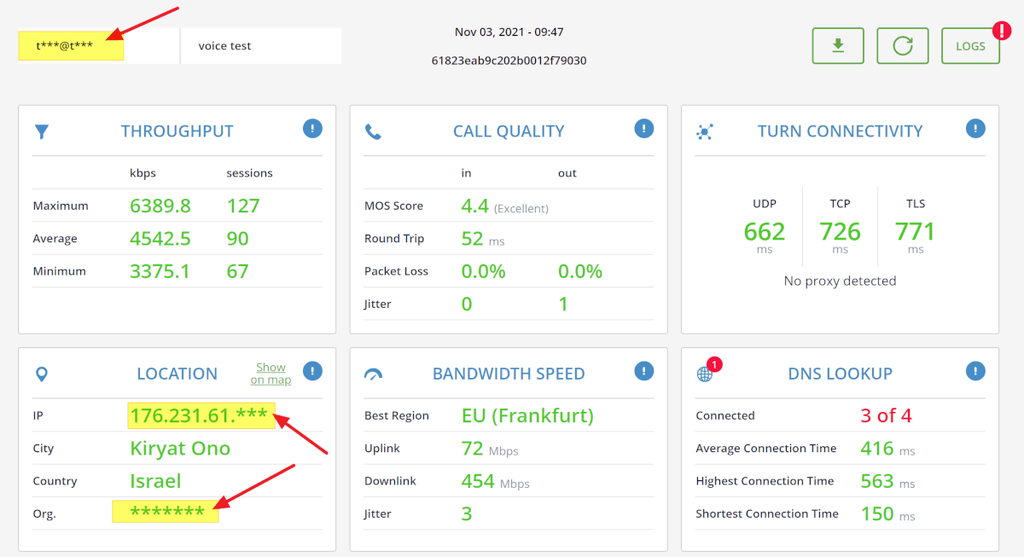
Improved PII
While qualityRTC collects very little data, we can now provide even more privacy.
Accounts can now be configured to redact identifiable information in the form of emails and IP addresses after a set amount of time.
Learn more about PII in qualityRTC
More integrations
We have added out of the box integrations for more platforms. We now also support AWS Chime SDK, Pexip, jsSIP and Licode.
You can find out the full list of existing integrations for qualityRTC here.
Standardizing proprietary integrations
As more and more integrations are created and worked on for our clients, we’ve decided to standardize the mechanism used to provide dynamic configurations in qualityRTC. This is done via a new REST API definition.
You can find out more about it here.
High availability
When you use your own speed testing machines, you can now install them in an active-active configuration, where the speed testing test will take place even when one of these machines are down.
watchRTC
Please update to the latest version of our SDK. This is important to enjoy some of the new features (and to help us weed out some nagging collection bugs).
Improved PII
While qualityRTC collects very little data, we can now provide even more privacy.
By default, we already “scrubbed” local IPv4 addresses. This has been extended to remote IP addresses and also to IPv6 variants.
Note that by default, watchRTC does not store any IP addresses – just redacted ones.
Custom notifications
UPDATE: In a later release, we’ve renamed custom notifications to custom alerts.
We are beefing up our data analysis and aggregated insights for watchRTC. The next step in this journey is the introduction of custom notifications. You can now decide what quality metric thresholds to use in watchRTC to indicate warnings or errors as notifications. These will then be automatically calculated across all sessions, highlighted and aggregated.
While at it, we’ve added two predefined notifications that you can filter in the History view – ICE failures and ICE restarts.
Learn more about custom notifications in watchRTC.
Custom events
You can now indicate your own events to watchRTC via the SDK’s watchRTC.addEvent() function. When doing so, you’ll need to name the event and pick a type for it – events can appear only on the event log, show up on the peer’s graphs or also show up on the room level graphs. All depending on what it is you want to convey.
This is good for indicating mute/unmute events, screen sharing or any other application logic that is important for you to track.
Stream mapping
You know how mind boggling it is to convert the SSRC information into who sent what when looking at large group calls?
Well, you can now just let watchRTC know what are the names of the incoming streams and it will handle all that nagging part for you.
To use it, use the new watchRTC.mapStream() API in our SDK.
Live
watchRC live which debuted in our last release is great. So great that we had clients complain already that they want it to work also on peers that left the room while the room is still running.
So now they can 😎
On top of that, we now show the location of the peers when you look at the Live table.
Analysis
- Some browsers don’t support parameterless setLocalDescription() calls yet, but since this is something we’ve seen developers use, we had to make sure to support it as well, so now we do
- IPv6 is now better supported. We display it properly and resolve location information based on it when possible
- We now collect icecandidateerror and share that in the events log
- Talking about collecting events, we also collect RTCRtpSender.setParameters() – Jitsi users of our service said this one is really handy for them
Here and there
- You can now configure your API key for watchRTC and regenerate it on your own. Just go to Settings | watchRTC for that
- Custom keys can now have multiple values (if that’s what you need). More on that in our explanation on custom keys
- Also, custom keys now show a lot nicer in the results and can be copied easily via the icon next to them. This is especially useful when their values are used as identifiers in other systems
- We’ve added a new POST /watchrtc/highlights REST API. This enables you to pull out the aggregate highlights for the data collected by watchRTC
- In the highlights dashboard we now show call setup time in milliseconds instead of seconds