Settings
We are introducing roles and permissions to testRTC 🎉
As a first step, you are now able to invite users to your account.
There are now two types of users: Account Admin and Developer. The only difference between them is that an Account Admin can invite users or remove users from the account.
All existing users have been configured to the role of Account Admin.
You will find this new capability under the Settings | Account users section.
Dashboard
We are continuing on improving the visual design of our service. This is needed in order to support the growing number of products and services we now have on offer, as well as to improve the efficiency of your workflow when you use testRTC.
Two things we did this time here:
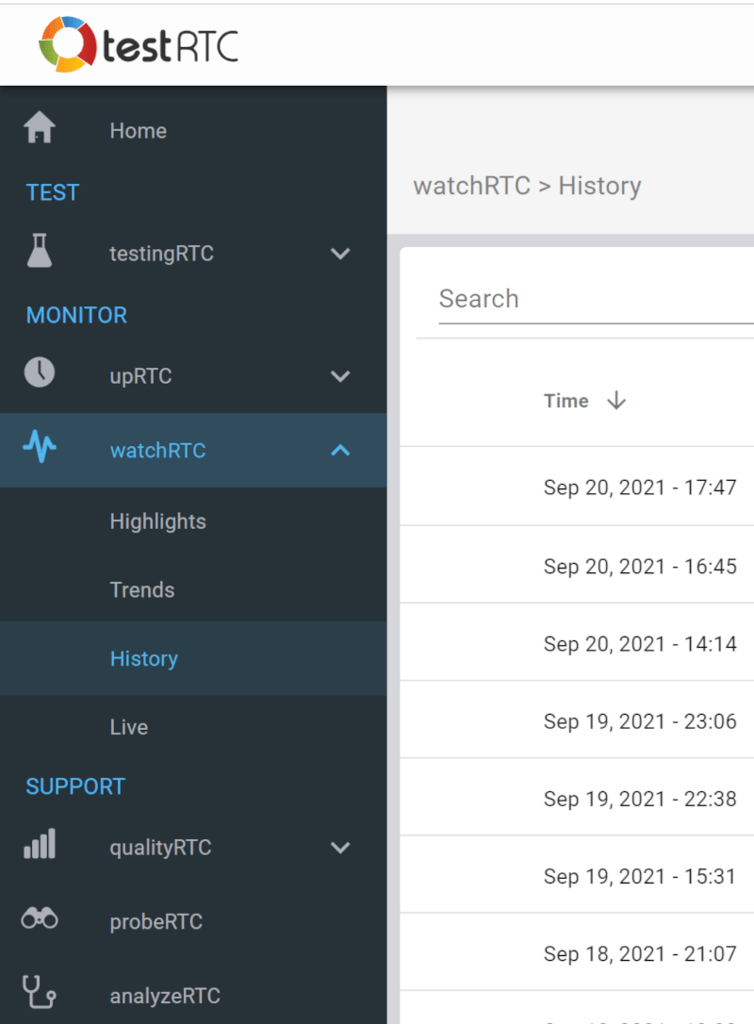
1. Sidebar highlights
What we did this time was add some colors on the sidebar, so that you’ll have a better indication of where you are in our service.
2. Condensed mode
Many of our tables can now be switched to a condensed mode, so that you get more space for the data you want to see:
testingRTC & upRTC
Analysis
We now show CPU and memory information on the high level charts:
You get average, min and max CPU and memory use over the whole test run period AND per probe average, min and max values for CPU and memory. All that without needing to drill down to the single probe pages.
By the way, to make this happen, we also aligned the performance graphs with all the WebRTC metrics graphs so they now all share the same timeline, making it easier to analyze the results.
Oh – and while we’re still on the topic of the high level charts, they now include not only packet loss and jitter but also round trip time and frame rate.
Test Scripting
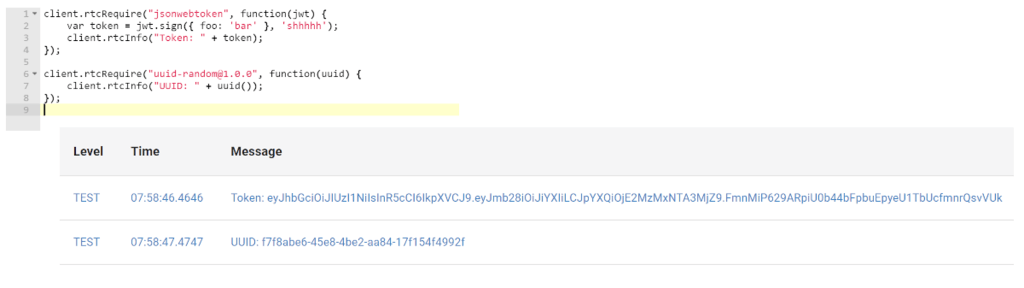
- We’ve introduced rtcRequire() – you can now make use of any npm package in your test script.
- Say goodbye to webrtc-internals
- It took us time but we got there. We now heavily rely on other means to collect what we need from the running browsers. This has a lot of benefits compared to webrtc-internals
- By default, we now won’t be opening or collecting webrtc-internals at all
- You can re-enable it by adding #webrtc-internals:true to the run options
- We’ve added support for complex expectations – you can now add and or or into your expectation statement when using rtcSetTestExpectation(). This can come in handy when you’d like to check if frames per second on video channels is above a certain value only if there’s any bitrate on these channels
- When collecting pcap files, tests tended to fail due to the size of the files collected. We’ve now limited all packets collected to 100 bytes length (we truncate them). You can change that to a different value by using #pcap-file:X run option
- CPU and memory information are now available on the probe level via our API. See GET testagents/{testAgentId}
qualityRTC
We’ve introduced a new URL parameter called context. You can use it to pass context information to the test and be able to view it in the log or collect it back on the webhook.
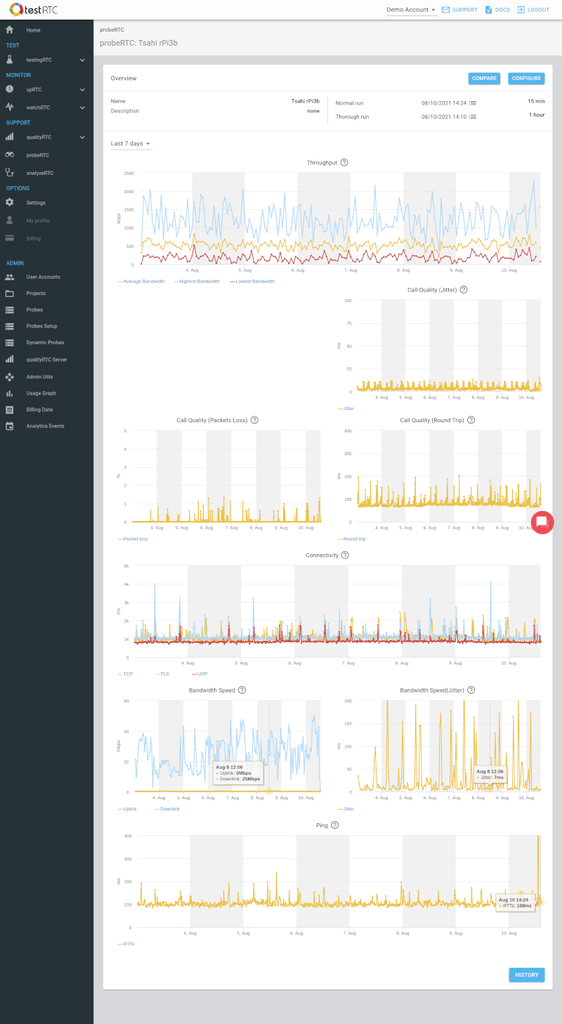
probeRTC
30 days view now has a striped gray-white background to the graphs to be able to see weekly delineation.
watchRTC
Please update to the latest version of our SDK. This is important to enjoy some of the new features (and to help us weed out some nagging collection bugs).
Live

Real time. We all want that.
A user complains. He is on a session. Just there. Sitting. Live. All alone. In the dark. With a problem.
What do you do for him? Ask him to open webrtc-internals? Hell no!
You just go to our brand new watchRTC Live – and dig into whatever’s wrong.
How. Cool. Is. That??? 😎
This is a new add-on feature we just introduced to watchRTC for our enterprise plans. Contact us if you want it enabled on your account as well.
Custom Keys
Goodbye tags hello custom keys!
We’ve thought tags would work. But they didn’t. So we switched to custom keys.
Here’s how this works:
- You talk to us and choose the keys you want supported
- For each, you can decide if it is for searching only or for aggregating results as well
- You tell us about it, add it via the SDK or REST APIs to your sessions
- And you’re good to go
This enables you to use metadata that fits with your own application and not only with things we thought you might want to use.
You can read more about custom keys.
Trends
We’ve revamped the operating systems and browsers graphs
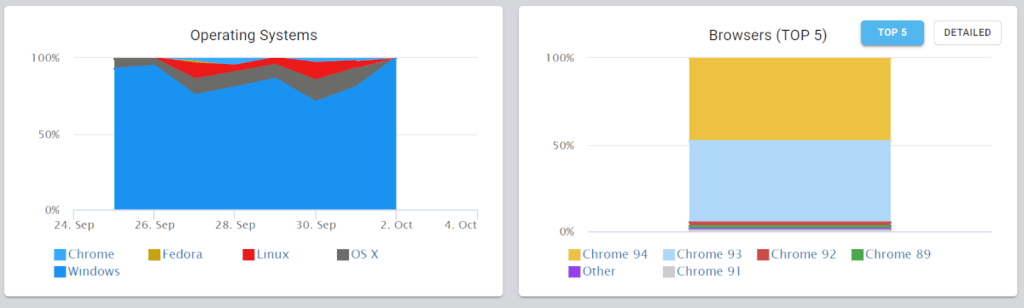
- In operating systems, we now bundle up the various versions of each operating system to make this view manageable
- For browsers, we now show by default a “top 5” view of the main browsers used, and have the optional detailed view there as well
Analysis
- A/V devices used in a session now appear on the peer’s overview section so you don’t have to dig into the Advanced WebRTC Analytics pages for that
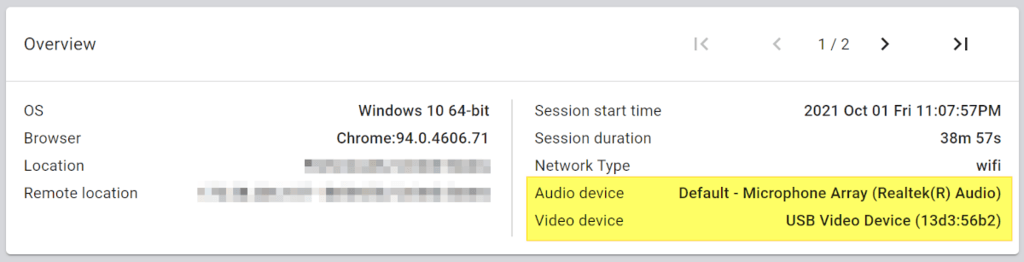
- Remote location has been added to the Overview as well, letting you know which server (or peer) this user is connected to
- New machine information section in drill down
- This will give you more insights to the machine your user is using
- For the time being, the information there includes the user agent for the browser and the machine performance information we were able to collect
