High level charts of test runs include a yellow Call end vertical line in them. Here’s what it does and what you can use it for.
What is Call end?
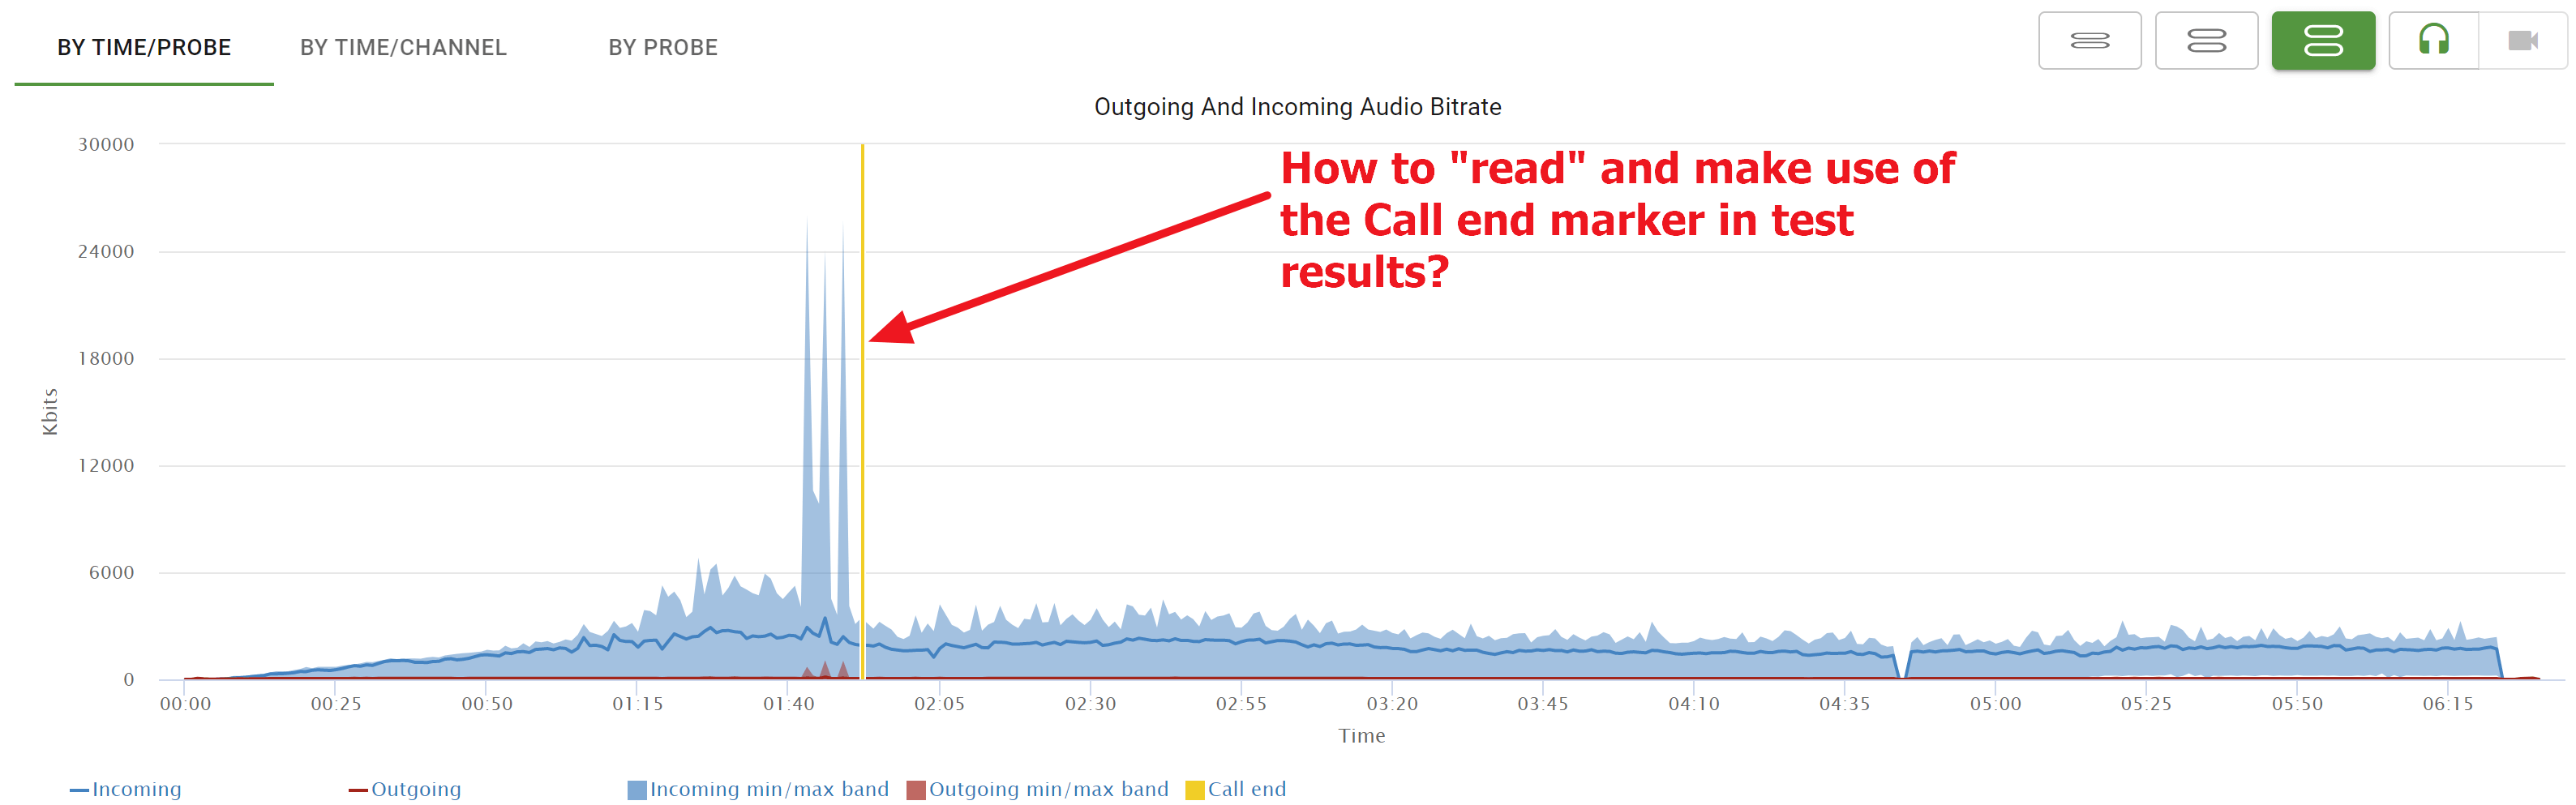
The Call end vertical line indicates the time in the test when one of the probes had its WebRTC peer connection closed.
In a stress test, your usual expectation would be to see the Call end indicator close(r) to the end of the test – since you’ll probably be ramping up the number of probes joining the session and then near the end of the test you might want to shut them down gracefully.
If the Call end line appears sooner than expected, then there might be an issue.
How can you use it?
Here is a short analysis of a session we recently looked at:
Key points to remember here:
- Call end happens too soon in the test
- We can see incoming bitrate and jitter growing “out of line” just before that point in time. Probably due to a resources issue 👉 it might make sense to also check memory and CPU use on the probe side to see if you need to optimize your JS code
- To figure out which probe ended the call, you can export the results to CSV
- Focus there on Connection duration column and sort it
- You can also try to plot it on a line chart
- This will give you the probes you need to focus on to figure out what’s wrong