You can setup your own custom alerts in watchRTC. This enables you to identify and troubleshoot connectivity and media quality issues faster.
Table of contents
What are custom alerts?
watchRTC has a mechanism called alerts. With this mechanism, whenever a session completes and its collected data gets analyzed, watchRTC will review it against its own internal logic as well as thresholds you configure manually.
These thresholds are called custom alerts. They are rules related to media metrics in WebRTC, where you can define for example that a packet loss above 4% in incoming video channels should be considered as an issue to review later – either setting it up as a warning or an error.
watchRTC checks these custom rules and marks the peers and the rooms with the relevant warning and error messages.
You can setup custom alerts on the following metrics:
- Call score
- Call setup time
- Audio/video incoming/outgoing bitrate
- Audio/video incoming/outgoing packet loss
- Audio/video incoming/outgoing jitter
- Audio/video round trip time
Alerts can be configured as errors or warnings. watchRTC makes no distinction of its own between the two – they are given as a means of providing different alert levels for your own monitoring logic.
Predefined alerts
watchRTC has its own predefined alerts. These will be automatically analyzed and available to you as well. They are focused around connectivity of sessions – mainly ICE failures and ICE restarts. You can filter these in the History view to understand such failure reasons.
Setting up custom alerts
To setup custom alerts, go to Settings | watchRTC and scroll down to the Alerts section at the bottom.
There, you can create or edit custom alerts for your account:
- Pick the metric you want to be notified about
- Decide on the operator to use (Greater, Lower, Equal)
- Pick the threshold for the metric
- Choose the type of alert – warning or error
- Give a verbose message for the alert
- And activate the alert
Once activated, all new sessions conducted and collected by watchRTC will start showing the alerts if needed. Older sessions will remain unaffected.
Reviewing alert highlights
At the bottom of the watchRTC | Highlights page you will find the Alerts table.
This table will display how many sessions and peers were found with each of the alerts configured. The actual timeframe and filter used for these numbers are based on how you filter this page.
Clicking a specific alert in this table will take you to the watchRTC | History page with the same filter with the details of the alerts. Note that you will only see in the history view the data available from the retention period of your account.
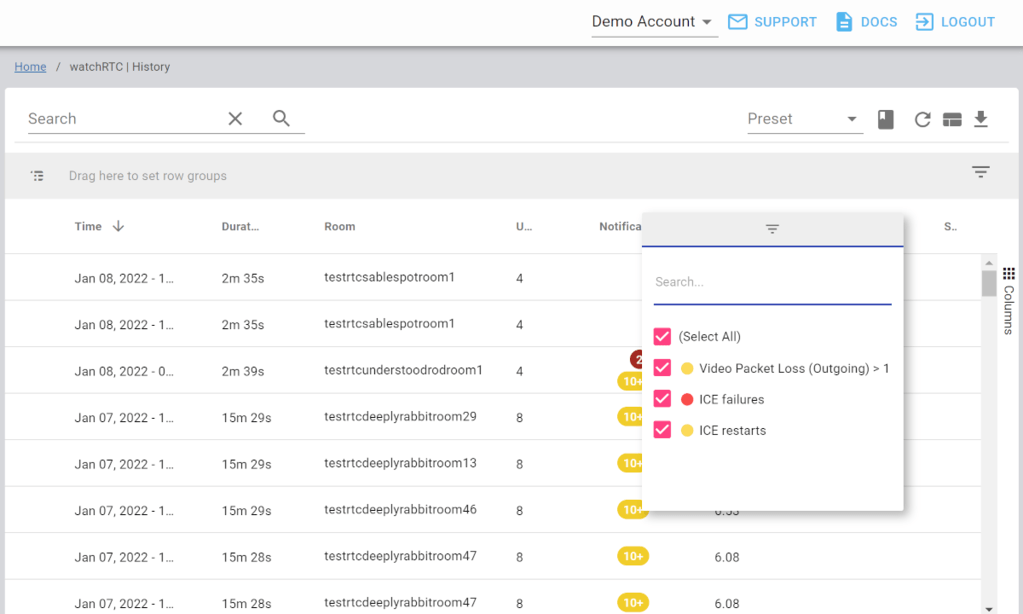
History filtering for alerts
When you look at the watchRTC | History page, where all sessions are detailed, there is a Alerts column. You can use it to filter out and review rooms that had specific aletrs on that. These alerts will include the automatic alerts available on watchRTC as well as the custom alerts you configure.
Individual room/peer alerts
Once you drill down into a specific room, the alerts of all the rooms will appear on the page. This includes an alert above the chart and as indicators in the peers table.
Drilling down to any of the peers will also show you the details of the alerts on that peer.
Catching alerts with webhooks
You can also catch custom alerts in watchRTC using webhooks.
These get invoked once the room get “closed”.
Learn more about webhook custom alerts in watchRTC.