Tag Archives for " AppRTC "

How to test network behavior in testRTC?

Earlier this week, we hosted our first webinar in 2019, something we hope to do a lot more (once a month if we can keep it up). This time, we focused on network behavior of SFU media servers.

One of the things we’ve seen with our customers is that different SFUs differ a lot in how they behave. You might not see that much when the network is just fine, but when things get tough, that’s when this will be noticed. This is why we decided to dedicate our first webinar this year to this topic.

There was another reason, and that’s the fact that testRTC is built to cater exactly to these situations, where controlling and configuring network conditions is something you want to do. We’ve built into testRTC 4 main capabilities to give you that:

#1 – Location of the probes

With testRTC, you can decide where you want the probes in your test to launch from.

You can use multiple locations for the same test, and we’re spread wider than what you see in the default UI (we give more locations and better granularity for enterprise customers, based on their needs).

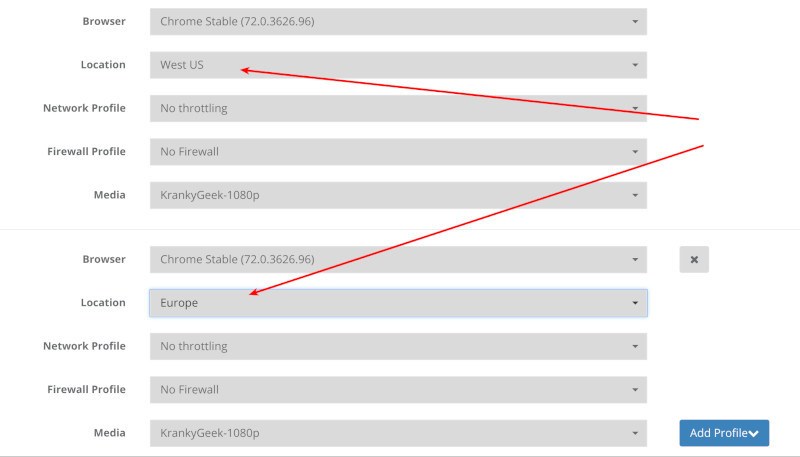
Here’s how it looks like when you test and launch a plan:

In the above scenario, I decided to use probes coming from West US and Europe locations.

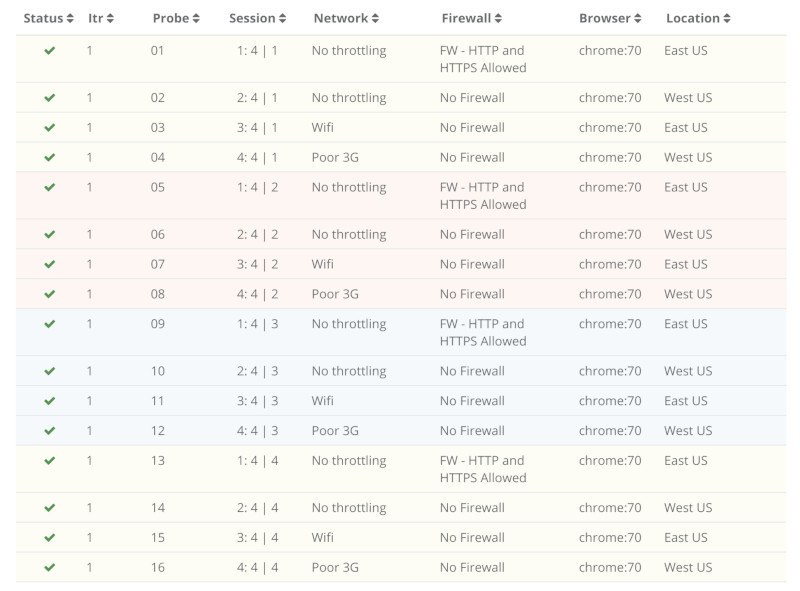
Here’s how I’ve spread a 16-browsers test in the webinar yesterday:

This allows you to test your service from different locations and see how well you’ve got your infrastructure laid out across the world to meet the needs of your customers.

It also brings us to the next two capabilities, since I also configured different networks and firewalls there:

#2 – Configuration of the probe’s network

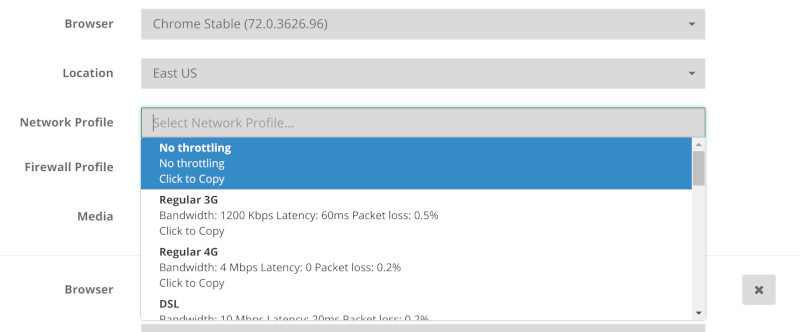
Need to check over Wifi? 3G? 4G? Add some packet loss to the network indicating you want a bad 4G network connection? How about ADSL?

We’ve got that pre-configured and ready in a drop down for you.

I showed how this plays out when using various services online.

#3 – Configuration of the probe’s firewall

You can also force all media to be relayed via TURN servers by blocking UDP traffic or even block everything that isn’t port 443.

This immediately gives you 3 things:

  1. Know if you’ve got TURN configured properly
  2. The ability to stress test your TURN servers
  3. See what happens when media gets routed over TCP (it is ugly)

#4 – Dynamically controlling the probe’s network conditions

Sometimes what you want is to dynamically change network conditions. The team at Jitsi dabbled with that when they looked at Zoom (I’ve written about it on BlogGeek.me).

We do that using a script command in testRTC called .rtcSetNetworkProfile() which I’ve used during the webinar – what I did was this:

  • Have multiple users join the same room
  • They all stay in the room for 120 seconds
  • The first user gets throttled down to 400kbps on his network after 30 seconds
  • That lasts for 20 seconds, and then he goes back to “normal”

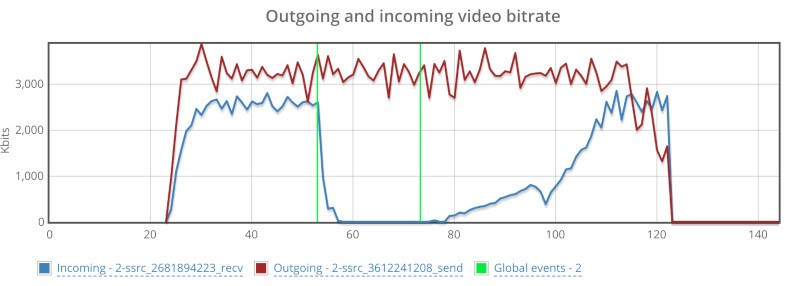
It looks something like this when see from one of the other user’s graphs:

The red line represents the outgoing bitrate, which is just fine – it runs in front of the SFU and there’s no disturbance there on the network. The blue line drops down to almost zero. And takes some time to recuperate.

The webinar and demo

Most of the webinar was a long demo session. You can view it all here:

You can open up your own testRTC account and play with our service a bit under evaluation.

Our next webinar – monitoring

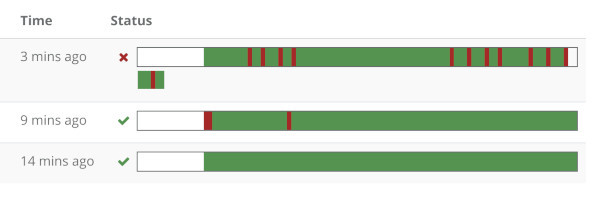
Here’s a kicker – I’ve started working on our next webinar about a month ago. It was to do with monitoring and the things we can do there. I even have 3 monitors running for that purpose only for a month now:

That first one with the reds in it? That’s AppRTC… and it failed. At the time that we did our webinar on network testing. And I planned to use it to show some things. So I reverted to showing results of test runs from a day earlier.

Anyways, monitoring is what our next webinar is about.

I am going to show you how to set it up and how to connect it to third party services. In this case, it will be Zapier and Google Sheet where more analysis will take place.

11

How do WebRTC Media Servers Behave on Packet Loss?

Differently from each other.

Whenever I see people comparing WebRTC media servers, they tend to focus on scale:

– How many sessions can you cram in parallel?

– How many streams can you serve from a single machine?

– How much bitrate can you pump out?

All of these are very important questions – they end up in your sizing calculation that then go into your pricing model for your service. Oh, and we did cover this a bit here when talking about handling WebRTC browsers synchronization at scale.

Now that our new version is taking shape (still in staging, so if you want access – ping us), it is time to play a bit with a few new toys we’ve added for our beloved community of sadists (you may know them as test engineers, but the good ones are sadists – they like inflicting pain upon digital products and services).

What I am talking about here is a combination of two script commands we have:

  1. rtcEvent() – place a vertical event in the graphs
  2. rtcSetNetworkProfile() – change network profiles in runtime

You’ll see how it looks in a second.

What Packet Loss Does?

Packet loss is bad.

You don’t control it. And it can happen at any time. Come and go as it pleases.

The moment you have packet loss, there will be some degradation in the quality of the media. Lost packets means lost data. Means can’t playback something. It might be minor. It might be important.

Next thing that happens? WebRTC (or most other VoIP products for that matter) will start lowering bitrates. Why? Because it assumes there’s congestion on the network, and it is trying to play nice with everyone.

But what happens once that packet loss is gone? Does things go back to normal? And if they do, then how fast will that happen?

My Experiment

I decided to devise a simple enough experiment to get some answers here. I chose the following steps:

  1. Connect to a service
  2. Run for a full minute
  3. Set packet loss to 10% for a full minute
  4. Go back to normal – no packet loss
  5. Wait two minutes

That’s it. What I am interested in is less of what happens during the second minute, but more what happens in the last two minutes, and how that is different than what we have in the first minute of the session.

In general, I decided to place 5 users in the same session, to get that media server working a bit. And I also decided to focus on the SFU kind.
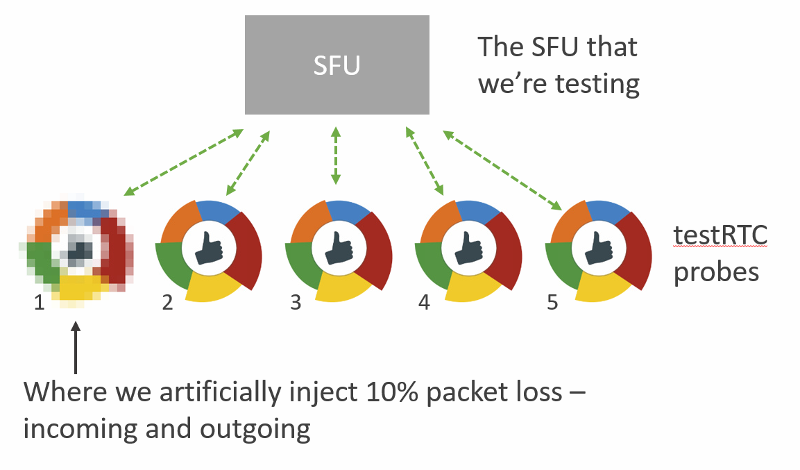
The services I tinkered with are:

  1. AppRTC, just as a baseline for this exercise
  2. Janus, an open source media framework, that can act as an SFU
  3. Jitsi Videobridge, an open source SFU
  4. mediasoup, a relatively new open source SFU
  5. SwitchRTC, a commercial SFU
  6. appear.in, a service that recently added its own self-developed SFU (in beta at the moment)

If you are looking for Kurento or other SFUs – they weren’t included not because I didn’t want to, but because there was no readily available installation out there that I could just use.

I’ll be happy to add more SFUs to the comparison, so give us a shout out if you want to run such an analysis.

Let the fun begin.

AppRTC – My Favorite Baseline

For our baseline, I decide to use AppRTC.

This time, I had to use only 2 browsers, as AppRTC doesn’t support any group calling capabilities.

What it does do is offer the vinyl WebRTC experience.

I started with writing a simple script to fit my needs:

var roomUrl = process.env.RTC_SERVICE_URL + "testRTC" + process.env.RTC_SESSION_IDX + '?vsc=VP8';

var agentType = Number(process.env.RTC_IN_SESSION_ID);
var recuperationTime = 60; // in seconds

client
   .rtcInfo(roomUrl)
   .rtcProgress('open ' + roomUrl)
   .url(roomUrl)
   .waitForElementVisible('body', 60000)
   .pause(2000)
   .click('#confirm-join-button')
   .waitForElementVisible('#videos', 20000)
// Minute 1
   .pause(recuperationTime * 500)
   .rtcScreenshot('Phase 1')
   .rtcProgress('Phase 1')
   .pause(recuperationTime * 500);

// Minute 2
   if (agentType === 1) {
   client
       .rtcEvent('10% Packet Loss start', 'global')
           .rtcSetNetworkProfile('custom', 'packet loss', 10, 'both', 'both'); // 10% packet loss
   }

client
   .pause(recuperationTime * 500)
   .rtcScreenshot('Phase 2')
   .rtcProgress('Phase 2')
   .pause(recuperationTime * 500)

   if (agentType === 1) {
    client
       .rtcSetNetworkProfile('') // back to pristine network conditions
       .rtcEvent('10% Packet Loss End', 'global');
   }

// Minute 3-4
client
   .pause(recuperationTime * 1000)
   .rtcScreenshot('Phase 3')
   .rtcProgress('Phase 3')
   .pause(recuperationTime * 1000);

A few things to note here:

  1. All test scripts on this post can be found on our github account. Easiest way to use them is to import them into your testRTC account
  2. I decided to force VP8 here. VP9 is erratic a bit in its bitrate so I wanted to go for VP8 – hence the addition of ‘?vsc=VP8’ in the first line of this script (check out all of AppRTC’s parameters here)
  3. When the second minute is up, the first probe in each session will generate a global rtcEvent and set packet loss in both directions to 10% (look at lines 23-27)
  4. After an additional second is over, the first probe in each session will generate another global rtcEvent and remove all packet loss and network constraints that might have been used (look at lines 35-39)

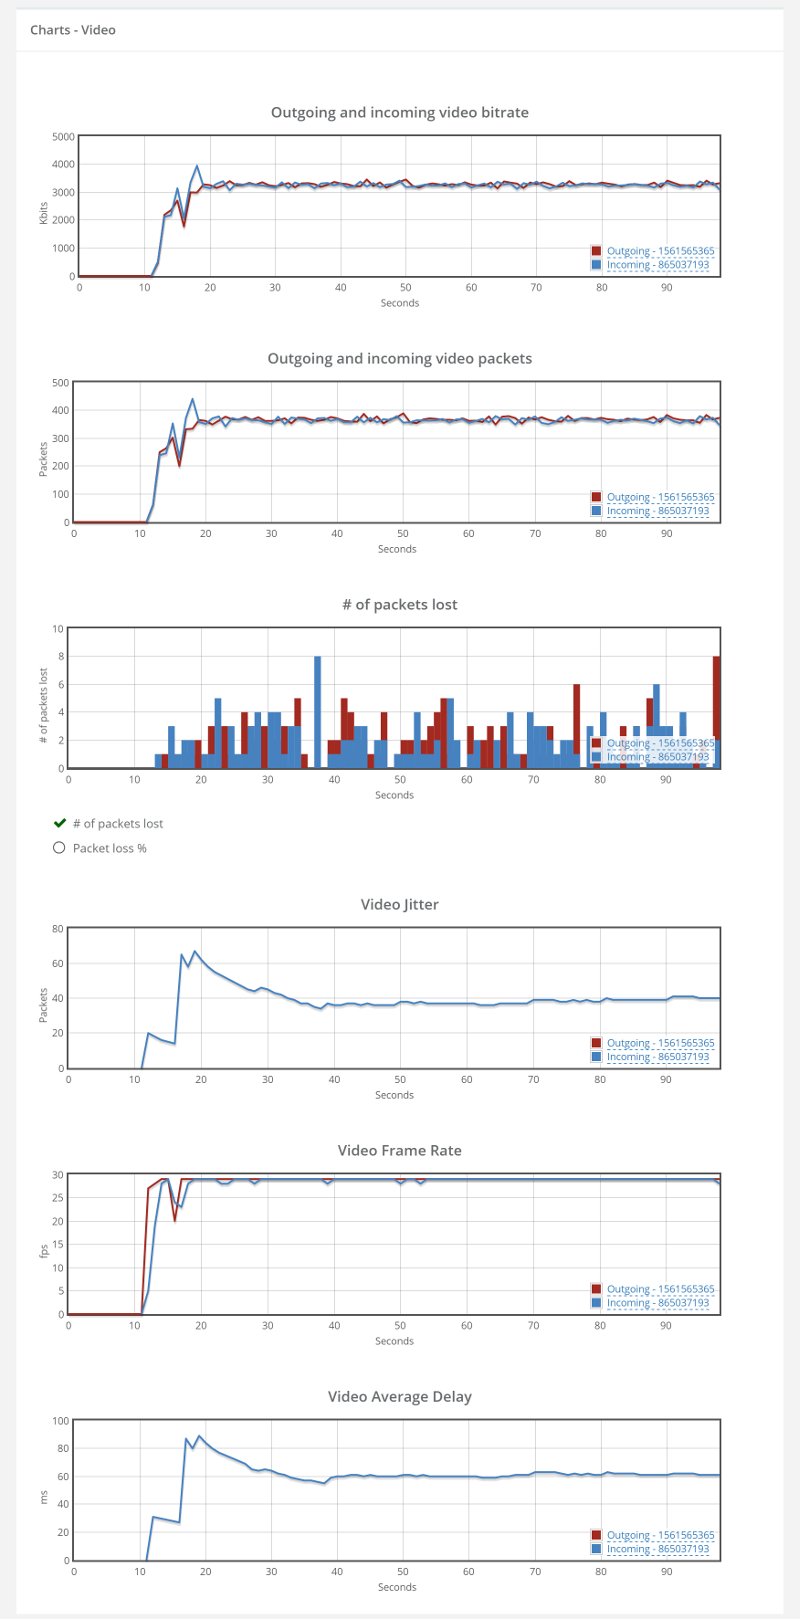
Running that using testRTC yields these results once you drill into one of these sessions:
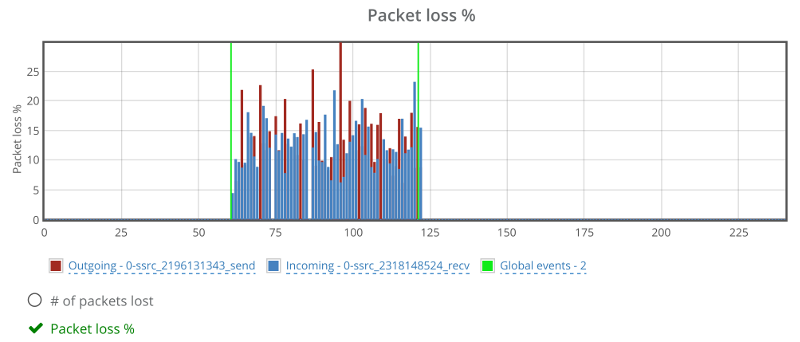
Above you see two things:

  1. The green vertical lines – these are the result of the rtcEvent() calls
  2. The blue and red bars, showing incoming and outgoing packet loss percentage, which averages at 10%
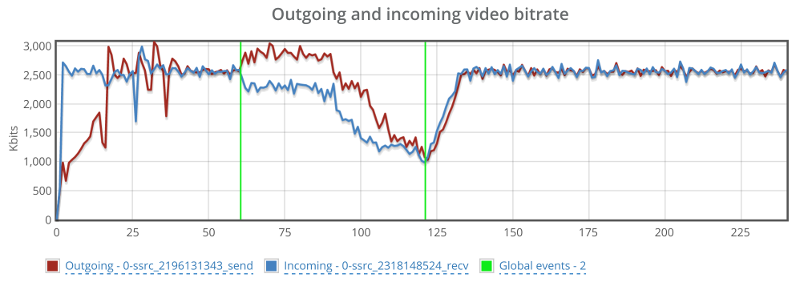
Above you see the video bitrate graph, with the two horizontal lines on it.

Notice how the outgoing bitrate tries going up in the beginning and then drops from 2.5mbps to 1mbps in 60 seconds?

The other thing that interest me is the time it takes for WebRTC/AppRTC to get back to 2.5mbps. And that’s somewhere in the range of 15-20 seconds.

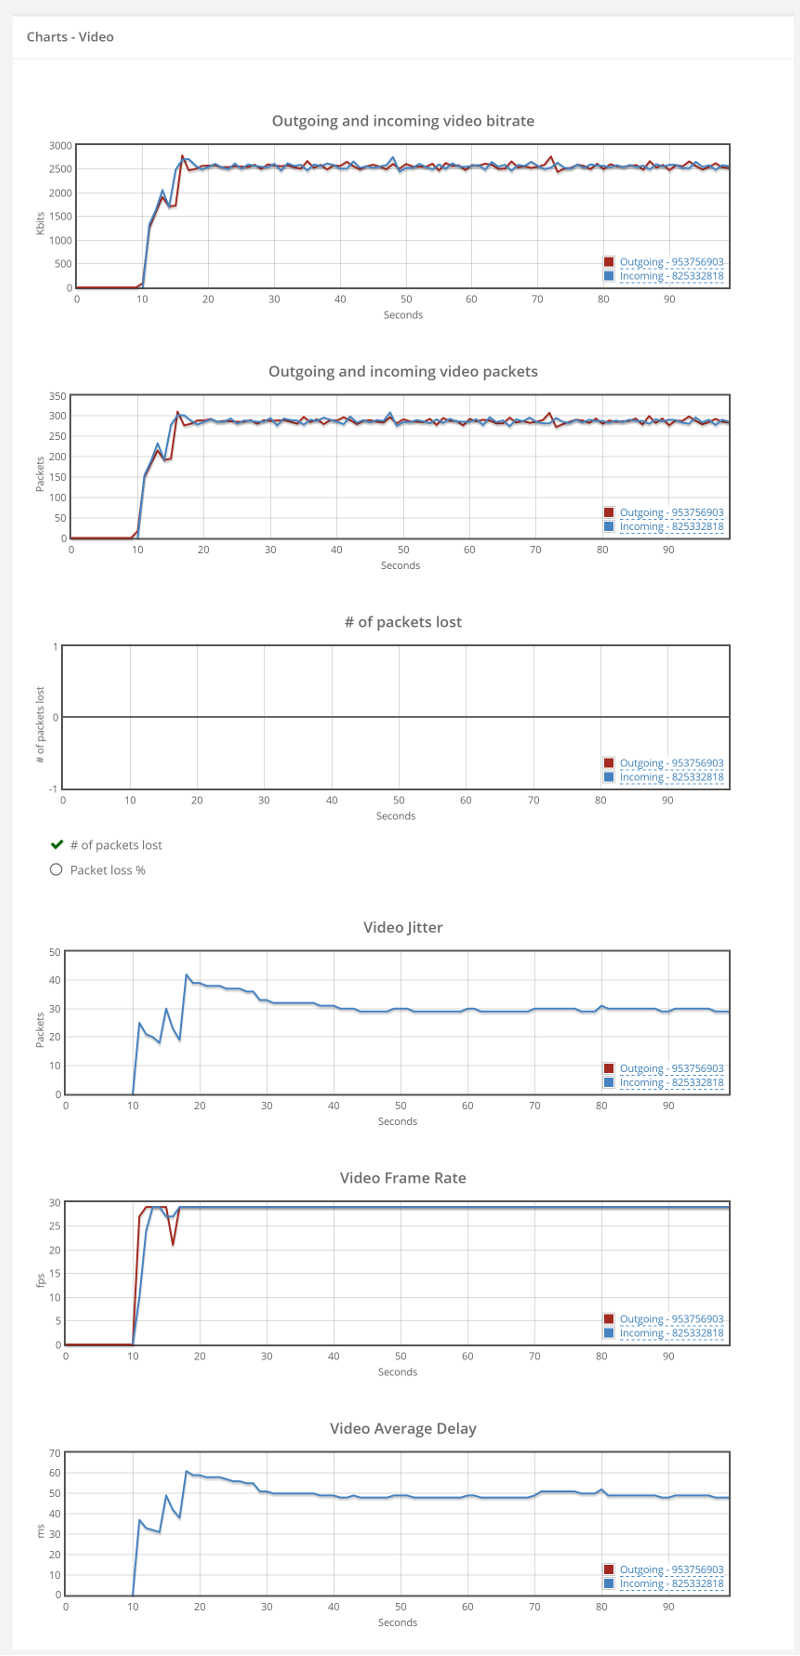
Oh, and because I know you’ll be interested in this – also remember this screenshot of the video average delay we had:
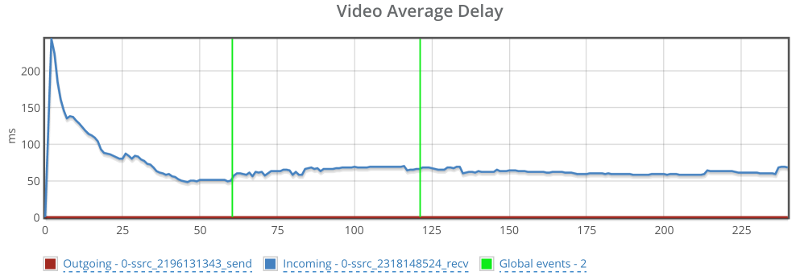
Before we move on to the media servers – remember that what I tried doing with AppRTC is provide a baseline. And the baseline here is “picture perfect”. I didn’t really expect any of the SFUs that I’ve used to be able to match AppRTC with its metrics.

Janus

Janus is an open source media server created and maintained by Meetecho.

They have an online demo running that supports a simple video room.

So we just hooked our script on top of that to get the results we needed. We aimed for 5 browsers in a single room – which will be the norm from now on in this article.

The Janus demo has somewhat of a single room, and I had to end up with a J3rry user in there, though he seemed harmless with no camera or bitrate in my session.
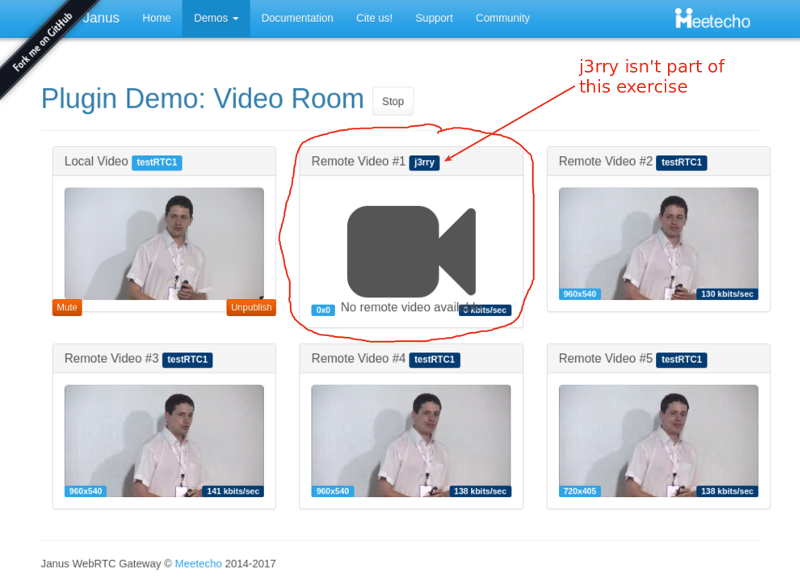
You can see above that the bitrates are rather low – around 140 kbps for each video stream coming into this room. And that’s even before I started adding packet loss.

During packet loss and after it, we “lost” two participants. Here’s a screenshot taken a minute after I stopped packet loss altogether:
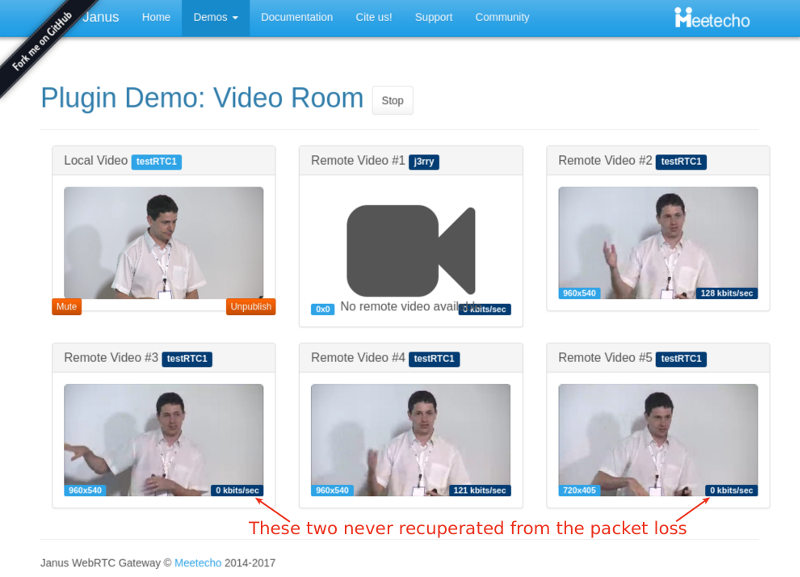
The graphs in testRTC show a grim picture:
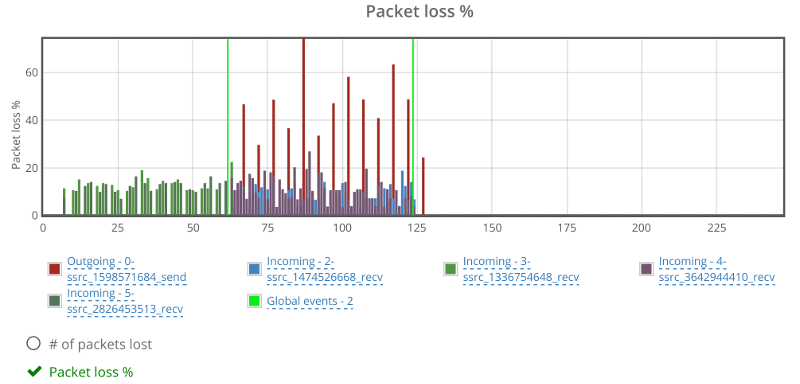
Janus reports packet losses at higher intervals than what WebRTC does, which is why we see the spikes on the outgoing reporting that go up to 50% and more. The weird thing is the two incoming channels that show around 10% of packet loss as well. Which is weird – more about this later.

Here’s how video bitrates look like for some of the streams (one outgoing and two incoming):
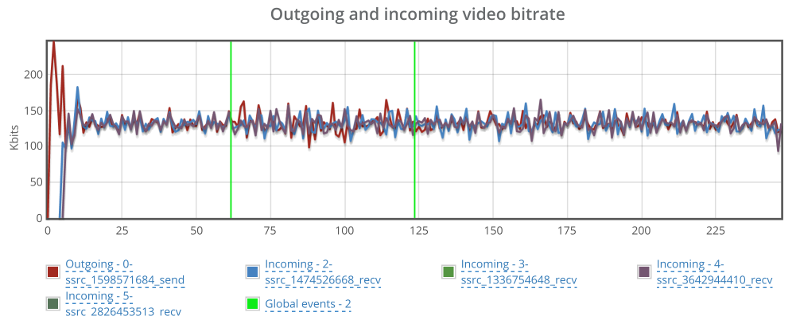
No change even though we have packet loss.

And here’s what happens in the two other incoming streams:
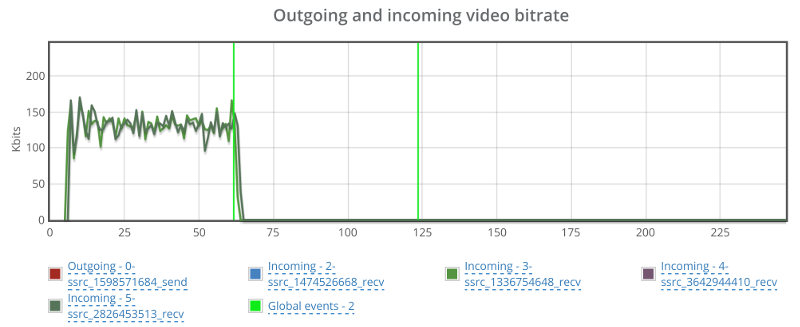
Apparently, these two incoming streams are the ones showing packet loss from the start. They somehow decided to drop to 0 the moment we cranked up the artificial packet loss from 0 to 10% – but never recuperated from it.

Looking at the average delay for the video…
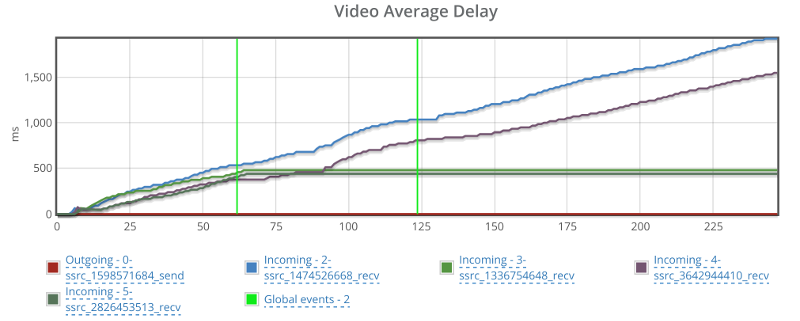
Things can’t be good, but seems like this has nothing to do with my packet loss shenanigans.

It might be Janus and it might just be the demo machine. If I could, I’d reboot it and start all over again.

Jitsi

For me the Jitsi Videobridge is where I go first to run demos and tests on an SFU with testRTC:

  • It is out there
  • It is easy to automate
  • And I am a creature of habit…

To run our test here, we’ve directed 5 of our probes into a single room on the Jitsi meet online service/demo.

After a few attempts, I decided it would be better to disable simulcast, using this prefix to the URL: ‘#config.disableSimulcast=true’. I didn’t do it because simulcast is a bad thing, but because it made analyzing the results much harder for what I had in mind.

If we look at the packet loss graph, it will tell a similar story to what we’ve seen so far:
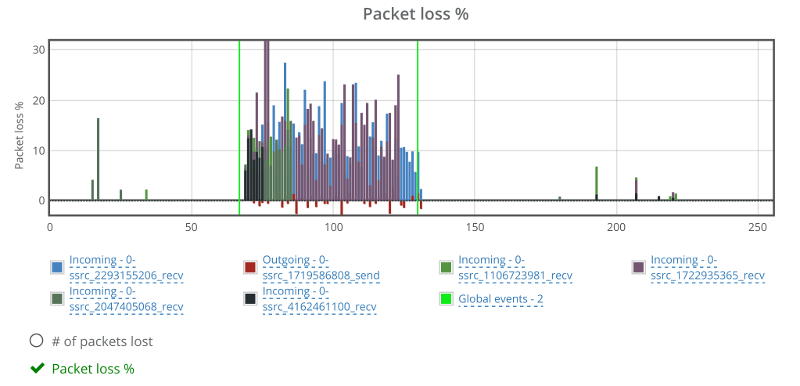
While there are some packet losses out of the one minute killzone I created, they are negligible (or at least sporadic). That negative values you see for packet losses in the red color? They are reports of the browser’s outgoing stream from the machine we induced packet loss on. This is most probably related to a Chrome bug (HT to Philipp Hancke).

I’ve split the video bitrate graphs here into two graphs – the outgoing one and the incoming ones since they tell two separate stories.
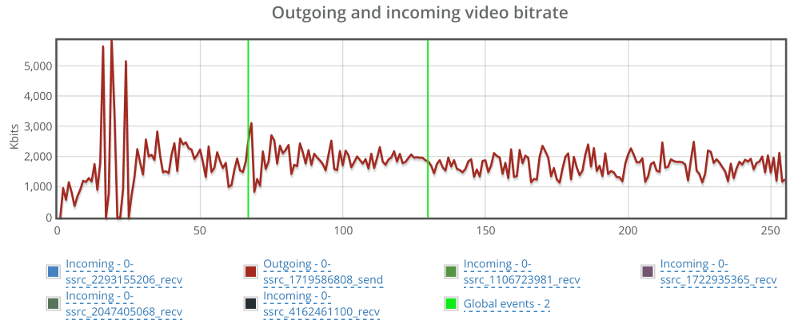
This one caught me by surprise – the outgoing bitrate shows no signs of a change due to packet loss. I wonder what Jitsi is doing (or not doing) to have packet loss ignored in such a way. So I decided to look at it from the receiving end of one of the other four browsers in the same session:
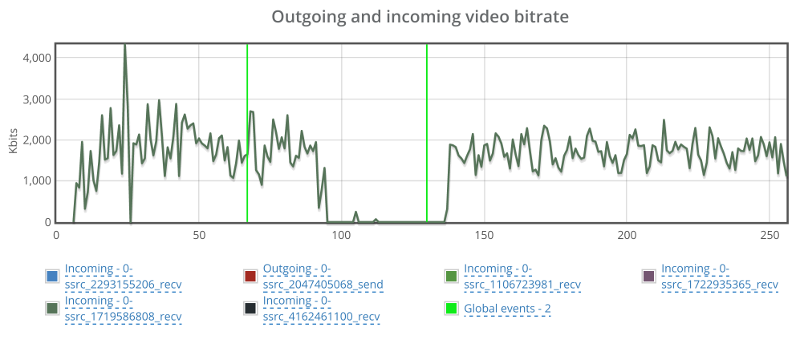
Bitrate drops to 0 for a duration of almost a full minute before coming back up.

Back to the browser with the trashed network, let’s see what happens to the incoming video streams:
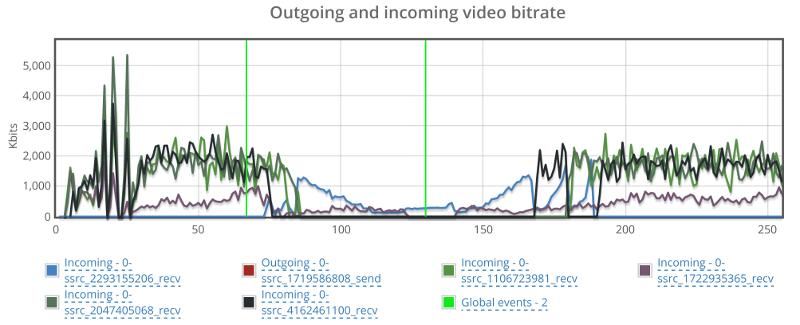
Things drop down from around 2mbps to almost 0 on all incoming channels, taking around 40-60 seconds to get back to normal.

One last glance before we move on – check out video average delay:
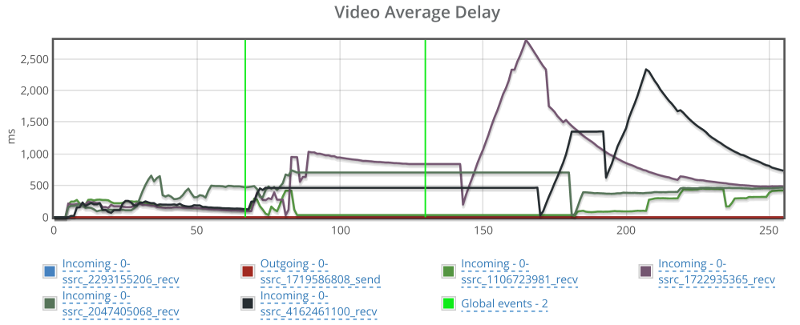
Jitsi had some hard time recuperating from that packet loss.

It should be noted that I’ve played around with Jitsi before their recent updates – especially the ones including adaptivity.

Mediasoup

mediasoup is a rather new player in the open source SFU space. It is built in C++ as a Node.js module. After a quick Twitter chat, Iñaki Baz Castillo was kind enough to configure it to my needs (specifically, allowing for more bandwidth on the online demo).

Starting as always with packet loss:
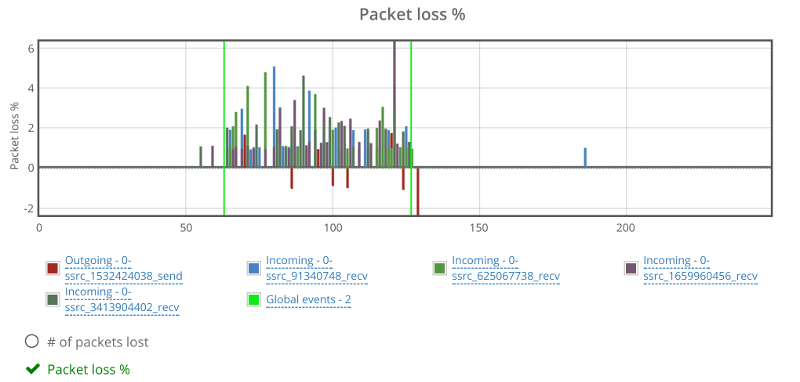
The graph seems fine. Percentages are low because of the way packet losses are reported back from the media server. Probably some FEC / retransmissions are involved as well (this would be the case with many of the media servers out there).

Looking at the video bitrate, we see an interesting picture:
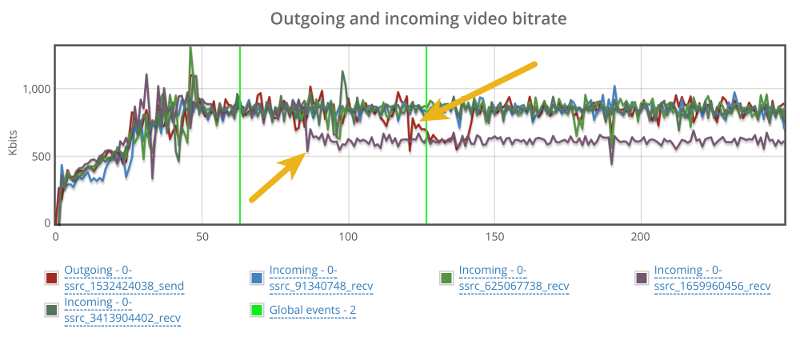
There’s a hiccup in the outgoing bitrate (the red line), but that for some reason takes place close to the end of the 60 seconds packet loss window.

There’s also a reduction in incoming bitrate for one of the video stream. It starts around 20 seconds into the packet loss zone, but it doesn’t recover even when we remove the packet losses.

Video delay is also a bit problematic:
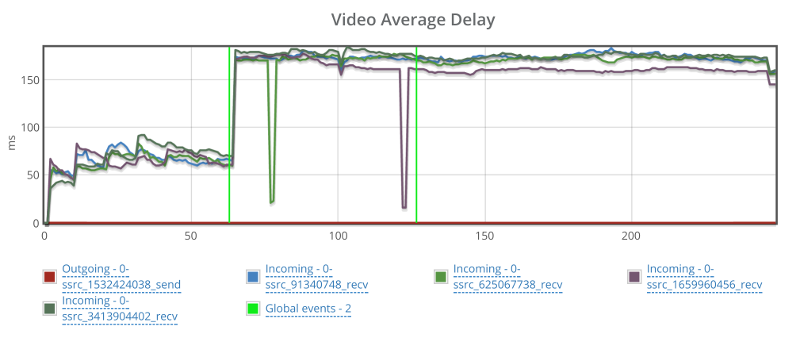
It starts off nicely, goes up when packet losses start and never recuperates.

SwitchRTC

Moving on from open source to commercial, there’s SwitchRTC.

It started by me asking for a 2mbps bitrate limit. Now, the way this was set up and without simulcast, it meant the browser is going to need to encode 2mbps and decode 4 streams of 2mbps each. This turned out to be a bit too much for the way we configure our machines (and frankly – probably too much for almost any use case you plan on deploying when it comes to assuming what your typical customer may have).

The end result of it was graphs that went all over the place – each stream and each browser tried hard to compete on resources that were limited, and it wasn’t really nice.

So we dialed back down to 1mbps bitrate limit.

As always, let’s first look at the packet loss graph:
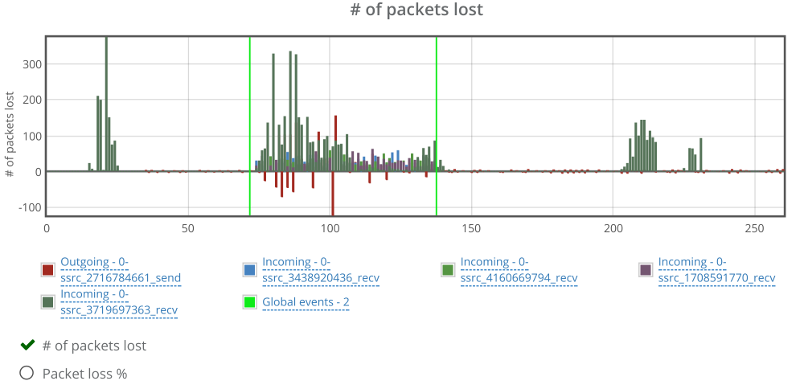
Two things here to note:

  1. One of the incoming video streams has packet losses outside the packet loss zone. Not unheard of, but a bit off the charges compared to others. I think that is due to the data centers used by SwitchRTC for this demo
  2. There’s negative packet losses on the outgoing video stream. This is due to the way SwitchRTC handles packet loss reporting (or more likely filtering packet loss reporting)

For bitrate, I took two screenshots. One for the incoming video streams and one for the outgoing video stream.
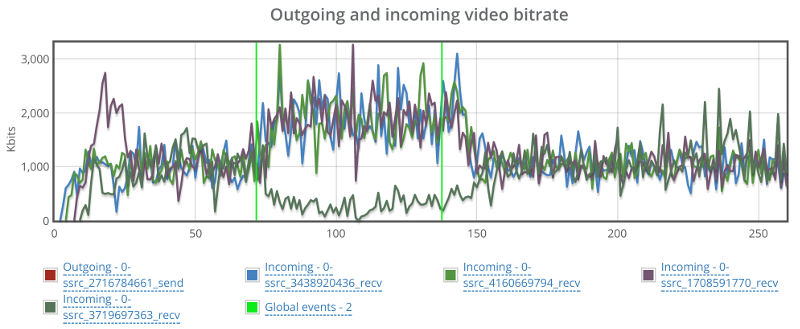
On the incoming stream we see an interesting phenomena.

When packet loss starts, bitrate picks up, most likely to overcome the packet loss. It makes sense, since we didn’t limit bitrates, so that seems like the correct strategy. Would be interesting to see what will happen if we limit bitrate as well.

The second thing, is that we have one of the incoming stream dropping down to almost zero and then picking up again. This is the same stream that shows high packet losses. I wonder what causes that.
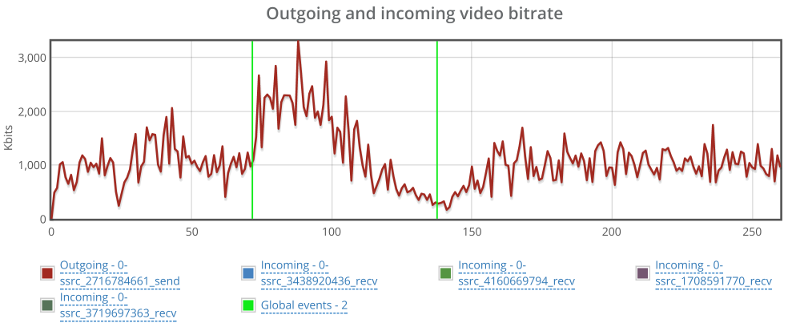
The graph above shows the outgoing video stream. This is almost textbook behavior for the outgoing video. Once it notices there’s issues, it starts increasing bitrate to compensate, and when that fails – it drops down slowly. It is similar, though not as smooth as what you see with AppRTC.

appear.in

appear.in have a beta SFU, which Philipp Hancke was kind enough to let me use.

Now, appear.in isn’t a media server or a component you can use in your own service – it is a full service, which makes this comparison a bit unfair – checking demos and comparing them to a commercial service.

But then I wanted to check this one out, as it isn’t based on any external framework – it was self developed in house at appear.in

The results are interesting.

Packet loss graph looks rather nice, if a tad low in the percentage:
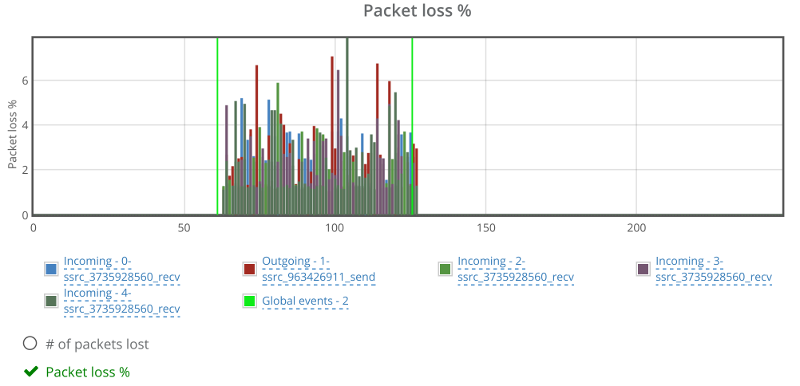
This shows how far appear.in goes in gauging and polishing the way they make use of network resources.

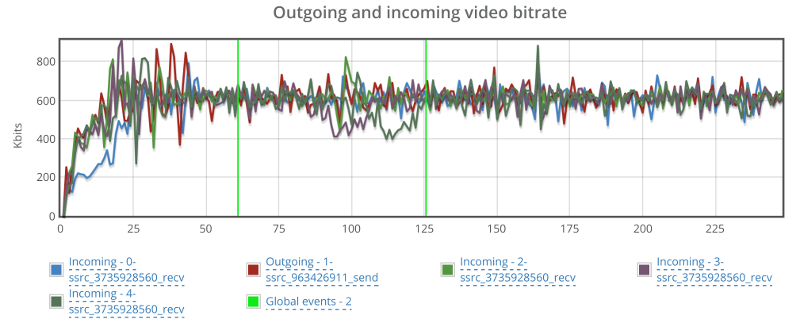
Video bitrate stays at the 600kbps vicinity – not showing any real effects from my additional packet loss:
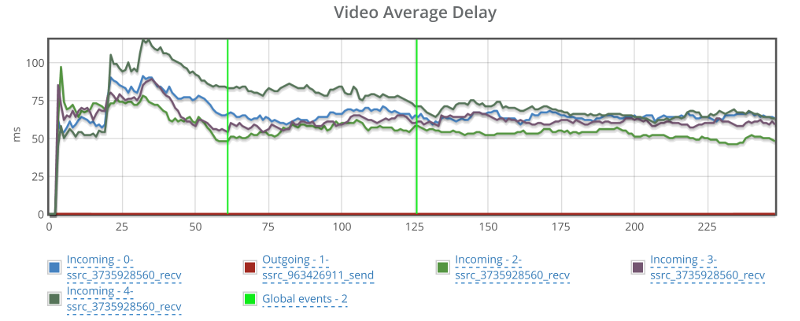
Best part though is that the video delay graph doesn’t look erratic:
I am not sure how to compare these results to the rest. I will need more time to check this out – time that I just didn’t have available for this experiment of mine. I will leave it for some future tinkering.

Summing things up

Different media servers will act differently. Especially when putting them under different network conditions.

What I wanted to show here, is how you can use testRTC to goof around with whatever setting you want. Here are a few other ideas:

  1. Drop the network down to 0 bitrate. Wait a bit. Put it back up. Did media return? How quickly did it come up again?
  2. Limit bitrates to different levels. Check if your media server adapts things like resolutions and other interesting parameters to fit the needs
  3. Go down to 50 or 100 kbps. Does video persist or is the media server shutting it down in favor of audio?
  4. Limit bitrate and add a bit of packet loss at the same time (this would be closest to real life). See what happens then – how will the media server behave?
  5. Do the above while adding some load on the server. Does it start fidgeting or is it handling this nicely?

A few things to remember here:

This isn’t an apples to apples comparison

I haven’t taken each and every media server and installed it on my own on the same server configuration. I just used the online demos each of these vendors had. At times, asking for assistance and a bit of configuration from the vendor.

What was different:

  • The server(s) the media server was installed on
  • The configuration of the server, especially what max bitrate it allows

What was similar:

  • I tried disabling simulcast in all servers. Assume that’s a bad thing to do, but I wanted a level playing field on that front
  • The browser used. It was the same for all tests. This includes their version, the machine they were installed on, the network they used, their geographical location – everything
  • The scenario itself. I essentially executed the same scenario over and over again in front of different media servers

Where do we go from here?

Media servers are hard to develop. They are hard to tweak and optimize. And they are hard when it comes to making sizing decisions with them.

They are also pretty good. Most of the ones shown here are running in production services with live customers.

When you go tomorrow to pick the media server for your own project. Or when you want to plan how to size capacities per machine. Or if you want to check your media server in real life scenarios – we’ve got your back.

Check us out. I am sure we can be of help to you.
6

Executing a WebRTC test that scales

There’s a growing trend from the companies that come to testRTC in recent months, and it has to do with the focus of what they are looking for.
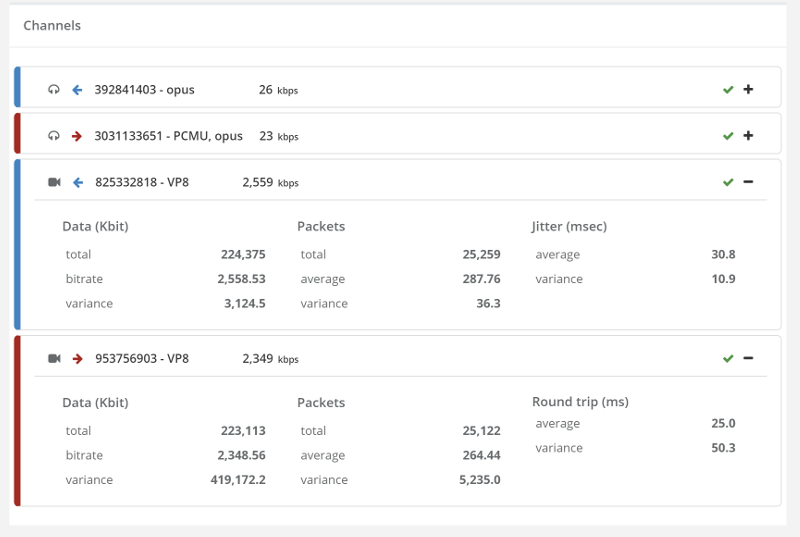
Most are less interested in how testRTC can be used for functional testing – things like coverage of scenarios and finding edge cases and automating tests for them. What people are interested now when they want to run a WebRTC test scenario is how to scale it.

Customers typically try to take stress in WebRTC tests in two slightly different vectors: they either focus on testing how their WebRTC service can handle multiple sessions in parallel or they focus on testing how their WebRTC service can increase the number of users in a single session.

Let’s review what’s the meaning of each of these alternatives.

#1 – WebRTC test that scales to a large number of sessions

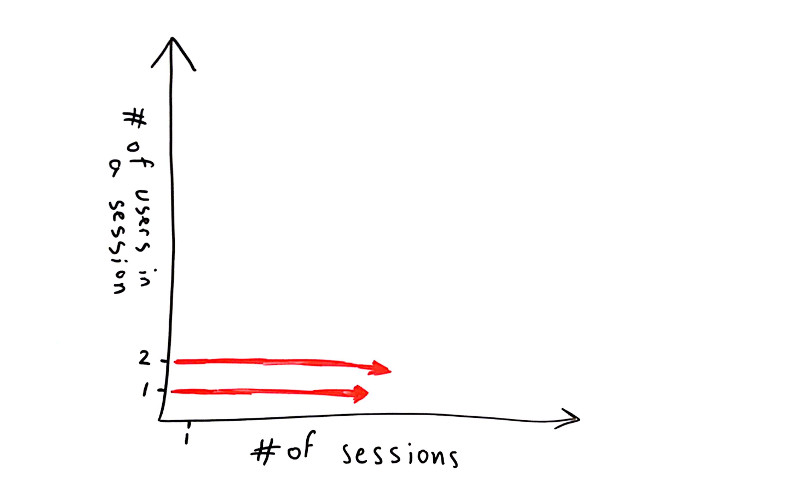
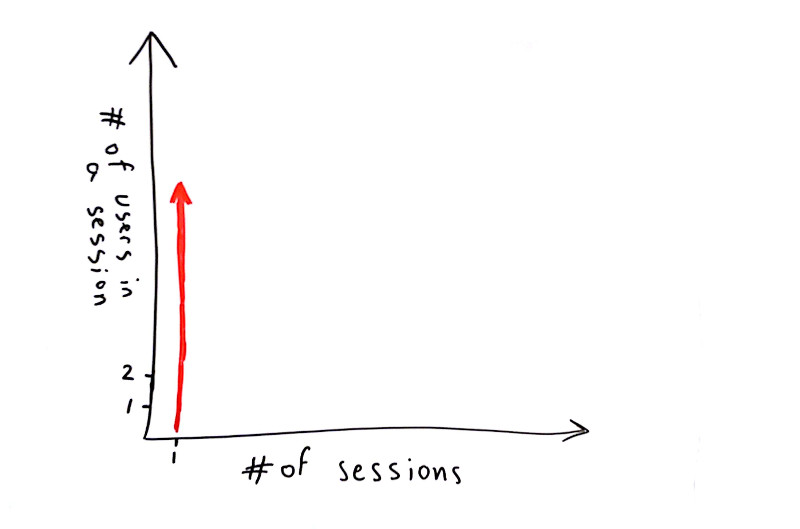
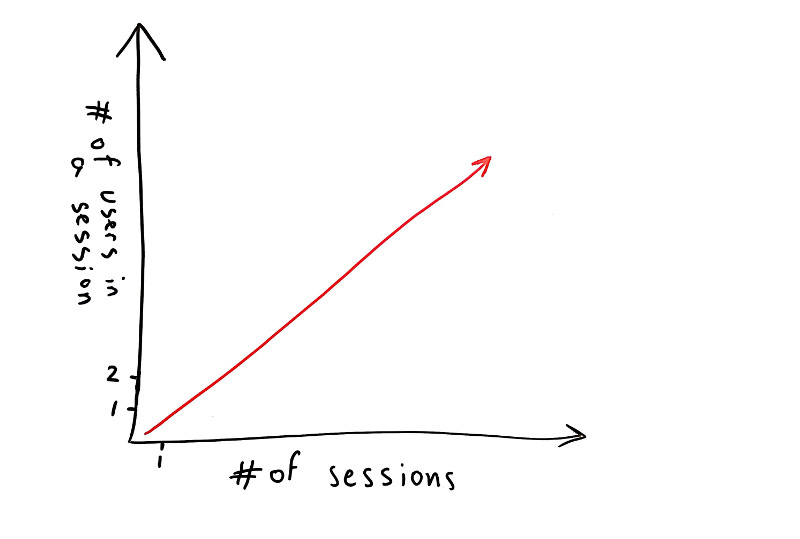
I decided to put things on a simple graph. The X axis denotes the number of sessions we’re going to focus on while the Y axis is all about the number of users in a single session.

In this case, where we want to test WebRTC for a large number of sessions, we will have this focus:

Scale a WebRTC test by the number of sessions

So we have a WebRTC service to test. It has a single user in a session (a contact center agent receiving calls from PSTN for example) or two users in a session (one person talking to another across browsers).

In such a case, vendors are usually concerned about stressing their servers – checking if they can fit their intended capacity.

When this is done, there are three different things that can be tested for scale:

  1. The signaling server
    • How well does it behave while increasing capacity? How is its connection to the databse? Does it slow down as connections accumulate? Does it leak memory?
    • Usually, stress testing a signaling server is better done with other tools. Ones that have a lower cost per connection than testRTC and don’t really require a full browser per connection
    • That said, oftentimes, you may as well want to throw in a few “real” users using testRTC on top of a tool that loads your signaling connections separately – just to make sure there’s nothing that kills your service when media is added into the mix on top of the signaling
    • You also need to think about the third component below – how do you test your TURN server?
  2. The media server
    • These crop into 1:1 tests when there’s a need to record the session or to enforce a given route. I’ve seen many of these recently, mainly in the healthcare and education markets
    • For single users, this usually means the gateway that connects the user to other networks is what we want to test, and there it will usually include a media server of sorts for media transcoding
    • In such a case, there’s no getting away from the fact that scale is in the low 10’s or 100’s of browsers and real ones are needed. It is also where we see a lot of interest in testRTC and its capabilities
  3. The TURN server
    • Anywhere between 5-20% of the calls will end up being relayed via a TURN server – and there’s nothing you can do about it
    • If you put up your own TURN servers – how confident are you in your setup and its ability to scale nicely as your service grows?
    • One way to find out is to place real browsers in front of your service, but doing so in a way that forces the browsers to negotiate via TURN. This can be acheived by changing the configuration of your client, filtering ICE candidates and doing SDP munging. A better way would be to enforce network rules on the machine running the browser and actually test your service in different network conditions
    • And yes. testRTC allows you to do just that

#2 – WebRTC test that accommodates a large group of users in a single session

The other type of focus use cases we see a lot from our customers are those that want to answer the question “how many users can I cram into a single session without considerably degrading the quality?”

Scale a WebRTC test by the number of users per sesson

Many look for doing such tests at around 10-20 concurrent browsers, either in MCU or SFU models (see this post on the differences between the multiparty WebRTC technologies).

What happens next is usually a single session where browsers are added one on top of the other to check for scale. Here, the main purpose of a test is validating the media server and not much else.

The scenario is rather simple:

  • Try 1:1. Record the results
  • Go for 4 users. Record the results
  • Expand to 10 users. Record the results
  • Rinse and repeat

Now go back to the recorded results and see if the media got degraded:

  • Was latency introduced?
  • Do we see more packet losses?
  • Does bitrates go down the more browsers we add?
  • Is the bitrate stable or fluctuating all over the chart?
  • Is the degradation linear or exponential?

These types of questions are indicators to problems in the WebRTC product’s infrastructure (be it network connections, CPU, storage or software).

#3 – Test WebRTC at scale

And then you can try to accommodate for both these needs. And you should – scale the size of the sessions at the same time that you scale the number of sessions.

Scale a WebRTC test by the number of sessions and by the number of users in them

Here what we’re trying to do is everything at the same time.

We want to be able to place multiple users in the same session but spread our browsers across sessions.

How about running 100 browsers, split across 10 different sessions, where each session accommodates for 10 browsers? This is where our customers are headed next after they tested their WebRTC multiparty service for a single session capacity.

Why is WebRTC test scaling so hard?

When you scale test WebRTC infrastructure, you end up needing lots of bandwidth and processing power. Remember that each user is a full browser (why that is necessary see here). Running 2 or 4 of these may be simple, but running 20 or more becomes quite a challenge:

  • You can no longer place them all in a single machine, so you need to start distributing them – across machines, across data centers
  • You need to take care of both downlink and uplink network speeds – this isn’t easy to acheive at scale
  • You need to synchronize across your small army of browsers so they hit the server at roughly the right time for it all to work
  • Oh – and you need the WebRTC test environment to be stable, so that when issues occur, it will more often than not be due to an issue in the tested product and not in your test environment itself

testRTC, users and sessions

There are many ways to do multiple users in a single session:

  • All join the same URL or room, given the same level of access
  • A chair hosting a large conference, where control and access is assymetric
  • A broadcaster and a large number of viewers
  • A few people in a discussion with a large number of viewers

Each of these scales differently and requires a slightly different treatment.

What we did at testRTC was introduce the notion of #session into the mix. When you indicate #session, the test will automatically wrap itself around that notion – splitting the number of concurrent users you want into sessions at the size you state by #session.

Want to see it in action? Check our our latest tutorial videos on how to scale WebRTC tests in testRTC, by using the notion of a session:

10

What happens when WebRTC shifts to TURN over TCP

You wouldn’t believe how TURN over TCP changes the behavior of WebRTC on the network.

I’ve written this on BlogGeek.me about the importance of using TURN and not relying on public IP addresses. What I didn’t cover in that article was how TURN over TCP changes the behavior we end up seeing on the network.

This is why I took the time to sit down with AppRTC (my usual go-to service for such examples), used a 1080p resolution camera input, configure my network around it using testRTC and check what happens in the final reports we get.

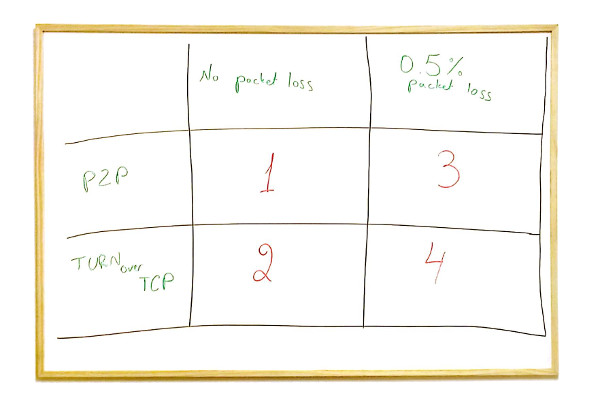
What I want to share here are 4 different network conditions:

Checking how TURN over TCP affects the network flow

#1 – A P2P Call with No Packet Loss

Let’s first figure out the baseline for this comparison. This is going to be AppRTC, 1:1 call, with no network impairments and no use of TURN whatsoever.

Oh – and I forced the use of VP8 on all calls while at it. We will focus on the video stats, because there’s a lot more data in them.

P2P; No packet loss; charts

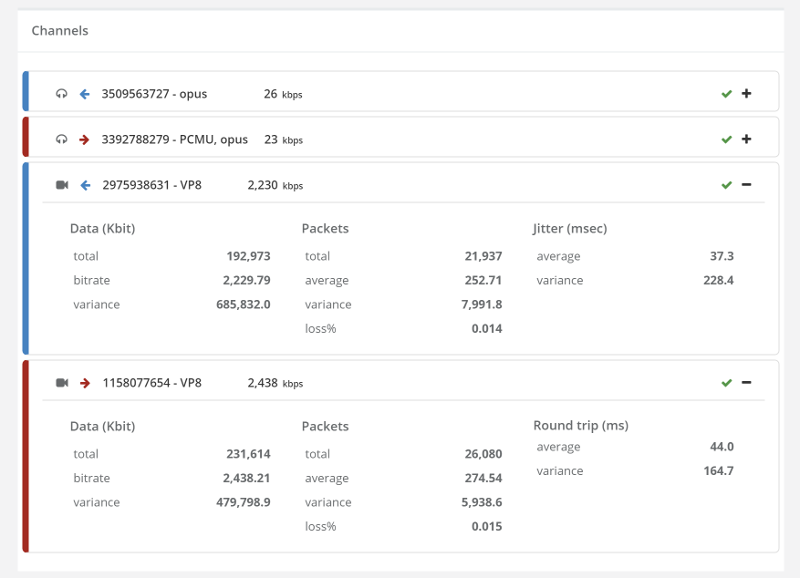
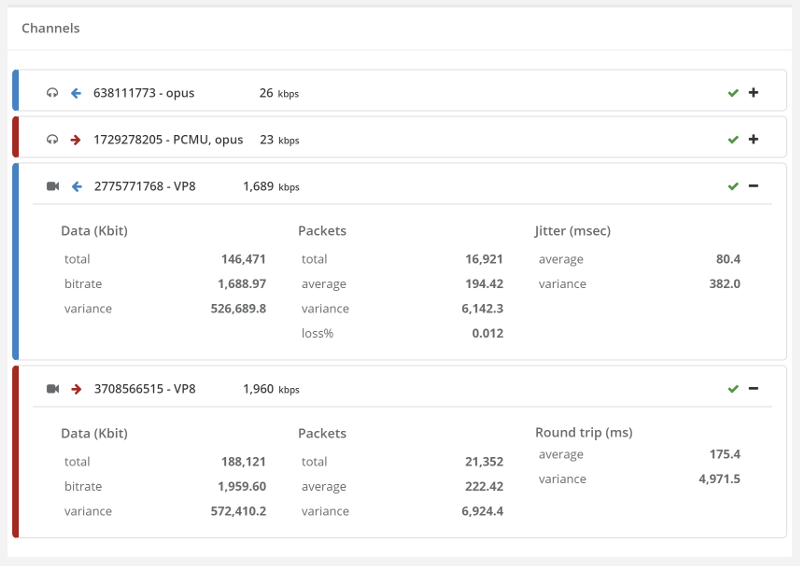
Our outgoing bitrate is around 2.5Mbps while the incoming one is around 2.3Mbps – it has to do with the timing of how we calculate things in testRTC. With longer calls, it would average at 2.5Mbps in both directions.

Here’s how the video graphs look like:

P2P; No packet loss; graphs

They are here for reference. Once we will analyze the other scenarios, we will refer back to this one.

What we will be interested in will mainly be bitrate, packet loss and delay graphs.

#2 – TURN over TCP call with No Packet Loss

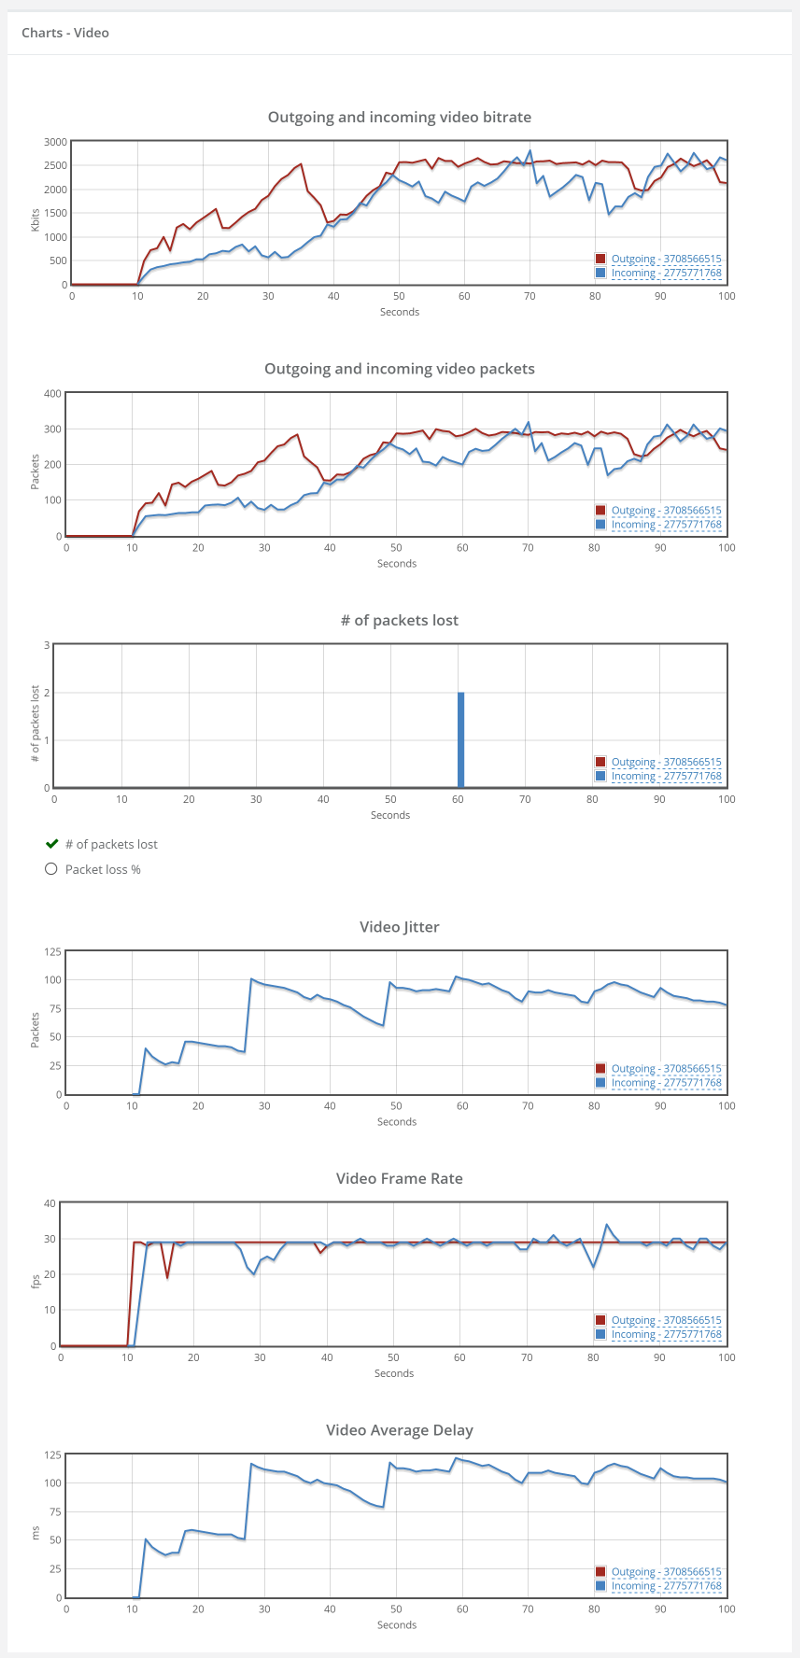
At first glance, I was rather put down by the results I’ve seen on this one – until I dug into it a bit deeper. I forced TCP relay by blocking all UDP traffic in our machines.

TURN over TCP; No packet loss; charts

This time, we have slightly lower bitrates – in the vicinity of 2.4Mbps outgoing and 2.2Mbps incoming.

This can be related to the additional TURN leg, its network and configuration – or to the overhead introduced by using TCP for the media instead of UDP.

The average Round trip and Jitter vaues are slightly higher than those we had without the need for TURN over UDP – a price we’re paying for relaying the media (and using TCP).

The graphs show something interesting, but nothing to “write home about”:

TURN over TCP; No packet loss; graphs

Lets look at the video bitrate first:

TURN over TCP; No packet loss; video bitrate

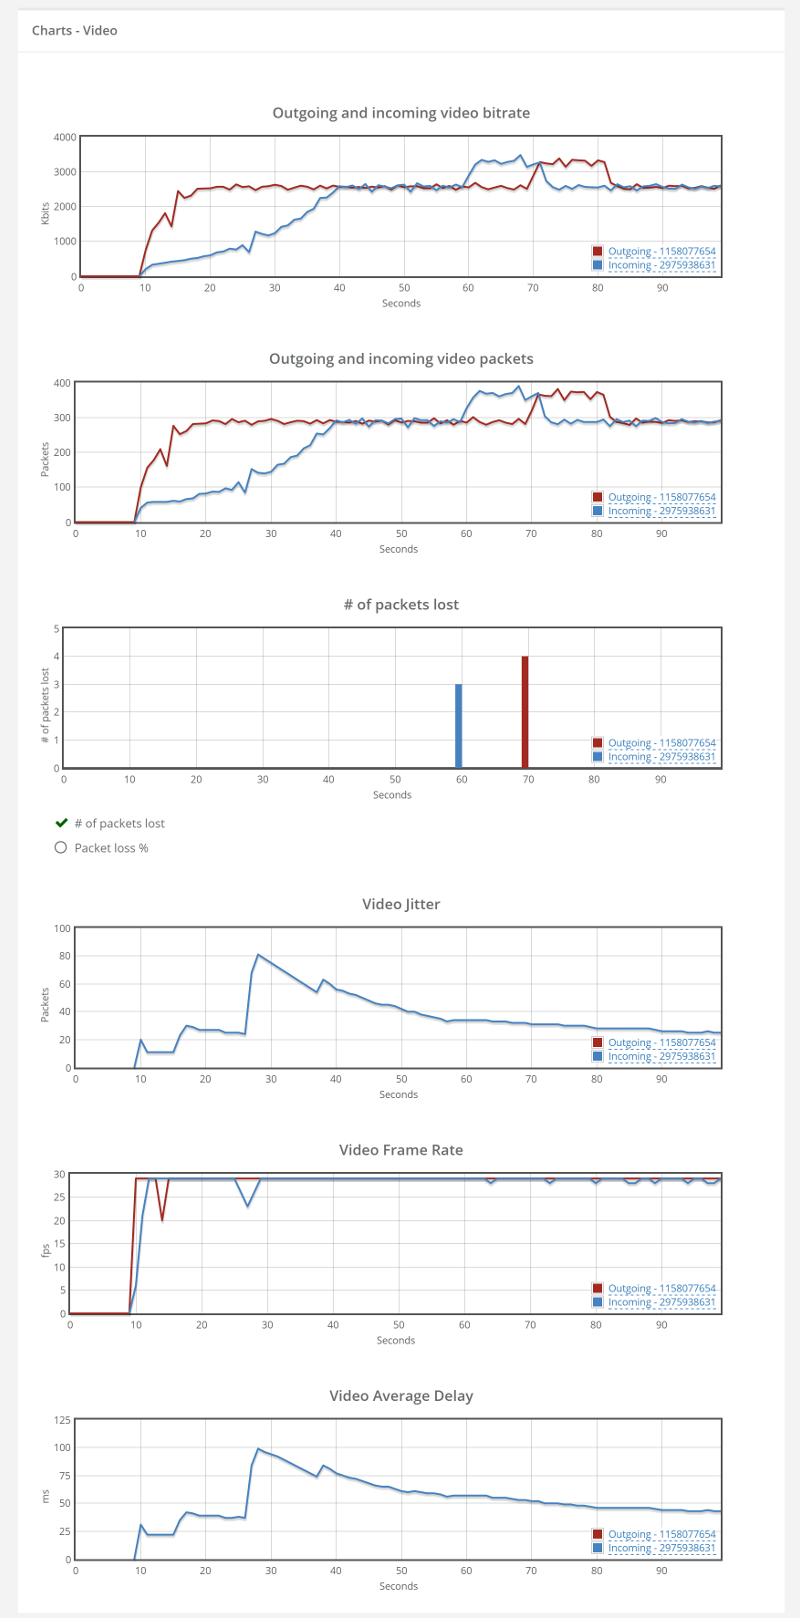
Look at the yellow part. Notice how the outgoing video bitrate ramps up a lot faster than the incoming video bitrate? Two reasons why this might be happening:

  1. WebRTC sends out data fast, but that same data gets clogged by the network driver – TCP waits before it sends it out, trying to be a good citizen. When UDP is used, WebRTC is a lot more agressive (and accurate) about estimating the available bitrate. So on the outgoing, WebRTC estimates that there’s enough bitrate to use, but then on the incoming, TCP slows everything down, ramping up to 2.4Mbps in 30 seconds instead of less than 5 that we’re used to by WebRTC
  2. The TURN server receives that data, but then somehow decides to send it out in a slower fashion for some unknown reason

I am leaning towards the first reason, but would love to understand the real reason if you know it.

The second interesting thing is the area in the green. That interesting “hump” we have for the video, where we have a jump of almost a full 1Mbps that goes back down later? That hump also coincides with packet loss reporting at the beginning of it – something that is weird as well – remember that TCP doesn’t lose packets – it re-transmits them.

This is most probably due to the fact that after bitstream got stabilized on the outgoing side, there’s the extra data we tried pushing into the channel that needs to pass through before we can continue. And if you have to ask – I tried a longer 5 minutes session. That hump didn’t appear again.

Last, but not least, we have the average delay graph. It peaks at 100ms and drops down to around 45ms.

To sum things up:

TURN over TCP causes WebRTC sessions to stabilize later on the available bitrate.

Until now, we’ve seen calls on clean traffic. What happens when we add some spice into the mix?

#3 – A P2P Call with 0.5% packet loss

What we’ll be doing in the next two sessions is simulate DSL connections, adding 0.5% packet loss. First, we go back to our P2P call – we’re not going to force TURN in any way.

P2P; 0.5% packet loss; charts

Our bitrate skyrocketed. We’re now at over 3Mbps for the same type of content because of 0.5% packet loss. WebRTC saw the opportunity to pump more bits to deal with the network and so it did. And since we didn’t really limit it in this test – it took the right approach.

I double checked the screenshots of our media – they seemed just fine:

P2P; 0.5% packet loss; screenshot

Lets dig a bit deeper into the video charts:

P2P; 0.5% packet loss; graphs

There’s packet loss alright, along with higher bitrates and slightly higher delay.

Remember these results for our final test scenario.

#4 – TURN over TCP Call with 0.5% packet loss

We now use the same configuration, but force TURN over TCP over the browsers.

Here’s what we got:

TURN over TCP; 0.5% packet loss; charts

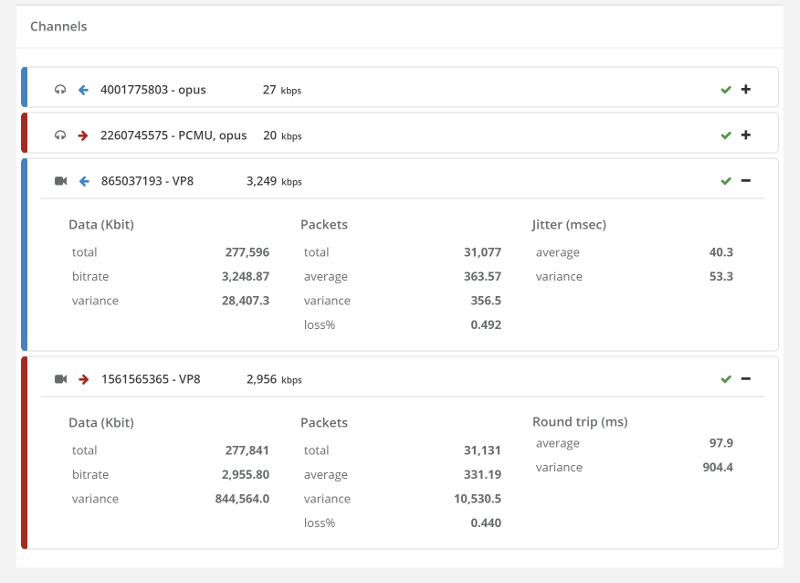
Bitrates are lower than 2Mbps, whereas on without forcing TURN they were at around 3Mbps.

Ugliness ensues when we glance at the video charts…

TURN over TCP; 0.5% packet loss; graphsThings don’t really stabilize… at least not in a 90 seconds period of a session.
I guess it is mainly due to the nature of TCP and how it handles packet losses. Which brings me to the other thing – the packet loss chart seems especially “clean”. There are almost no packet losses. That’s because TCP hides that and re-transmit everything so as not to lose packets. It also means that we have utilization of bitrate that is way higher than the 1.9Mbps – it is just not available for WebRTC – and in most cases, these re-tramsnissions don’t really help WebRTC at all as they come too late to play them back anyway.

What did we see?

I’ll try to sum it in two sentences:

  1. TCP for WebRTC is a necessary evil
  2. You want to use it as little as possible

And if you are interested about the most likely ICE candidate to connect, then checkout Fippo’s latest data nerding post.

Use our Monitor During Development to Flush Out Your Nastiest WebRTC Bugs

Things break. Unexpectedly. All the time.

One thing we noticed recently is the a customer or two of ours decided to use our monitoring service in their staging versions or during development – and not only on their production system. So I wanted to share this technique here.

First off, let me explain how the testRTC monitoring service works.

In testRTC you write scripts that instruct the browser what to do. This means going to a URL of your service, maybe clicking a few buttons, implementing a form, waiting to synchronize with other browsers – whatever is necessary to get to that coveted media interaction. You can then configure the script for  number of browsers, browser versions, locations, firewall configurations and network conditions. And then you can run the test whenever you want.

The monitoring part means taking a test script in testRTC and stating that this is an active monitor. You then indicate what frequency you wish to use (every hour, 15 minutes, etc.) and indicate any expected results and thresholds. The test will the run in the intervals specified and alert you if anything fails or the thresholds are exceeded.

Luxury Casino: Where Dreams and Games Align!

Imagine a world where opulence and entertainment come together to create an unforgettable experience. Welcome to the realm of luxury casinos, where dreams and games align to offer a breathtaking escape from the ordinary. In this article, we will delve into the world of luxury casinos, exploring the allure of these extravagant establishments and the unparalleled excitement they provide. Get ready to be transported to a world of high stakes and luxurious surroundings as we uncover the secrets behind these exclusive gambling destinations.

From the moment you step foot into a luxury casino, you are enveloped in an atmosphere of grandeur and sophistication. The lavish décor, the shimmering lights, and the sound of spinning roulette wheels create an ambiance that is nothing short of mesmerizing. But luxury casinos are not just about the aesthetics; they are also about the thrill of the game. Whether you are a seasoned gambler or a novice looking to try your luck, these casinos offer a wide range of games that cater to every taste and skill level. Join us on a journey through the world of luxury casinos as we discover the allure of high stakes, the adrenaline rush of placing bets, and the unforgettable memories that can be made within these glamorous walls.

The Allure of Luxury: Exploring the World of High-End Casinos

Welcome to Luxury Casino, the ultimate destination where dreams and games align! Step into a world of opulence and excitement, where every moment is filled with the thrill of winning big. With our exquisite collection of top-notch casino games, impeccable service, and luxurious atmosphere, we guarantee an unforgettable gaming experience that will leave you yearning for more.

Indulge in the finest selection of classic and modern casino games, carefully curated to cater to every player’s taste. From the timeless allure of blackjack and roulette to the adrenaline-pumping action of slots and poker, our extensive range of games offers something for everyone. Whether you are a seasoned player or a novice exploring the world of online gambling, Luxury Casino provides a safe and secure environment that ensures fair play and complete peace of mind. Join us today and let us make your dreams come true!

Unforgettable Experiences: The Extravagant Amenities and Services Offered at Luxury Casinos

Welcome to Luxury Casino, where dreams and games align! Indulge in the ultimate online gaming experience at Luxury Casino, where you can escape into a world of opulence and excitement. With a wide selection of luxurious casino games, exclusive promotions, and a secure gaming environment, Luxury Casino is the perfect destination for discerning players seeking a taste of the high life. Whether you’re a seasoned gambler or new to the world of online casinos, Luxury Casino offers an immersive and thrilling gaming experience that will leave you wanting more.

At Luxury Casino, we pride ourselves on delivering the utmost in luxury and sophistication. Our extensive collection of top-quality casino games, including slots, table games, and progressive jackpots, are designed to provide endless entertainment and the chance to win big. With our state-of-the-art software, seamless gameplay, and stunning graphics, you’ll feel like you’ve stepped into a world-class casino from the comfort of your own home. Join the elite and experience the thrill of Luxury Casino today by visiting https://www.luxurycasinoslots.com/registration/ to create your account and start your luxurious gaming journey!

High Stakes, High Rewards: Unveiling the Thrilling Games and Jackpot Opportunities

Welcome to Luxury Casino, where dreams and games align to create an unforgettable gaming experience. As soon as you step into our virtual casino, you will be transported to a world of opulence and excitement. With our sleek and sophisticated design, you will feel like a VIP from the moment you log in.

At Luxury Casino, we pride ourselves on offering a vast selection of top-quality games to suit every player’s taste. Whether you prefer the thrill of slot machines, the challenge of table games, or the excitement of live dealer games, we have it all. Our extensive collection is constantly updated with the latest and greatest titles, ensuring that you will never run out of options.

Not only do we provide an exceptional gaming experience, but we also prioritize the safety and security of our players. Luxury Casino is licensed and regulated by the Malta Gaming Authority, guaranteeing fair play and secure transactions. Our state-of-the-art encryption technology ensures that your personal and financial information is always protected.

Join Luxury Casino today and embark on a journey of luxury and entertainment. With our generous welcome bonus, rewarding loyalty program, and 24/7 customer support, we are dedicated to providing the best possible experience for our players. Don’t miss out on the opportunity to indulge in the ultimate online casino experience at Luxury Casino!

Opulence and Elegance: How Luxury Casinos Create a Glamorous Atmosphere

Welcome to Luxury Casino, where dreams and games align to provide an unparalleled gaming experience. As soon as you step into our virtual world, you will be greeted with a sense of opulence and sophistication. Our meticulously designed platform offers a wide range of thrilling casino games, ensuring that there is something to suit every taste and preference.

At Luxury Casino, we pride ourselves on delivering the ultimate luxury gaming experience. With our state-of-the-art software and cutting-edge technology, you can expect seamless gameplay and stunning graphics that will transport you to a world of glamour and excitement. Whether you’re a fan of classic table games like blackjack and roulette, or prefer the thrill of spinning the reels on our vast selection of slot machines, Luxury Casino has it all. With our generous bonuses and promotions, you’ll have even more chances to win big and make your dreams a reality. Join us today and embark on a journey where luxury and gaming collide!

From Monte Carlo to Las Vegas: Iconic Luxury Casinos Around the World

Welcome to Luxury Casino, where dreams and games align to create an unrivaled gaming experience. Step into a world of opulence and excitement as you indulge in our luxurious selection of casino games. With cutting-edge technology and a sophisticated atmosphere, we bring the thrill of a real-life casino straight to your fingertips.

Prepare to be captivated by our vast array of games, ranging from classic table games like blackjack and roulette to the latest video slots and progressive jackpots. Our collection is carefully curated to ensure that every player finds their perfect match. Whether you’re a seasoned gambler or a novice looking to try your luck, Luxury Casino offers something for everyone.

At Luxury Casino, we pride ourselves on providing an unparalleled level of service and support. Our dedicated team of professionals is available around the clock to assist you with any inquiries or concerns you may have. With our secure and fair gaming environment, you can rest assured that your personal information and transactions are protected at all times. Join us at Luxury Casino and experience the epitome of luxury gaming today!

At Luxury Casino, dreams and games come together to create an unforgettable experience. With a wide selection of luxurious games and a commitment to excellence, this online casino truly stands out from the rest. From the moment you enter the virtual doors, you are transported to a world of opulence and excitement. The sleek and elegant design, combined with the highest quality graphics and sound effects, sets the stage for an immersive gaming experience like no other. Whether you are a seasoned player or new to the world of online casinos, Luxury Casino has something to offer everyone. With a vast array of games to choose from, including slots, table games, and progressive jackpots, you are sure to find your favorite. Plus, with their generous welcome bonus and ongoing promotions, you’ll always have something to look forward to. So why wait? Join Luxury Casino today and let your dreams come true!

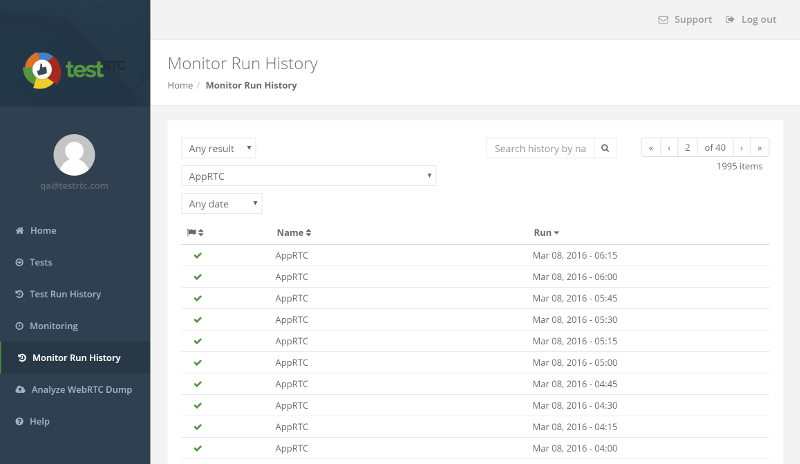
Here’s one of the ways in which we test our own monitor – by running it against AppRTC:

Monitoring AppRTC using testRTC

What you see above is the run history – the archive. It shows past executions of the AppRTC monitor we configured and their result. You should already know how fond I am of using AppRTC as a baseline.

We’ve added this service as a way for customers to be able to monitor their production service – to make sure their system is up and running properly – as opposed to just knowing the CPU of their server is not being overworked. What we found out is that some decided to use it on their development platform and not only the production system.

Why?

Because it catches nasty bugs. Especially those that happen once in a lifetime. Or those that need the system to be working for some time before things start to break. This is quite powerful when the service being tested isn’t pure voice or video calling, but has additional moving parts. Things such as directory service, databases, integration with third party services or some extra business logic.

The neat thing about it all? When things do break and the monitor catches that, you get alerted – but more than that, you get the whole shebang of debugging information:

  • Our reports and visualization
  • The webrtc-internals dump file
  • The console log
  • Screenshots taken throughout the session
  • In our next release, we’re adding some more tools such as an automatic screenshot taken at the point of failure

Those long endurance testing QA people love doing on systems for stretches of days or weeks? You can now set it up to run on your own systems, and get the most out of it when it comes to collection of post mortem logs and data that will assist you to analyze, debug and fix the problem.

Come check us out – you won’t regret it.

2

The day Talky and Jitsi failed – and why end-to-end monitoring is critical

It was a bad day for me. 14 January 2016.

I had a demo to show to a customer of testRTC. Up until that point, the demos we’ve shown potential customers were focused on Jitsi or Talky (depending on who did the demo).

There were a couple of reasons for picking these services for our demos:

  1. They are freely available, so using them required no approval from anyone
  2. They require no login to use, so the script on top of them was a simple one to explain and showcase
  3. They support video, making them visual – a good thing in a demo
  4. They support more than two participants, which shows how we can scale nicely
  5. In the case of Jitsi, you can visually see if the session is relayed or not – making it easy to show how our network configuration affects WebRTC media routing

We used to use them a lot. For me, they were always stable.

Until 14th of January last month, when both mysteriously failed on me. The failure was a subtle one. The site works. You can join sessions. You can see your camera capture. It tells you it is waiting for other participants to join. But it does that also when someone joins – that other participant? He sees the same message exactly.

You have two or more people in the same session, all waiting for each other, when they are already all effectively “in the meeting”.

Our scheduled demos for the day failed. We couldn’t show a decent thing to customers – relying on a third party was a small mistake – we switch to show demo on other services – but it cost us time in these meetings. Since then, we’ve gone AppRTC for our baseline.

I don’t know why Jitsi and Talky failed on the same day. They both make use of the Jitsi Videobridge, but I don’t believe it was related to the videobridge or even to the same issue – just a matter of coincidence.

While these things happen to all of us, we need to strive for continuous improvement – both in the time it takes us to find an issue as well as fixing it.