Tag Archives for " bitrate "

24

How Many Sessions Can a Kurento Server Hold?

Here’s a question we come across quite often at testRTC.

You decided to self develop your own service. Manage your own media servers. And now that time comes to understand your ongoing costs as well as decide on the scale out scheme – at what point do you launch/spawn a new server to take up some of the load from your current media servers farm? How many users can you cram into a single media server anyway?

We decided to check just that, doing it with the help of WebRTC.ventures who worked with us on the setup.

For the purpose of these set of sizing experiments, we picked up Kurento, one of the most versatile open source media servers out there today. We selected a few key scenarios, and WebRTC.ventures installed the server and configured it for us.

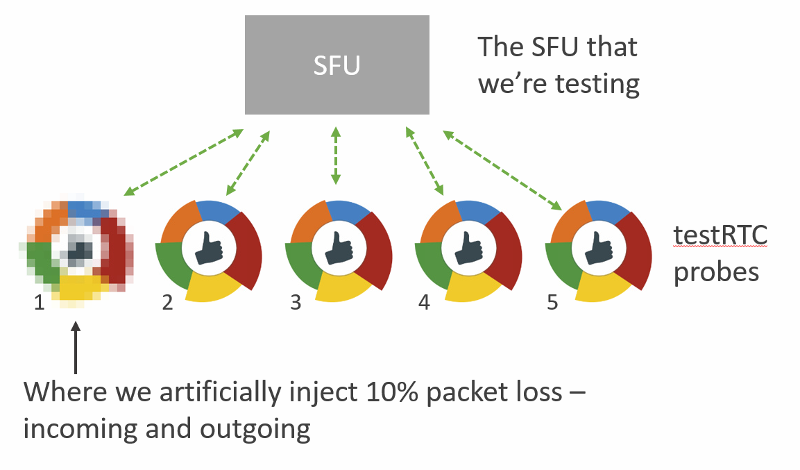
We then used our testRTC probes to understand how many users can we cram on the server in each scenario.

Simple scenario sizing is one step in the process. If you are serious about your service, then check out our best practices to stress testing your WebRTC application.

Get the best practices guide

Why Kurento?

There are a couple of reasons why we picked Kurento for this one.

  1. Because many use it out there, and we’ve been helping customers understand and debug it when they needed to
  2. It is versatile. We could try multiple scenarios with it with relative ease and little programming (although that wasn’t our part of the project)
  3. It does media processing beyond just routing media. We wanted to see how this will affect the numbers, especially considering the last reason below
  4. It’s the first of a few media servers we’re going to play with, so stay with us on this one

The Scenarios

For the Kurento service, we picked up 3 different scenarios we wanted to test:

  1. 1:1 video calls. A typical doctor visitation or similar scenario, where two participants join the same session and the session gets recorded (two separate streams, one for each participant).
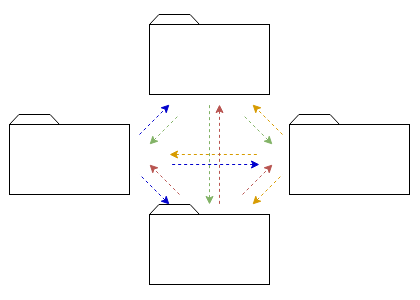
  2. 4-way group video calls. The classic scenario, in an MCU configuration. Kurento decodes and encodes all media streams, so we’re giving it quite a workout
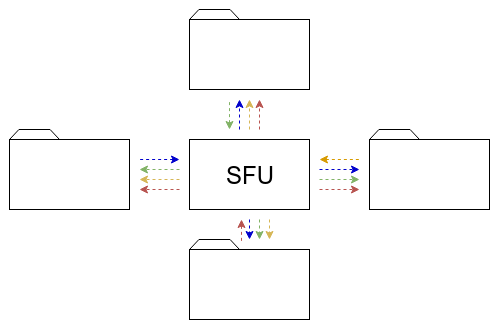
  3. Live broadcast. A single person talking to a large group of viewers.

For scenarios (1) and (2) our question is how many concurrent sessions can the Kurento server hold.

For scenario (3) our question is how many viewers for a single broadcast can the Kurento server hold.

The Setup

To set things up for our test, we did the following:

  • We went for a simple AWS t2.medium machine, but quickly had to switch to a more capable machine. We ended up with a c4.2xlarge instance (8 vCPU, 15 GB RAM) on AWS
  • We had it monitored via New Relic, to be able to check the metrics (but later decided to forgo this approach and just use top with root access directly on the machine)
  • We also had an easy way to reset the Kurento server. We knew that rattling it too much between tests without a reset would affect our results. We wanted a clean slate each time we started

The machine was hosted in Amazon US-East.

testRTC probes were coming in from a different cloud vendor, East and West US locations.

We didn’t do any TURN related stuff – so our browser traffic hit the Kurento server directly and over UDP.

The Process

For each scenario, we’ve written a simple test script that can scale nicely.

We then executed the test script in its minimal size.

For 1:1 video calls and broadcasts we used 2 probes and for the 4-way group video call we started with 4 probes.

We ran each test for a period of 4-5 minutes, to check the stability of the media flow.

We used that as the baseline of our results and monitored to see when adding more probes caused the media metrics to start faltering.
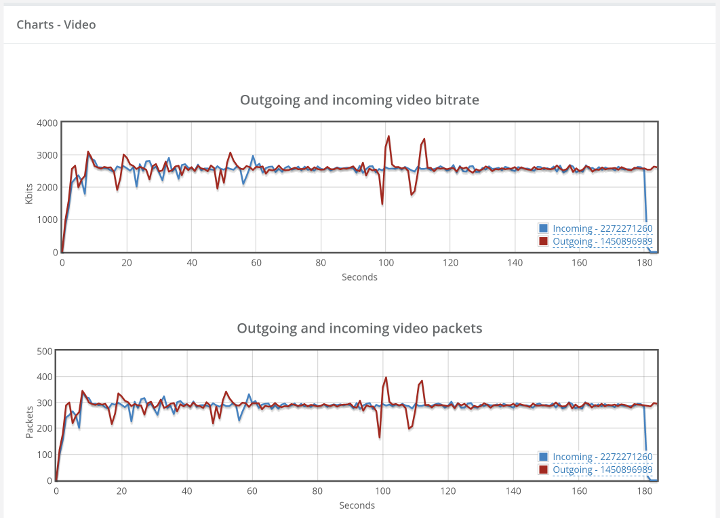
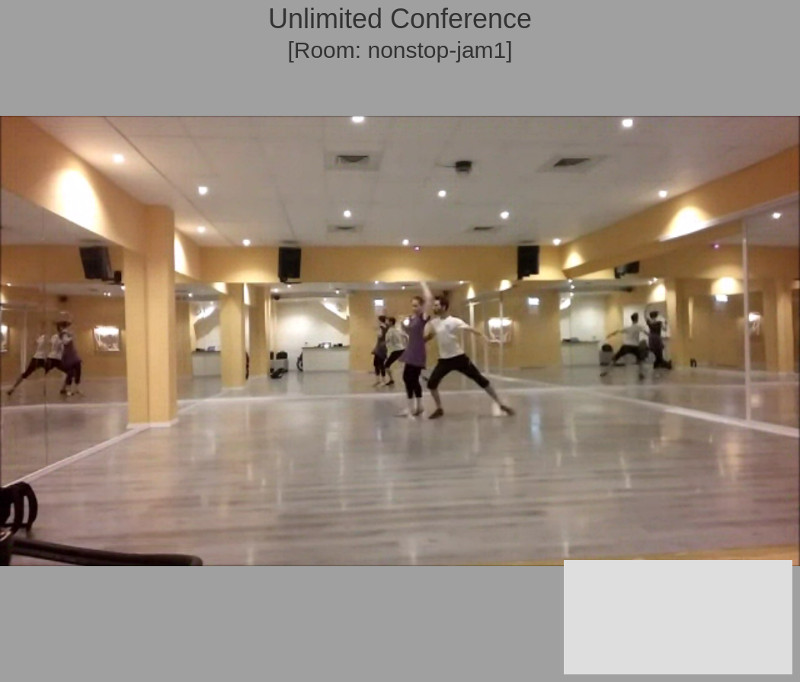
1:1 Video Calls

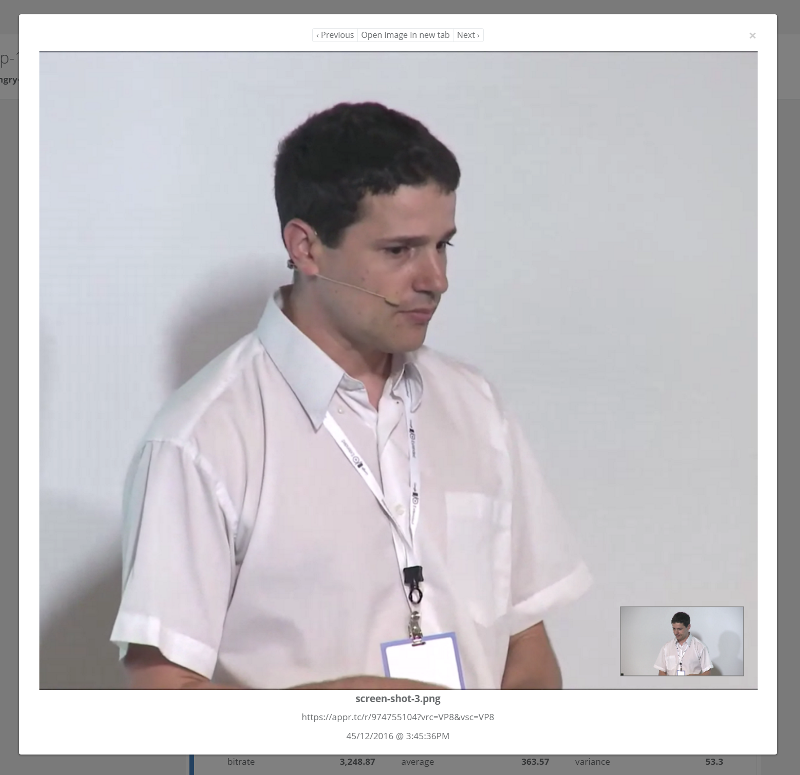
The above screenshot is what you’ll see if you participated in these sessions. There’s a picture in picture view of the session, where the full screen area is the remote incoming video and the smaller window holds our local view.
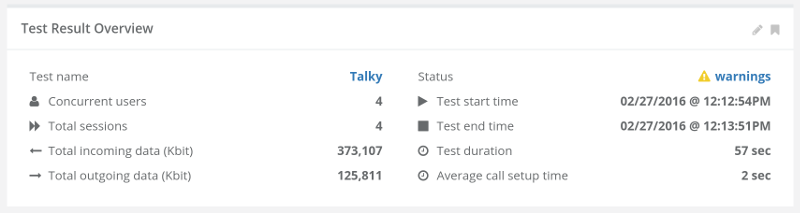
Baseline

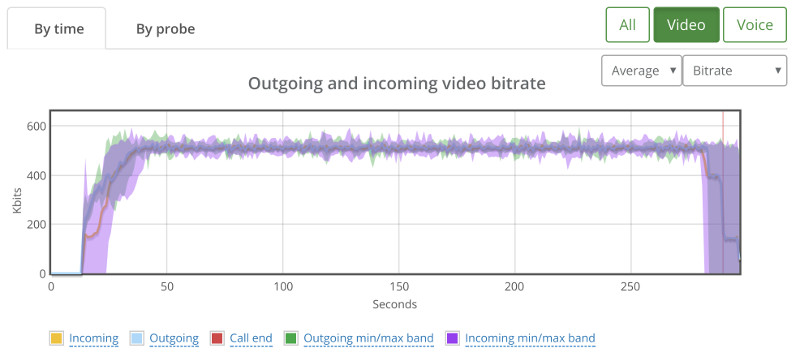
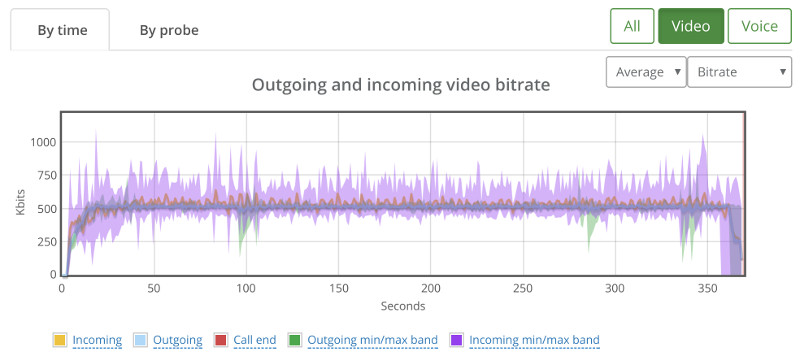
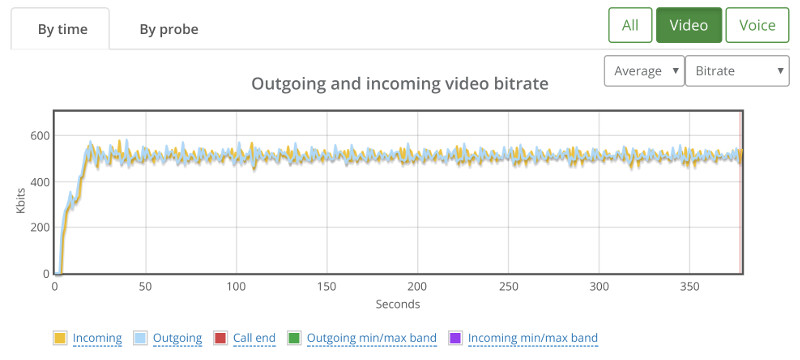
Kurento’s basic configuration limits bitrate of calls to around 500kbps. This can be seen from running a single session in our high level chart:

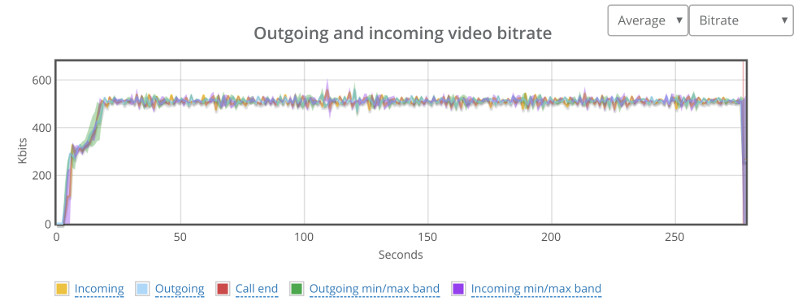
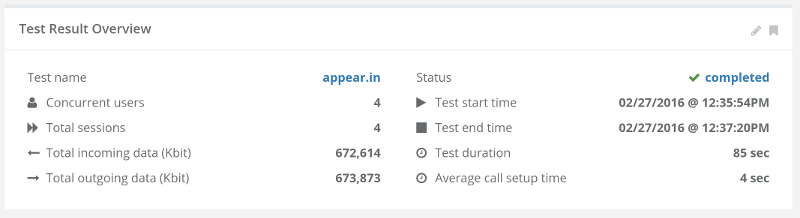
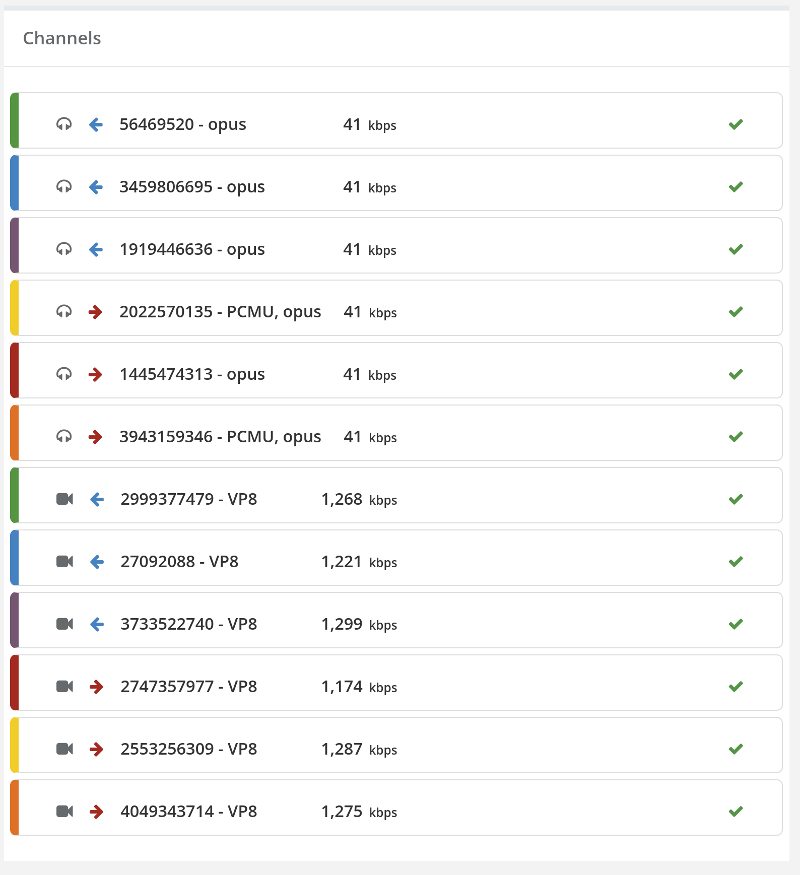
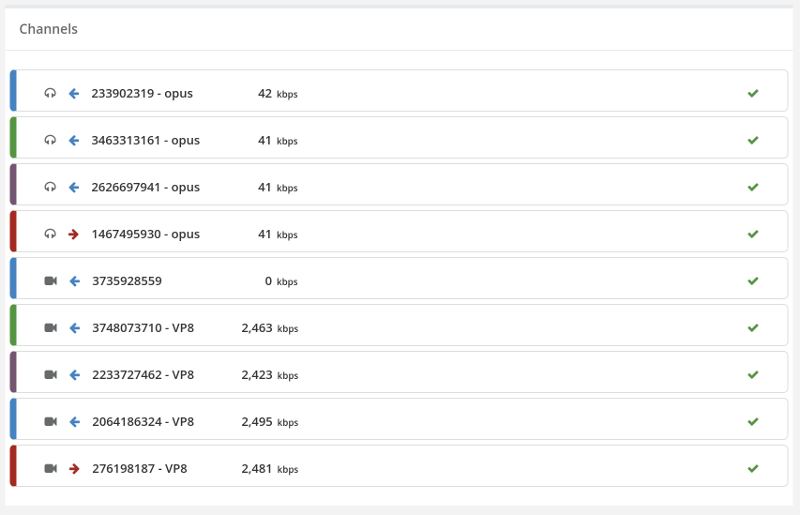
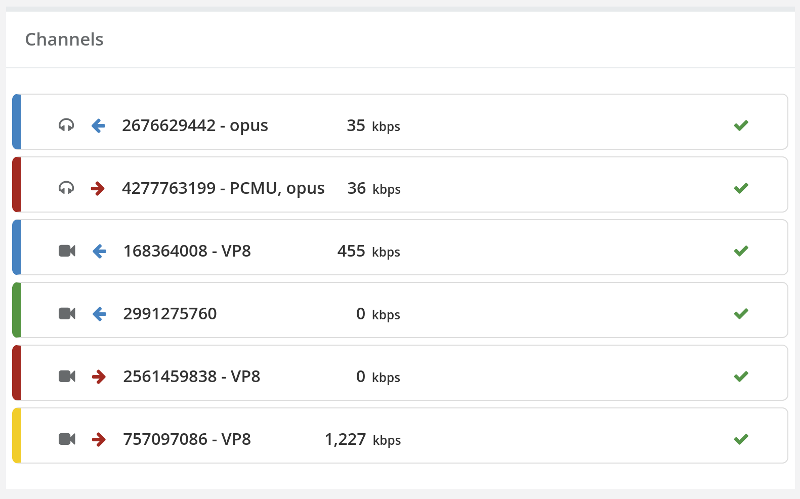
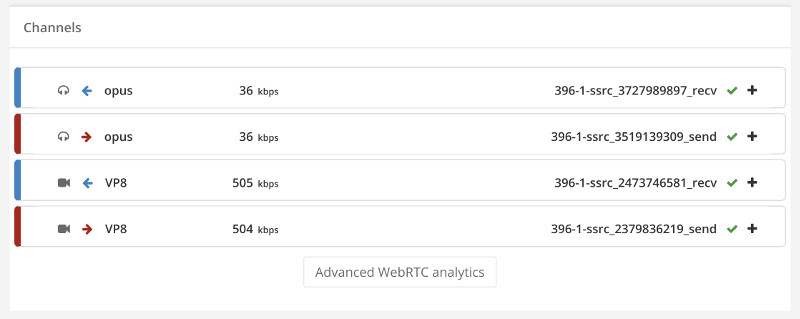
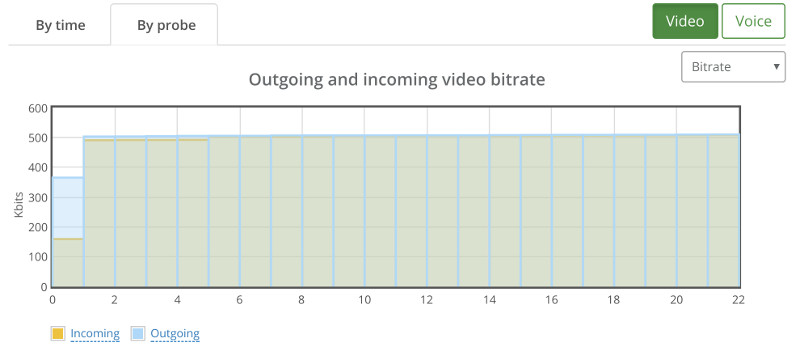
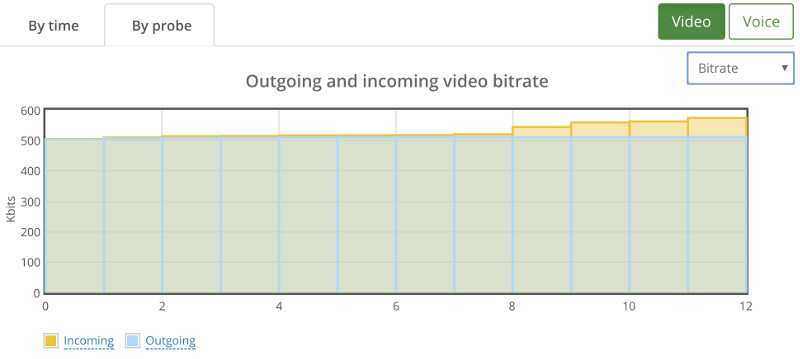
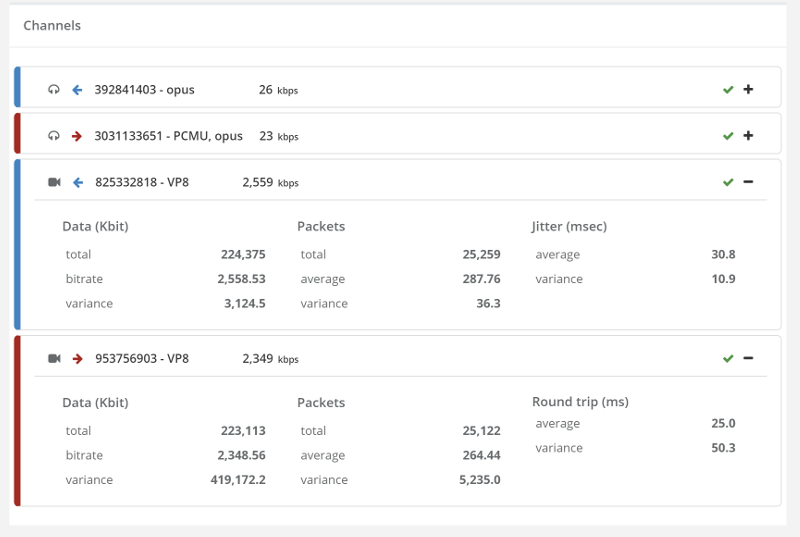
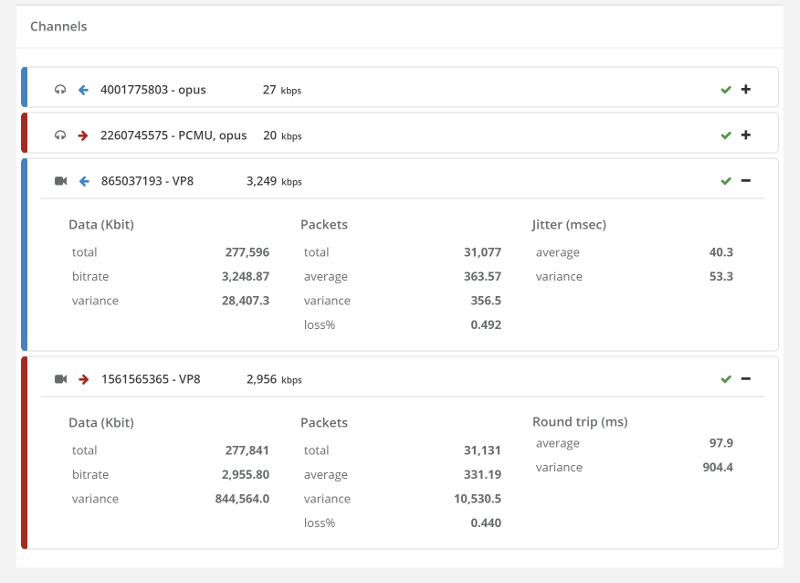
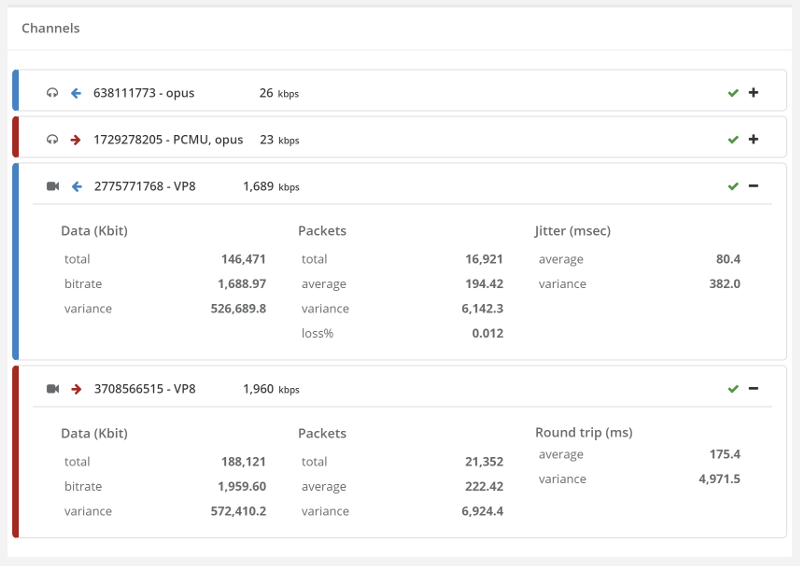
And here’s the stats on the channels of one of the two probes in this baseline test run:

Now that we have our baseline, it was time to scale things up.

30 Probes (=15 sessions)

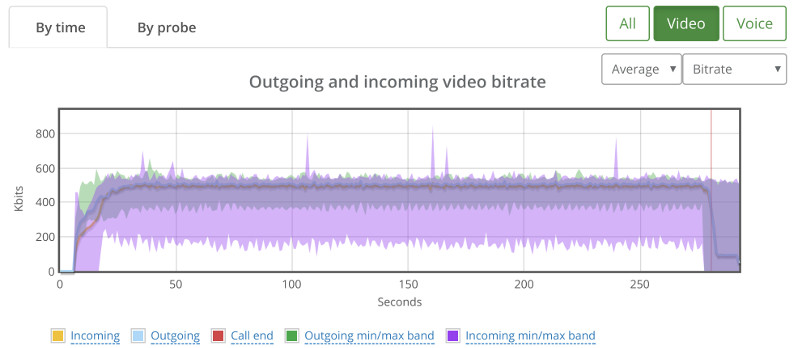
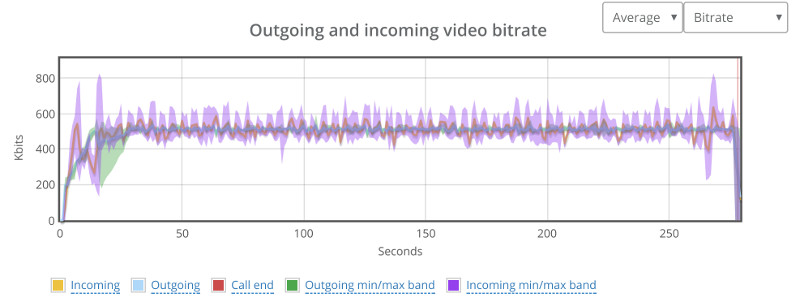
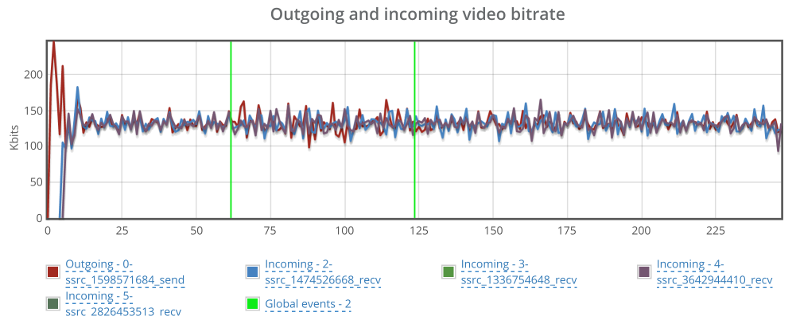
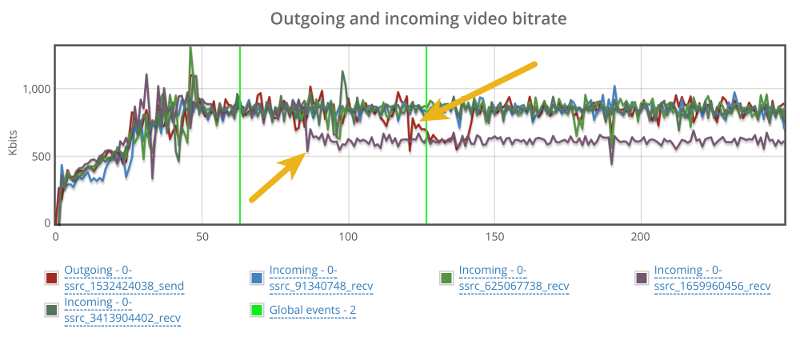
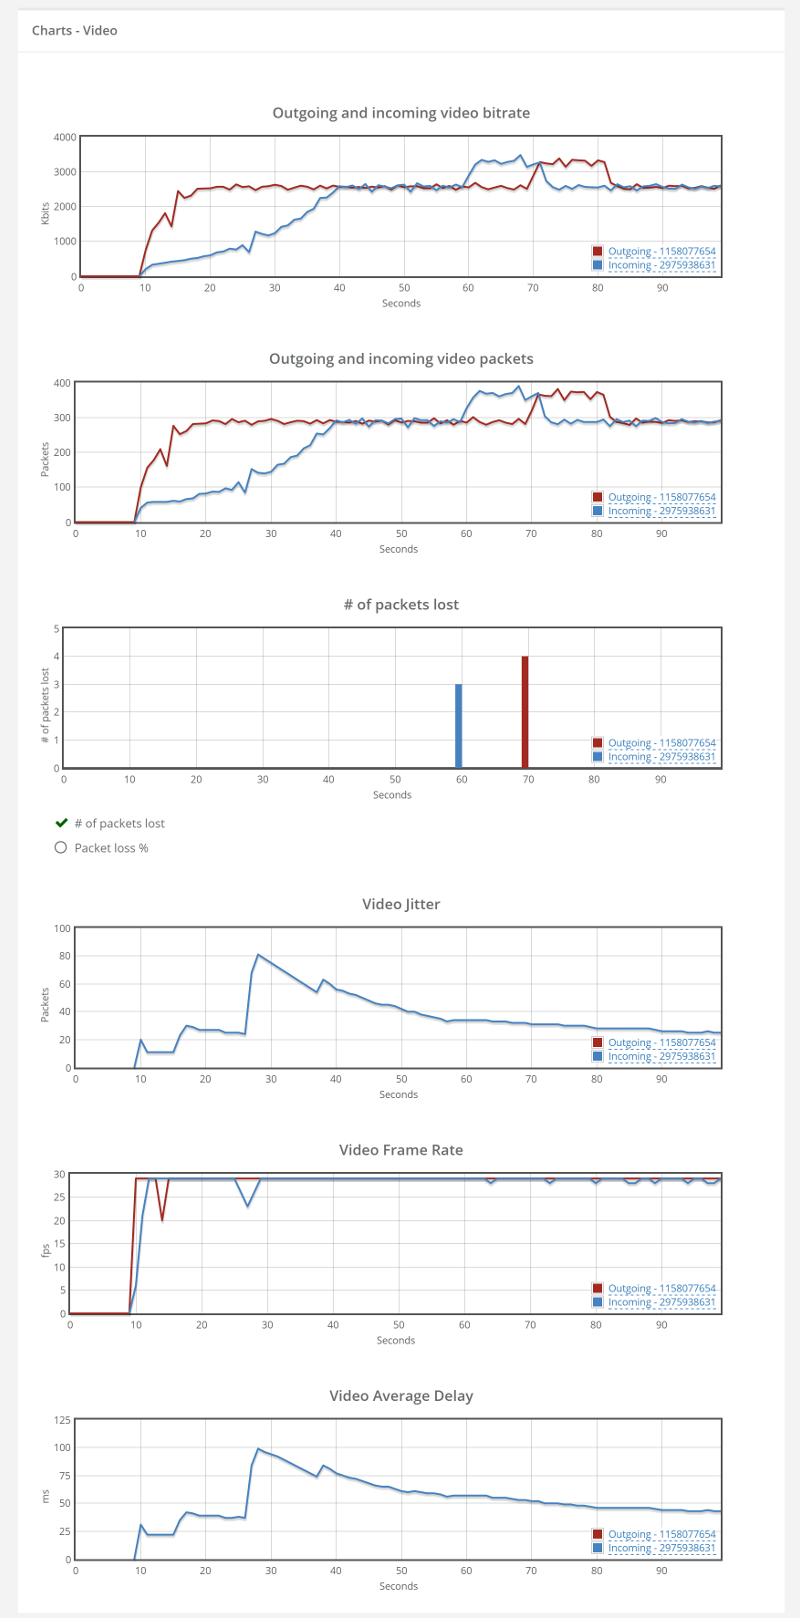
When we went up to 30 probes, running in 15 parallel 1:1 video sessions, we ended up with this graph:

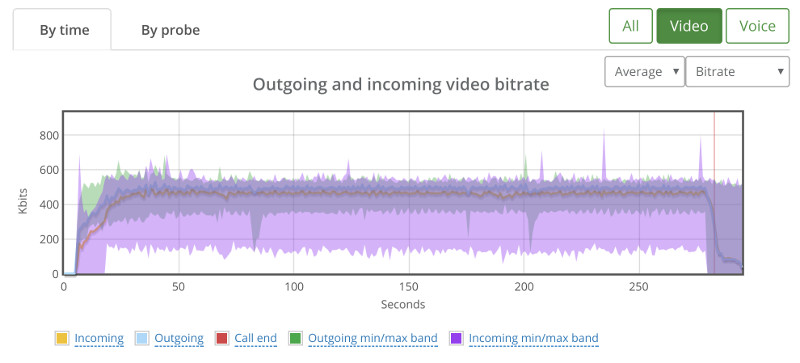
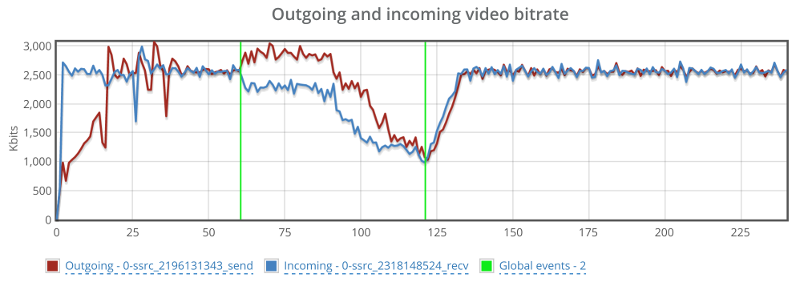
While the average bitrate is still around 500kbps, we can see that the min/max bands are not as stable.

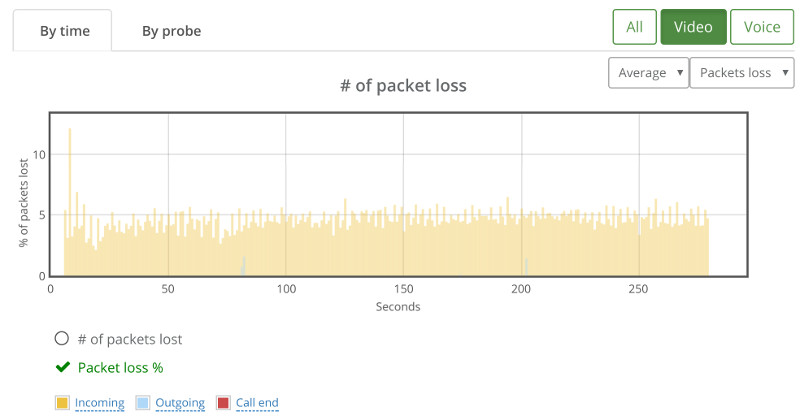
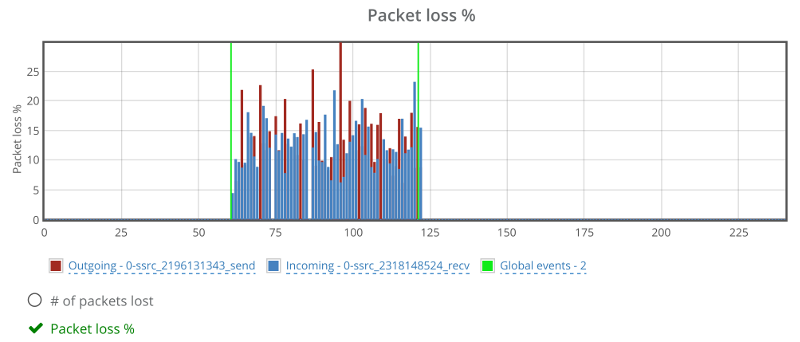
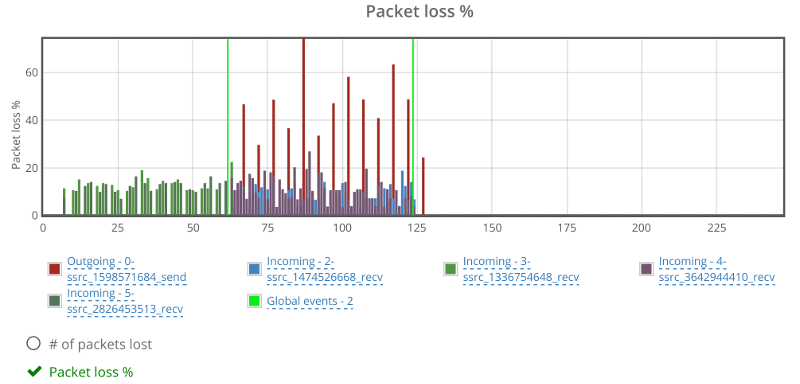
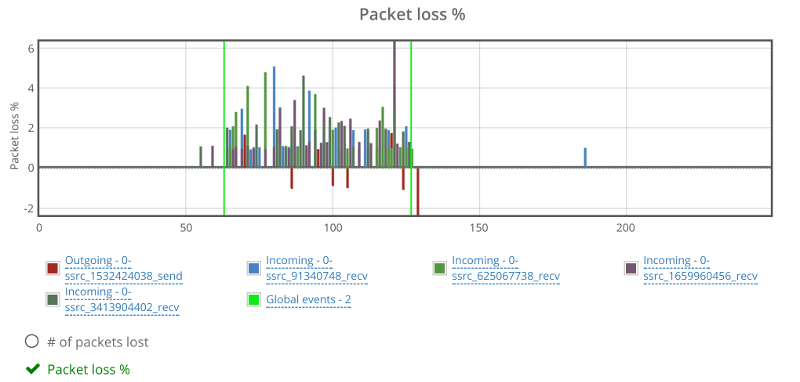
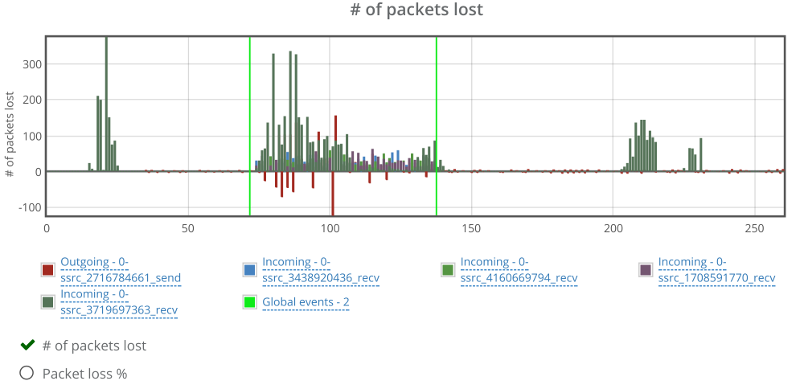
If we look at the packet loss graph, things aren’t happy (the baseline had no packet losses):

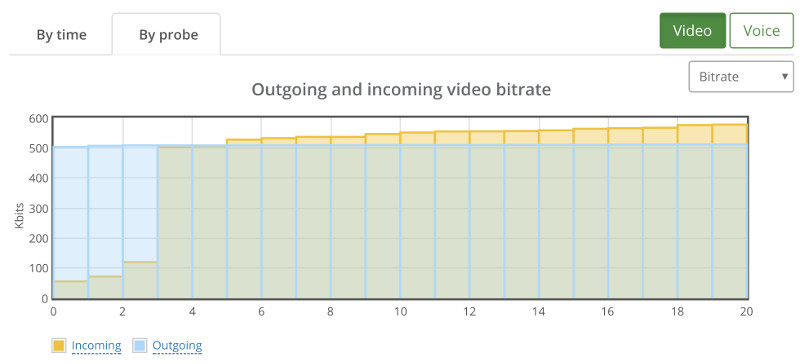
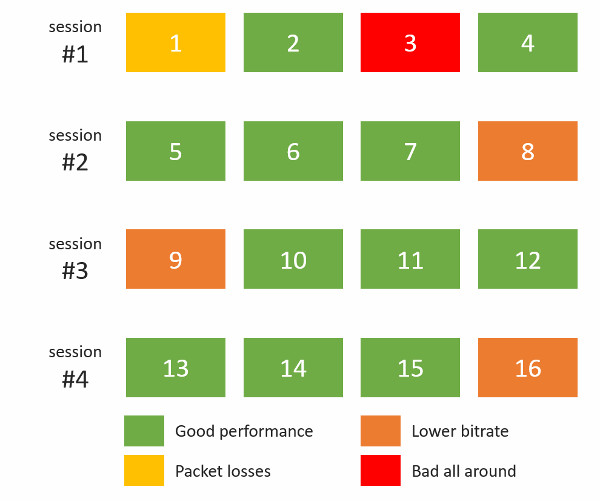
This is where we went for the “By probe” tab, looking at individual bitrates across the probes:

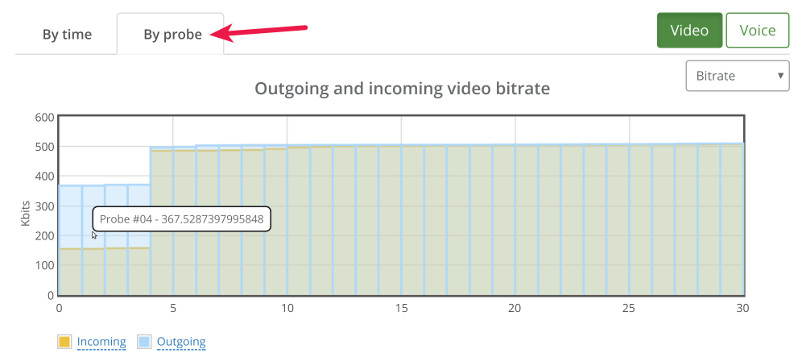
What we can see immediately is that 4 probes out of 30 didn’t get the full attention of the Kurento media server – they got to send and receive less than 500kbps.

If we switch to the packet loss by probe, we see this:

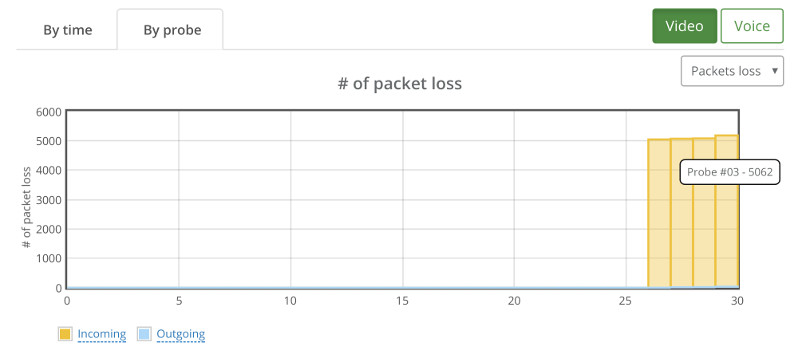
A couple of things that come to mind:

  1. Kurento degrades quality to specific sessions and not across the board. Out of 30 users, 22 got the expected results, 4 had lower bitrates and another 4 had packet losses
  2. There’s correlation here. When Probe #04 exhibits reduction in bitrate, Probe #3 reports incoming packet losses

From here, we can easily go down the path of drilling down to the probes that showed issues. I won’t do it now, as there’s still a lot to cover.

22 Probes (=11 sessions)

It stands to reason then that lowering the capacity to 22 probes should give us pristine results.

Here’s what we’ve seen instead:

We still have that one session that goes bad.

20 or 18?

When we went down to 18 or 20 probes, things got better.

With 20 the issue is that we couldn’t really reproduce a good result at all times. Sometimes, the scenario worked, and other times, it looked like the issues we’ve seen with the 22 probes.

18 though seemed rather stable when tested a couple of times:

Depending on the service you’re offering, I’d pick 18. Or even go down to 16…

4-Way Group Video Calls

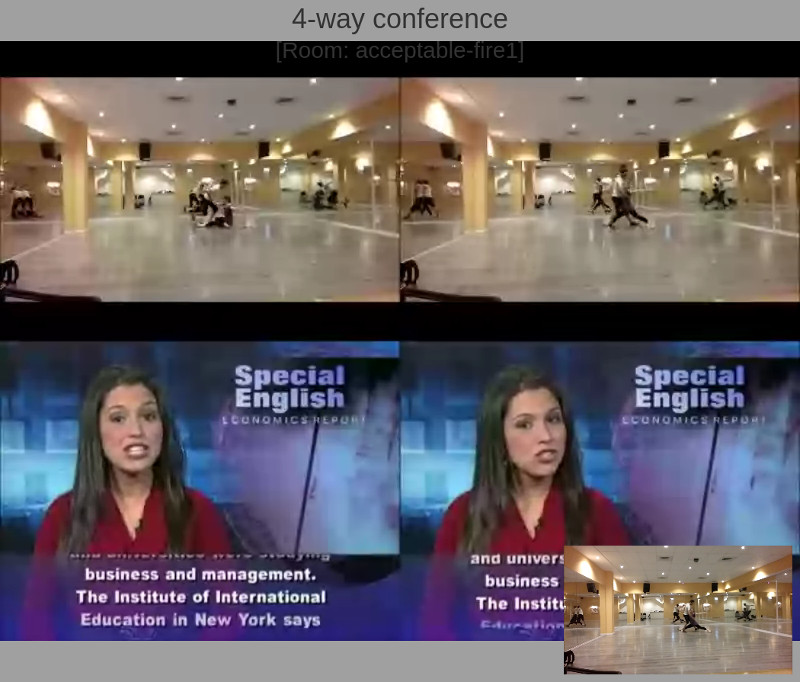
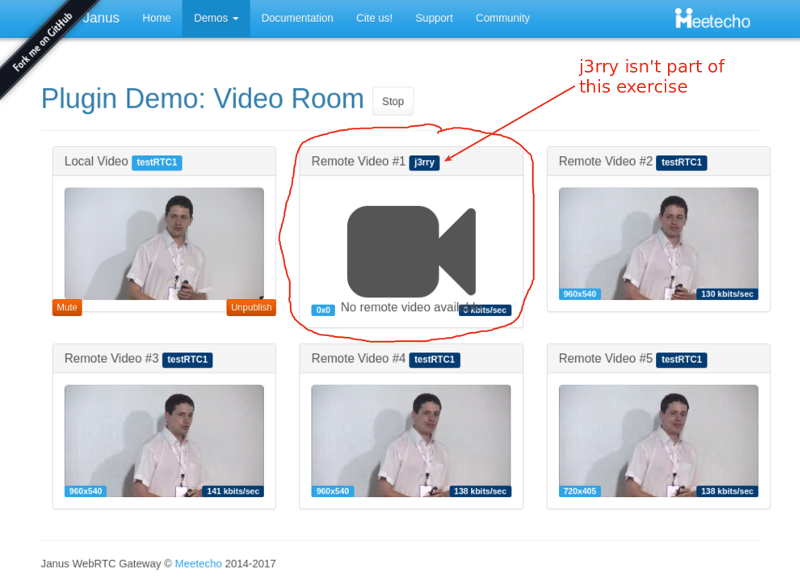
The above is a screen capture of the 4-way group video call scenario we’ve analyzed.

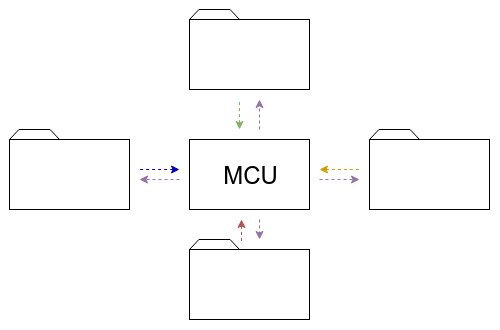
In this case, each probe (browser) sends out video at a resolution of 640×360 and receives a video resolution of 800×600.

The screenshot doesn’t show the images getting cropped, so we can assume the Kurento media server takes the following approach to its pipeline:

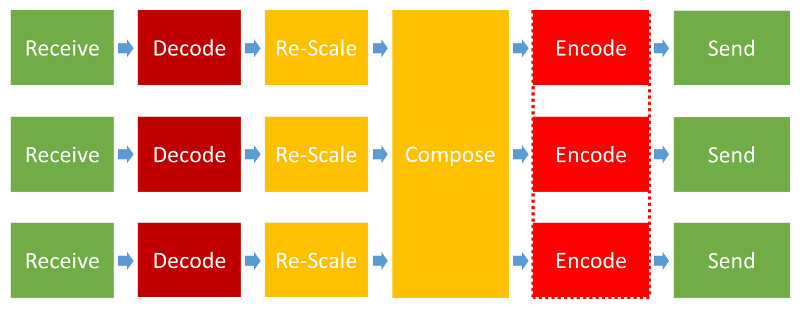
That’s lots of processing needed for each probe added, which means we can expect lower scaling for this scenario.

Baseline

Our baseline this time is going to need 4 probes.

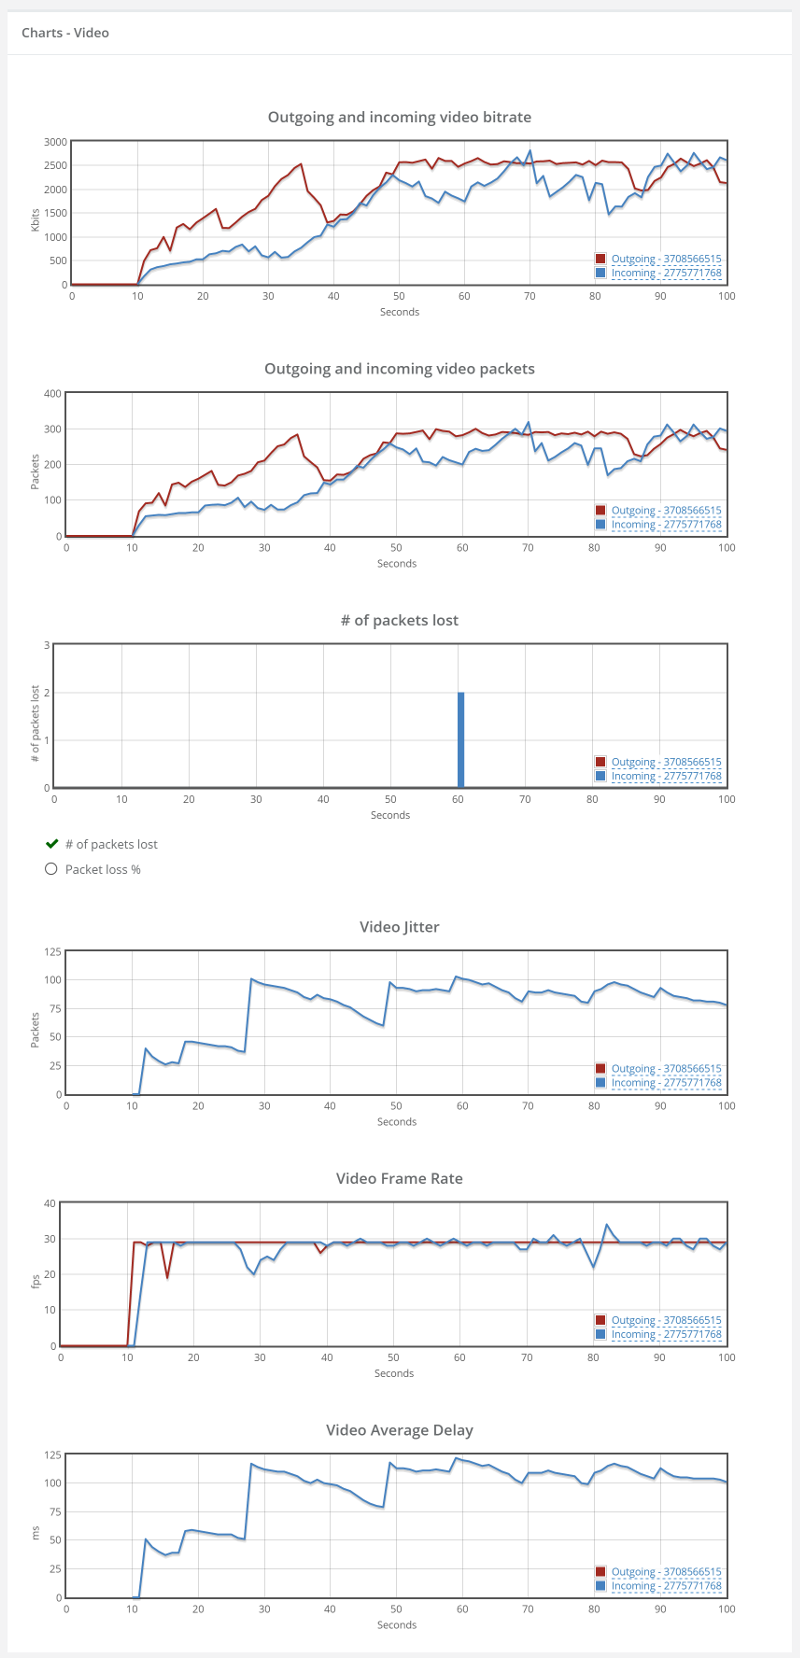
Here’s high the high level video graph looks like:

Not as stable as our 1:1 video calls, but it should do for what’s coming.

Note that each probe still has around 500kbps of video bitrate.

I’ll skip the drill down into the results of a specific probe metrics and take this as our baseline.

20 Probes (=5 sessions)

Since 1:1 video sessions didn’t go well above 20, we started there and went down.

Here’s how 20 probes look like:

Erratic.

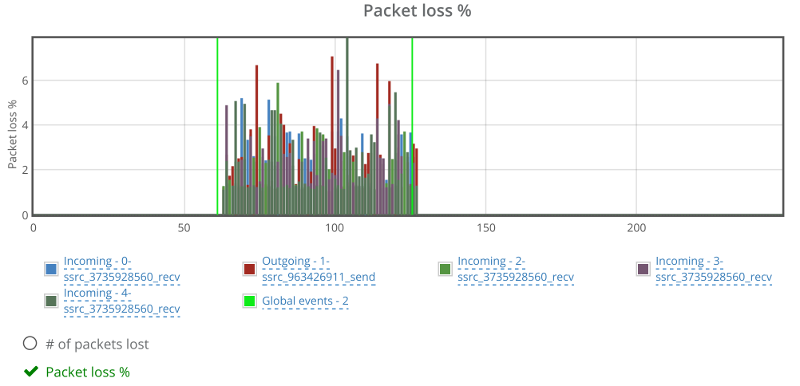
Checking packet losses and bitrates by probe yielded similar results to the bad 1:1 sessions. Here’s the by probe bitrate graph:

Going down to 16 probes (=4 sessions) wasn’t any better:

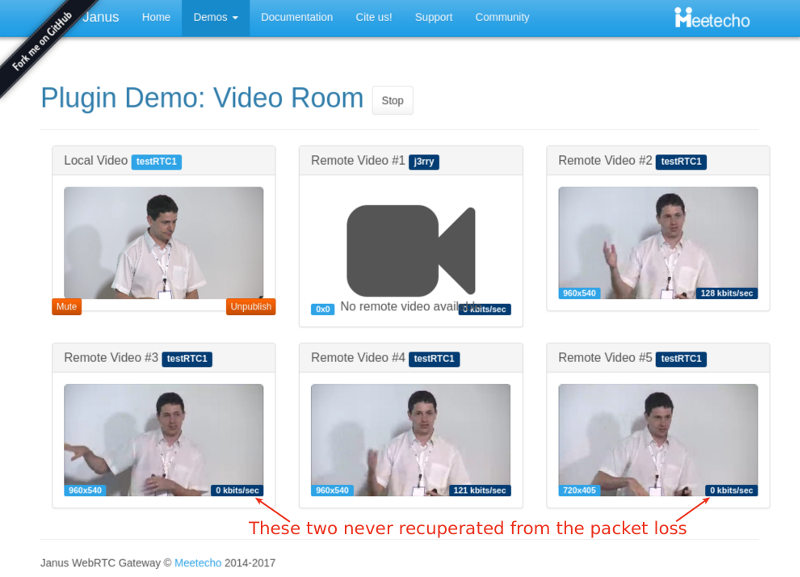
I’ve actually looked at the bitrates and packet losses by probe, and then decided to map them out into the sessions we had:

This paints a rather grim picture – all 4 sessions hosted on the Kurento server suffered in one way or another. Somehow, the bad behavior wasn’t limited to one session, but showed itself on all of them.

Down to 12 Probes (=3 sessions)

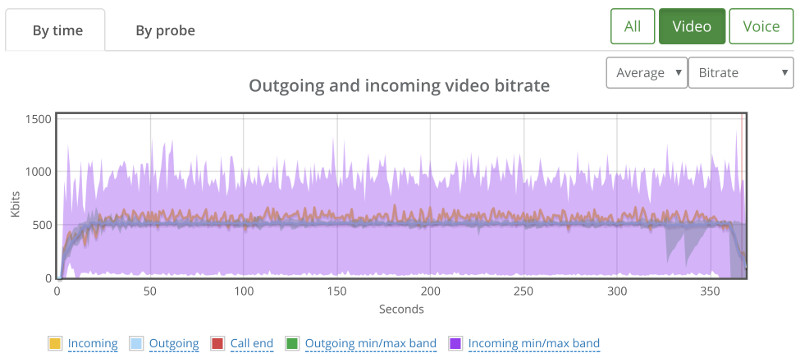
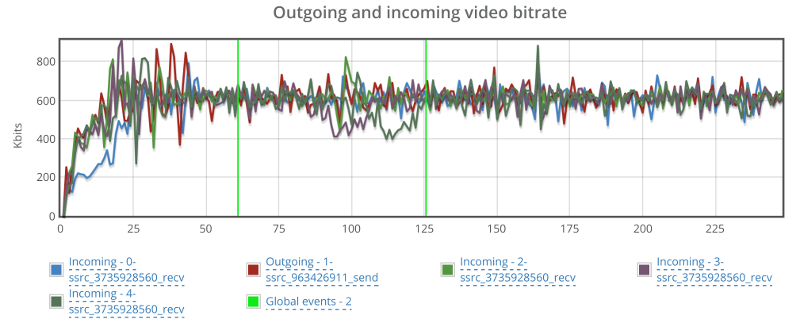
We ended up with 12 probes showing this high level bitrate graph:

It showed some sporadic packet losses that were spread across 3 different probes. The following shows the high level by probe bitrate graph:

There’s some instability in the bitrates and the packet losses which will need some further investigation, but this is probably something we can work with and try and optimize our service to run well.

Live Broadcast

The above screenshot shows what a viewer sees on a live broadcast scenario that we’ve set up using Kurento.

We’ve got multiple testRTC probes joining the same broadcast, with the first one acting as the broadcaster and the rest are just viewers.

Baseline

Our baseline this time is going to need 2 probes. A broadcaster and a viewer.

From now on, we’ll be focusing on what the viewers experience – a lot more than what happens to the broadcaster.

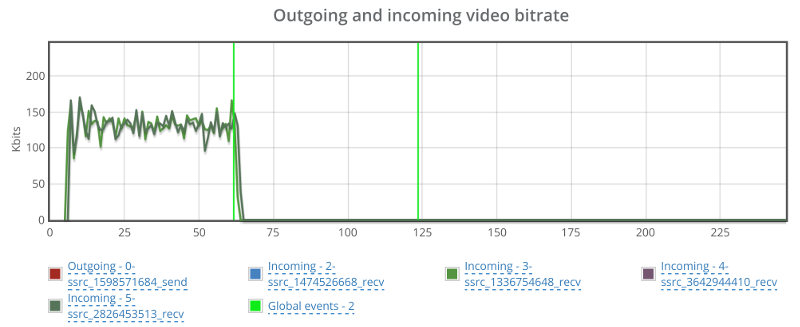
We’re still in the domain of 500kbps for the video channel:

One thing to remember here – outgoing media happens only for our broadcaster probe and incoming media happens for all the other probes.

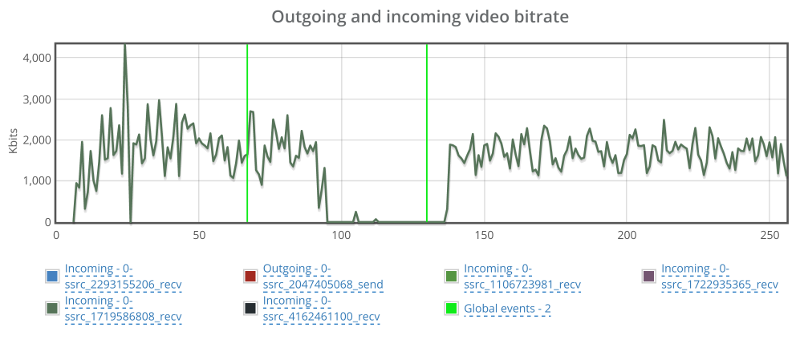
30 Probe (=29 viewers)

We started with 30 probes – assuming we will fail miserably based on our previous tests, and got positively surprised:

Solid bitrate for this test.

Climbing up

We’ve then started moving up with the numbers.

50, 60 and 80 probes went really well.

Got our appetite, and jumped towards 150 probes.

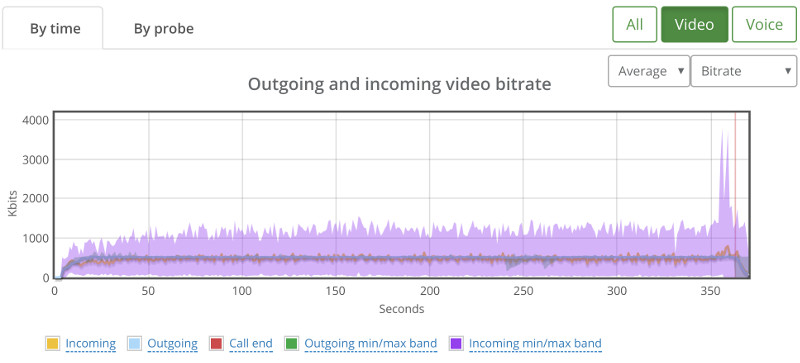
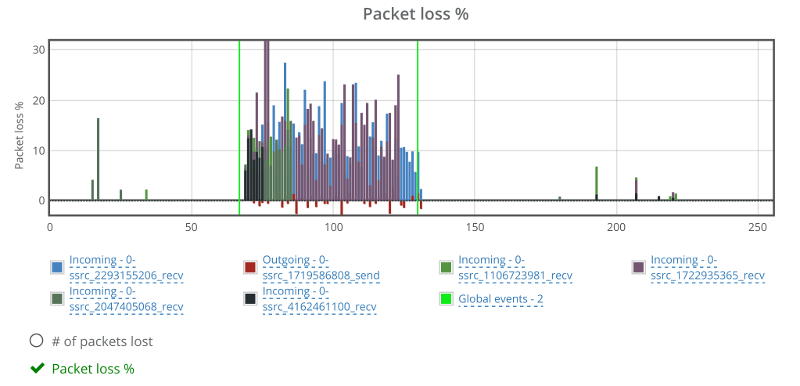
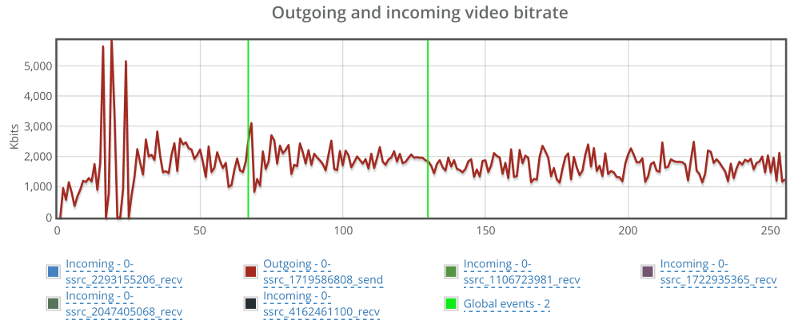
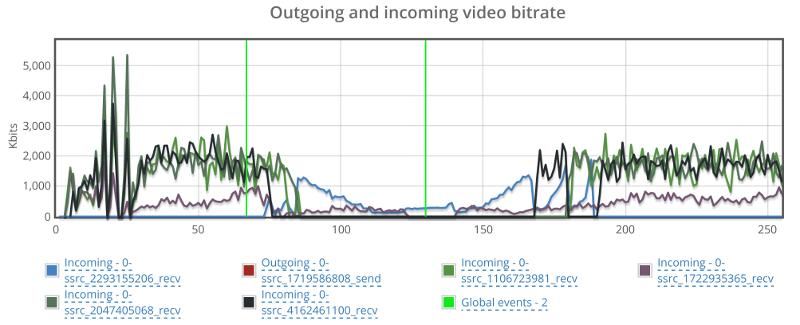
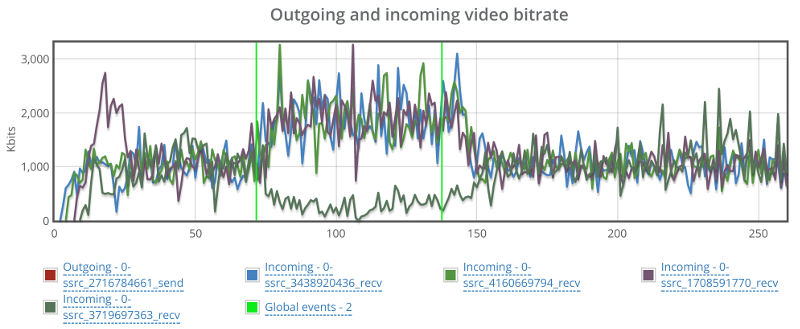
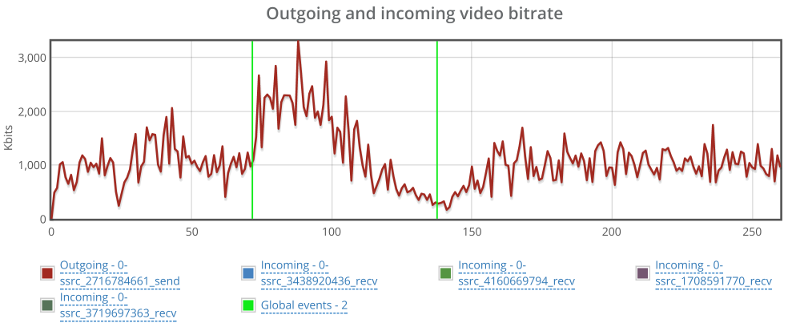
And ended up with this high level graph:

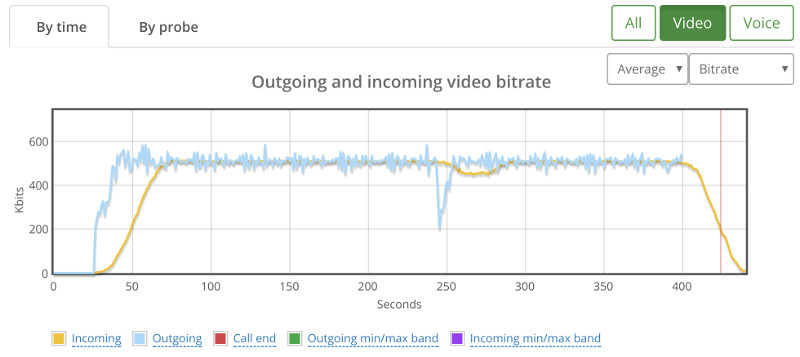
There wasn’t any packet loss to indicate why that drop with the broadcaster at around 240 seconds, so I switch to the “By probe” view.

This showed that things were starting to deteriorate somewhat:

We’re sorting the results just for this purpose – you can see there’s a slight decline in average bitrate across the probes here – something that is a lot less apparent for smaller test sizes. There was no packet loss.

We’ve tried going upwards to 200, but then 12 probes didn’t even connect properly:

Going down to a 100 yielded some connection errors in some of the probes as well. Specifically, I saw this one:

This indicates we’ve got a wee bit of an issue here that needs to be solved before we can continue our stress tests any further. Most probably in the signaling layer of our server. It is either unstable when we place so many viewers at once against it, or just doesn’t really handle the load well enough.

Results Summary

The table below shows the various limits we’ve reached in our rounds of sizing tests:

Scenario Size
1:1 video calls 18 users in 9 parallel sessions
4-way group video calls 3 rooms of 4 users each
Live broadcast 1 broadcaster + 80-150 viewers

What did we learn?

  1. Stress testing for sizing purposes is fun. I actually enjoyed going through the results and running a couple of tests of my own (I didn’t write the scripts or run the initial tests – I delegated that to our support engineer)
  2. Different scenarios will dictate very different sizing. With more time, I’d start working out on finding the bottlenecks and optimizing them – I’m sure more can be squeezed out of a Kurento machine
  3. Once set up and written intelligently, it’s really easy to rerun the tests and change the number of probes used

Next Steps

Once we got to the sweet spot in each scenario, the next thing to do would probably to run it more than once.

We usually setup a testRTC monitor to run once every 15 minutes to an hour for a couple of days on such a scenario, just to make sure we’re seeing stable results more than once.

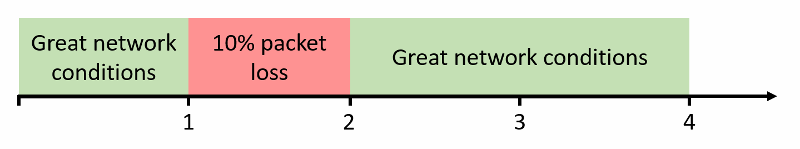
Other than that, this needs to be tested under different network conditions, varying load factors, etc.

Check out our best practices for stress testing WebRTC applications. It is relevant even if you are not using testRTC

Get the best practices guide

I’d like to thank WebRTC.ventures for the assistance in setting this one up. If you are looking for a capable vendor to custom build your WebRTC application – check them out.

1

How to Prepare Your WebRTC Application for a Surge in Traffic

OK, this is the moment you’ve been waiting for: there’s a huge surge in traffic on your WebRTC application. Success! You even had the prescience to place all of your web application’s assets on a CDN and whatever uptime monitoring service you use, be it New Relic, Datadog or a homegrown Nagios solution – says all is fine. But there’s just one nagging problem – users are complaining. More than they used to. Either because the service doesn’t work at all for them or the quality of the media just doesn’t cut it for them. What The–?!

We recently hosted a webinar about preparing for that big WebRTC launch. You might want to check the suggestions we made there as well.

Register now for free: WebRTC – How NOT to Fail in Your Big Launch

Let’s start by focusing on the positives here. Your service is being used be people. Then again, these people aren’t getting the real deal – the quality they are experiencing isn’t top notch. What they are experiencing is inability to join sessions, low bitrates or inexplicable packet losses. These are different than your run of the mill 500 and 502 errors, and you might not even notice something is wrong until a user complains.

So, what now?

Here’s what I’m going to cover today:

  1. Learn how to predict service hiccups
  2. Prepare your WebRTC application in advance for growth

Learn How to Predict Service Hiccups

While lots of users is probably what you are aiming for in your business, the effects they can have on your WebRTC application if unprepared for it can be devastating. Sure, sometimes they’ll force your service to go offline completely, but in many other times, the service will keep on running but it will deliver bad user experience. This can manifest itself by having users wait for long times to connect, requiring them to refresh the page to connect or just having poor audio and video quality.

Once you get to that point, it is hard to know what to do:

  • Do you throw more machines on the problem?
  • Do you need to check your network connections?
  • How do you find the affected users and tell them things have been sorted out?

This mess is going to take up a lot of your time and attention to resolve.

Here is something you can do to try and predict when these hiccups are about to hit you:

Establish a Baseline

I’ve said it before and I’ll say it again. You need to understand the performance metrics of your WebRTC service. In order to do that, the best thing is to run it a bit with the acceptable load that you have and writing down for yourself the important metrics.

A few that come to mind:

  • Bitrate of the channels
  • Average packet loss
  • Jitter

Now that you have your baseline, take the time to gauge what exactly your WebRTC application is capable of doing in terms of traffic. How much load can it carry as you stack up more users?

One neat trick you can do is place a testRTC monitor and use rtcSetTestExpectation() to indicate the thresholds you’ve selected for your baseline. Things like “I don’t expect more than 0.5% packet loss on average” or “average bitrate must be above 500kbps”. The moment these thresholds are breached – you’ll get notified and able to see if this is caused by growth in your traffic, changes in usage behavior, etc.

Prepare Your WebRTC Application in Advance for Growth

There aren’t always warning signs that let you know when a rampaging horde of users may come at your door. And even when there is, you better have some kind of a solution in place and be prepared to react. This preparation can be just knowing your numbers and have a resolution plan in place that you can roll out or it can be an automated solution that doesn’t require any additional effort on your end.

To get there, here are some suggestions I have for you.

Find Your System’s Limits

In general, there are 3 main limits to look at:

  1. How big can a single session grow?
  2. How many users can I cram into a single server?
  3. How many users can my service serve concurrently?

You can read more on strategies and planning for stress testing and sizing WebRTC services. I want to briefly touch these limits though.

1. How big can a single session grow?

Being able to handle 500 1:1 sessions doesn’t always scale to 100 groups of 10 users sessions. The growth isn’t linear in nature. On top of it, the end result might choke your server or just provide bitrates that are just too low above a certain number of users.

Make sure you know what’s the biggest session size you are willing to run.

Besides doing automated testing and checking the metrics against the baseline you want, you can always run an automated test using testRTC and at the same time join from your own browser to get a real feeling of what’s going on. Doing that will add the human factor into the mix.

2. How many users can I cram into a single server?

Most sizing testing are about understanding how many sessions/users/whatever can you fit in a single server. Once you hit that number, you should probably launch another server and use a load balancer to scale out.

Getting that number figured out based on your specific scenario and infrastructure is important.

3. How many users can my service serve concurrently?

Now that you know how to scale out from a single server, growing can be thought of as linearly (up to a point). So it is probably time to put in place automatic scale out and scale down and test that this thing works nicely.

Doing so will greatly reduce the potential and destruction that a service hiccup can cause.

CDN and Caching

Make sure all of the HTML assets of your WebRTC application that static are served through a CDN.

In some cases, when we stress test services, just putting 200 browsers in front of an HTML page that serves a WebRTC application can cause intermittent failures in loading the pages. That’s because the web serving part of the application is often neglected by WebRTC developers who are focusing their time and energy on the bigger resource hogs.

We’ve had numerous cases where the first roadblock we’ve hit with a customer was him forgetting to place a minor javascript file in the CDN.

Don’t be that person.

Geographically Distributed Deployment

The web and WebRTC are global, but traffic is local.

You don’t want to send users to the other side of the globe unnecessarily in your service. You want your media and NAT traversal servers to be as close to the users as possible. This gives you the flexibility of optimizing the backend network when needed.

Make sure your deployment is distributed along multiple datacenters, and that the users are routed to the correct one.

Philipp Hancke wrote how they do it at appear.in for their TURN servers.

Monitor Everything

CPU. Memory. Storage. Network. The works.

Add application metrics you collect from your servers on top of it.

And then add a testRTC monitor to check media quality end-to-end to make sure everything run consistently.

Check across large time spans if there’s an improvement or degradation of your service quality.

Stress Testing

Check your system for the load you expect to be able to handle.

Do it whenever you upgrade pieces of your backend, as minor changes there may cause large changes in performance.

Don’t Let Things Out of Your Control

WebRTC has a lot of moving parts in it so deploying it isn’t as easy as putting up a WordPress site. You should be prepared for that surge in traffic, and that means:

  1. Understanding the baseline quality of your service
  2. Knowing where you stand with your sizing and scale out strategy
  3. Monitoring your service quality so you can react before customers start complaining

Do it on your own. Use testRTC. Use whatever other tool there is at your disposal.

Just make sure you take this seriously.

We recently hosted a webinar about preparing for that big WebRTC launch. You might want to check the suggestions we made there as well.

Register now for free: WebRTC – How NOT to Fail in Your Big Launch

11

How do WebRTC Media Servers Behave on Packet Loss?

Differently from each other.

Whenever I see people comparing WebRTC media servers, they tend to focus on scale:

– How many sessions can you cram in parallel?

– How many streams can you serve from a single machine?

– How much bitrate can you pump out?

All of these are very important questions – they end up in your sizing calculation that then go into your pricing model for your service. Oh, and we did cover this a bit here when talking about handling WebRTC browsers synchronization at scale.

Now that our new version is taking shape (still in staging, so if you want access – ping us), it is time to play a bit with a few new toys we’ve added for our beloved community of sadists (you may know them as test engineers, but the good ones are sadists – they like inflicting pain upon digital products and services).

What I am talking about here is a combination of two script commands we have:

  1. rtcEvent() – place a vertical event in the graphs
  2. rtcSetNetworkProfile() – change network profiles in runtime

You’ll see how it looks in a second.

What Packet Loss Does?

Packet loss is bad.

You don’t control it. And it can happen at any time. Come and go as it pleases.

The moment you have packet loss, there will be some degradation in the quality of the media. Lost packets means lost data. Means can’t playback something. It might be minor. It might be important.

Next thing that happens? WebRTC (or most other VoIP products for that matter) will start lowering bitrates. Why? Because it assumes there’s congestion on the network, and it is trying to play nice with everyone.

But what happens once that packet loss is gone? Does things go back to normal? And if they do, then how fast will that happen?

My Experiment

I decided to devise a simple enough experiment to get some answers here. I chose the following steps:

  1. Connect to a service
  2. Run for a full minute
  3. Set packet loss to 10% for a full minute
  4. Go back to normal – no packet loss
  5. Wait two minutes

That’s it. What I am interested in is less of what happens during the second minute, but more what happens in the last two minutes, and how that is different than what we have in the first minute of the session.

In general, I decided to place 5 users in the same session, to get that media server working a bit. And I also decided to focus on the SFU kind.

The services I tinkered with are:

  1. AppRTC, just as a baseline for this exercise
  2. Janus, an open source media framework, that can act as an SFU
  3. Jitsi Videobridge, an open source SFU
  4. mediasoup, a relatively new open source SFU
  5. SwitchRTC, a commercial SFU
  6. appear.in, a service that recently added its own self-developed SFU (in beta at the moment)

If you are looking for Kurento or other SFUs – they weren’t included not because I didn’t want to, but because there was no readily available installation out there that I could just use.

I’ll be happy to add more SFUs to the comparison, so give us a shout out if you want to run such an analysis.

Let the fun begin.

AppRTC – My Favorite Baseline

For our baseline, I decide to use AppRTC.

This time, I had to use only 2 browsers, as AppRTC doesn’t support any group calling capabilities.

What it does do is offer the vinyl WebRTC experience.

I started with writing a simple script to fit my needs:

var roomUrl = process.env.RTC_SERVICE_URL + "testRTC" + process.env.RTC_SESSION_IDX + '?vsc=VP8';

var agentType = Number(process.env.RTC_IN_SESSION_ID);
var recuperationTime = 60; // in seconds

client
   .rtcInfo(roomUrl)
   .rtcProgress('open ' + roomUrl)
   .url(roomUrl)
   .waitForElementVisible('body', 60000)
   .pause(2000)
   .click('#confirm-join-button')
   .waitForElementVisible('#videos', 20000)
// Minute 1
   .pause(recuperationTime * 500)
   .rtcScreenshot('Phase 1')
   .rtcProgress('Phase 1')
   .pause(recuperationTime * 500);

// Minute 2
   if (agentType === 1) {
   client
       .rtcEvent('10% Packet Loss start', 'global')
           .rtcSetNetworkProfile('custom', 'packet loss', 10, 'both', 'both'); // 10% packet loss
   }

client
   .pause(recuperationTime * 500)
   .rtcScreenshot('Phase 2')
   .rtcProgress('Phase 2')
   .pause(recuperationTime * 500)

   if (agentType === 1) {
    client
       .rtcSetNetworkProfile('') // back to pristine network conditions
       .rtcEvent('10% Packet Loss End', 'global');
   }

// Minute 3-4
client
   .pause(recuperationTime * 1000)
   .rtcScreenshot('Phase 3')
   .rtcProgress('Phase 3')
   .pause(recuperationTime * 1000);

A few things to note here:

  1. All test scripts on this post can be found on our github account. Easiest way to use them is to import them into your testRTC account
  2. I decided to force VP8 here. VP9 is erratic a bit in its bitrate so I wanted to go for VP8 – hence the addition of ‘?vsc=VP8’ in the first line of this script (check out all of AppRTC’s parameters here)
  3. When the second minute is up, the first probe in each session will generate a global rtcEvent and set packet loss in both directions to 10% (look at lines 23-27)
  4. After an additional second is over, the first probe in each session will generate another global rtcEvent and remove all packet loss and network constraints that might have been used (look at lines 35-39)

Running that using testRTC yields these results once you drill into one of these sessions:

Above you see two things:

  1. The green vertical lines – these are the result of the rtcEvent() calls
  2. The blue and red bars, showing incoming and outgoing packet loss percentage, which averages at 10%

Above you see the video bitrate graph, with the two horizontal lines on it.

Notice how the outgoing bitrate tries going up in the beginning and then drops from 2.5mbps to 1mbps in 60 seconds?

The other thing that interest me is the time it takes for WebRTC/AppRTC to get back to 2.5mbps. And that’s somewhere in the range of 15-20 seconds.

Oh, and because I know you’ll be interested in this – also remember this screenshot of the video average delay we had:

Before we move on to the media servers – remember that what I tried doing with AppRTC is provide a baseline. And the baseline here is “picture perfect”. I didn’t really expect any of the SFUs that I’ve used to be able to match AppRTC with its metrics.

Janus

Janus is an open source media server created and maintained by Meetecho.

They have an online demo running that supports a simple video room.

So we just hooked our script on top of that to get the results we needed. We aimed for 5 browsers in a single room – which will be the norm from now on in this article.

The Janus demo has somewhat of a single room, and I had to end up with a J3rry user in there, though he seemed harmless with no camera or bitrate in my session.

You can see above that the bitrates are rather low – around 140 kbps for each video stream coming into this room. And that’s even before I started adding packet loss.

During packet loss and after it, we “lost” two participants. Here’s a screenshot taken a minute after I stopped packet loss altogether:

The graphs in testRTC show a grim picture:

Janus reports packet losses at higher intervals than what WebRTC does, which is why we see the spikes on the outgoing reporting that go up to 50% and more. The weird thing is the two incoming channels that show around 10% of packet loss as well. Which is weird – more about this later.

Here’s how video bitrates look like for some of the streams (one outgoing and two incoming):

No change even though we have packet loss.

And here’s what happens in the two other incoming streams:

Apparently, these two incoming streams are the ones showing packet loss from the start. They somehow decided to drop to 0 the moment we cranked up the artificial packet loss from 0 to 10% – but never recuperated from it.

Looking at the average delay for the video…

Things can’t be good, but seems like this has nothing to do with my packet loss shenanigans.

It might be Janus and it might just be the demo machine. If I could, I’d reboot it and start all over again.

Jitsi

For me the Jitsi Videobridge is where I go first to run demos and tests on an SFU with testRTC:

  • It is out there
  • It is easy to automate
  • And I am a creature of habit…

To run our test here, we’ve directed 5 of our probes into a single room on the Jitsi meet online service/demo.

After a few attempts, I decided it would be better to disable simulcast, using this prefix to the URL: ‘#config.disableSimulcast=true’. I didn’t do it because simulcast is a bad thing, but because it made analyzing the results much harder for what I had in mind.

If we look at the packet loss graph, it will tell a similar story to what we’ve seen so far:

While there are some packet losses out of the one minute killzone I created, they are negligible (or at least sporadic). That negative values you see for packet losses in the red color? They are reports of the browser’s outgoing stream from the machine we induced packet loss on. This is most probably related to a Chrome bug (HT to Philipp Hancke).

I’ve split the video bitrate graphs here into two graphs – the outgoing one and the incoming ones since they tell two separate stories.

This one caught me by surprise – the outgoing bitrate shows no signs of a change due to packet loss. I wonder what Jitsi is doing (or not doing) to have packet loss ignored in such a way. So I decided to look at it from the receiving end of one of the other four browsers in the same session:

Bitrate drops to 0 for a duration of almost a full minute before coming back up.

Back to the browser with the trashed network, let’s see what happens to the incoming video streams:

Things drop down from around 2mbps to almost 0 on all incoming channels, taking around 40-60 seconds to get back to normal.

One last glance before we move on – check out video average delay:

Jitsi had some hard time recuperating from that packet loss.

It should be noted that I’ve played around with Jitsi before their recent updates – especially the ones including adaptivity.

Mediasoup

mediasoup is a rather new player in the open source SFU space. It is built in C++ as a Node.js module. After a quick Twitter chat, Iñaki Baz Castillo was kind enough to configure it to my needs (specifically, allowing for more bandwidth on the online demo).

Starting as always with packet loss:

The graph seems fine. Percentages are low because of the way packet losses are reported back from the media server. Probably some FEC / retransmissions are involved as well (this would be the case with many of the media servers out there).

Looking at the video bitrate, we see an interesting picture:

There’s a hiccup in the outgoing bitrate (the red line), but that for some reason takes place close to the end of the 60 seconds packet loss window.

There’s also a reduction in incoming bitrate for one of the video stream. It starts around 20 seconds into the packet loss zone, but it doesn’t recover even when we remove the packet losses.

Video delay is also a bit problematic:

It starts off nicely, goes up when packet losses start and never recuperates.

SwitchRTC

Moving on from open source to commercial, there’s SwitchRTC.

It started by me asking for a 2mbps bitrate limit. Now, the way this was set up and without simulcast, it meant the browser is going to need to encode 2mbps and decode 4 streams of 2mbps each. This turned out to be a bit too much for the way we configure our machines (and frankly – probably too much for almost any use case you plan on deploying when it comes to assuming what your typical customer may have).

The end result of it was graphs that went all over the place – each stream and each browser tried hard to compete on resources that were limited, and it wasn’t really nice.

So we dialed back down to 1mbps bitrate limit.

As always, let’s first look at the packet loss graph:

Two things here to note:

  1. One of the incoming video streams has packet losses outside the packet loss zone. Not unheard of, but a bit off the charges compared to others. I think that is due to the data centers used by SwitchRTC for this demo
  2. There’s negative packet losses on the outgoing video stream. This is due to the way SwitchRTC handles packet loss reporting (or more likely filtering packet loss reporting)

For bitrate, I took two screenshots. One for the incoming video streams and one for the outgoing video stream.

On the incoming stream we see an interesting phenomena.

When packet loss starts, bitrate picks up, most likely to overcome the packet loss. It makes sense, since we didn’t limit bitrates, so that seems like the correct strategy. Would be interesting to see what will happen if we limit bitrate as well.

The second thing, is that we have one of the incoming stream dropping down to almost zero and then picking up again. This is the same stream that shows high packet losses. I wonder what causes that.

The graph above shows the outgoing video stream. This is almost textbook behavior for the outgoing video. Once it notices there’s issues, it starts increasing bitrate to compensate, and when that fails – it drops down slowly. It is similar, though not as smooth as what you see with AppRTC.

appear.in

appear.in have a beta SFU, which Philipp Hancke was kind enough to let me use.

Now, appear.in isn’t a media server or a component you can use in your own service – it is a full service, which makes this comparison a bit unfair – checking demos and comparing them to a commercial service.

But then I wanted to check this one out, as it isn’t based on any external framework – it was self developed in house at appear.in

The results are interesting.

Packet loss graph looks rather nice, if a tad low in the percentage:

This shows how far appear.in goes in gauging and polishing the way they make use of network resources.

Video bitrate stays at the 600kbps vicinity – not showing any real effects from my additional packet loss:

Best part though is that the video delay graph doesn’t look erratic:

I am not sure how to compare these results to the rest. I will need more time to check this out – time that I just didn’t have available for this experiment of mine. I will leave it for some future tinkering.

Summing things up

Different media servers will act differently. Especially when putting them under different network conditions.

What I wanted to show here, is how you can use testRTC to goof around with whatever setting you want. Here are a few other ideas:

  1. Drop the network down to 0 bitrate. Wait a bit. Put it back up. Did media return? How quickly did it come up again?
  2. Limit bitrates to different levels. Check if your media server adapts things like resolutions and other interesting parameters to fit the needs
  3. Go down to 50 or 100 kbps. Does video persist or is the media server shutting it down in favor of audio?
  4. Limit bitrate and add a bit of packet loss at the same time (this would be closest to real life). See what happens then – how will the media server behave?
  5. Do the above while adding some load on the server. Does it start fidgeting or is it handling this nicely?

A few things to remember here:

This isn’t an apples to apples comparison

I haven’t taken each and every media server and installed it on my own on the same server configuration. I just used the online demos each of these vendors had. At times, asking for assistance and a bit of configuration from the vendor.

What was different:

  • The server(s) the media server was installed on
  • The configuration of the server, especially what max bitrate it allows

What was similar:

  • I tried disabling simulcast in all servers. Assume that’s a bad thing to do, but I wanted a level playing field on that front
  • The browser used. It was the same for all tests. This includes their version, the machine they were installed on, the network they used, their geographical location – everything
  • The scenario itself. I essentially executed the same scenario over and over again in front of different media servers

Where do we go from here?

Media servers are hard to develop. They are hard to tweak and optimize. And they are hard when it comes to making sizing decisions with them.

They are also pretty good. Most of the ones shown here are running in production services with live customers.

When you go tomorrow to pick the media server for your own project. Or when you want to plan how to size capacities per machine. Or if you want to check your media server in real life scenarios – we’ve got your back.

Check us out. I am sure we can be of help to you.

10

What happens when WebRTC shifts to TURN over TCP

You wouldn’t believe how TURN over TCP changes the behavior of WebRTC on the network.

I’ve written this on BlogGeek.me about the importance of using TURN and not relying on public IP addresses. What I didn’t cover in that article was how TURN over TCP changes the behavior we end up seeing on the network.

This is why I took the time to sit down with AppRTC (my usual go-to service for such examples), used a 1080p resolution camera input, configure my network around it using testRTC and check what happens in the final reports we get.

What I want to share here are 4 different network conditions:

Checking how TURN over TCP affects the network flow

#1 – A P2P Call with No Packet Loss

Let’s first figure out the baseline for this comparison. This is going to be AppRTC, 1:1 call, with no network impairments and no use of TURN whatsoever.

Oh – and I forced the use of VP8 on all calls while at it. We will focus on the video stats, because there’s a lot more data in them.

P2P; No packet loss; charts

Our outgoing bitrate is around 2.5Mbps while the incoming one is around 2.3Mbps – it has to do with the timing of how we calculate things in testRTC. With longer calls, it would average at 2.5Mbps in both directions.

Here’s how the video graphs look like:

P2P; No packet loss; graphs

They are here for reference. Once we will analyze the other scenarios, we will refer back to this one.

What we will be interested in will mainly be bitrate, packet loss and delay graphs.

#2 – TURN over TCP call with No Packet Loss

At first glance, I was rather put down by the results I’ve seen on this one – until I dug into it a bit deeper. I forced TCP relay by blocking all UDP traffic in our machines.

TURN over TCP; No packet loss; charts

This time, we have slightly lower bitrates – in the vicinity of 2.4Mbps outgoing and 2.2Mbps incoming.

This can be related to the additional TURN leg, its network and configuration – or to the overhead introduced by using TCP for the media instead of UDP.

The average Round trip and Jitter vaues are slightly higher than those we had without the need for TURN over UDP – a price we’re paying for relaying the media (and using TCP).

The graphs show something interesting, but nothing to “write home about”:

TURN over TCP; No packet loss; graphs

Lets look at the video bitrate first:

TURN over TCP; No packet loss; video bitrate

Look at the yellow part. Notice how the outgoing video bitrate ramps up a lot faster than the incoming video bitrate? Two reasons why this might be happening:

  1. WebRTC sends out data fast, but that same data gets clogged by the network driver – TCP waits before it sends it out, trying to be a good citizen. When UDP is used, WebRTC is a lot more agressive (and accurate) about estimating the available bitrate. So on the outgoing, WebRTC estimates that there’s enough bitrate to use, but then on the incoming, TCP slows everything down, ramping up to 2.4Mbps in 30 seconds instead of less than 5 that we’re used to by WebRTC
  2. The TURN server receives that data, but then somehow decides to send it out in a slower fashion for some unknown reason

I am leaning towards the first reason, but would love to understand the real reason if you know it.

The second interesting thing is the area in the green. That interesting “hump” we have for the video, where we have a jump of almost a full 1Mbps that goes back down later? That hump also coincides with packet loss reporting at the beginning of it – something that is weird as well – remember that TCP doesn’t lose packets – it re-transmits them.

This is most probably due to the fact that after bitstream got stabilized on the outgoing side, there’s the extra data we tried pushing into the channel that needs to pass through before we can continue. And if you have to ask – I tried a longer 5 minutes session. That hump didn’t appear again.

Last, but not least, we have the average delay graph. It peaks at 100ms and drops down to around 45ms.

To sum things up:

TURN over TCP causes WebRTC sessions to stabilize later on the available bitrate.

Until now, we’ve seen calls on clean traffic. What happens when we add some spice into the mix?

#3 – A P2P Call with 0.5% packet loss

What we’ll be doing in the next two sessions is simulate DSL connections, adding 0.5% packet loss. First, we go back to our P2P call – we’re not going to force TURN in any way.

P2P; 0.5% packet loss; charts

Our bitrate skyrocketed. We’re now at over 3Mbps for the same type of content because of 0.5% packet loss. WebRTC saw the opportunity to pump more bits to deal with the network and so it did. And since we didn’t really limit it in this test – it took the right approach.

I double checked the screenshots of our media – they seemed just fine:

P2P; 0.5% packet loss; screenshot

Lets dig a bit deeper into the video charts:

P2P; 0.5% packet loss; graphs

There’s packet loss alright, along with higher bitrates and slightly higher delay.

Remember these results for our final test scenario.

#4 – TURN over TCP Call with 0.5% packet loss

We now use the same configuration, but force TURN over TCP over the browsers.

Here’s what we got:

TURN over TCP; 0.5% packet loss; charts

Bitrates are lower than 2Mbps, whereas on without forcing TURN they were at around 3Mbps.

Ugliness ensues when we glance at the video charts…

TURN over TCP; 0.5% packet loss; graphs
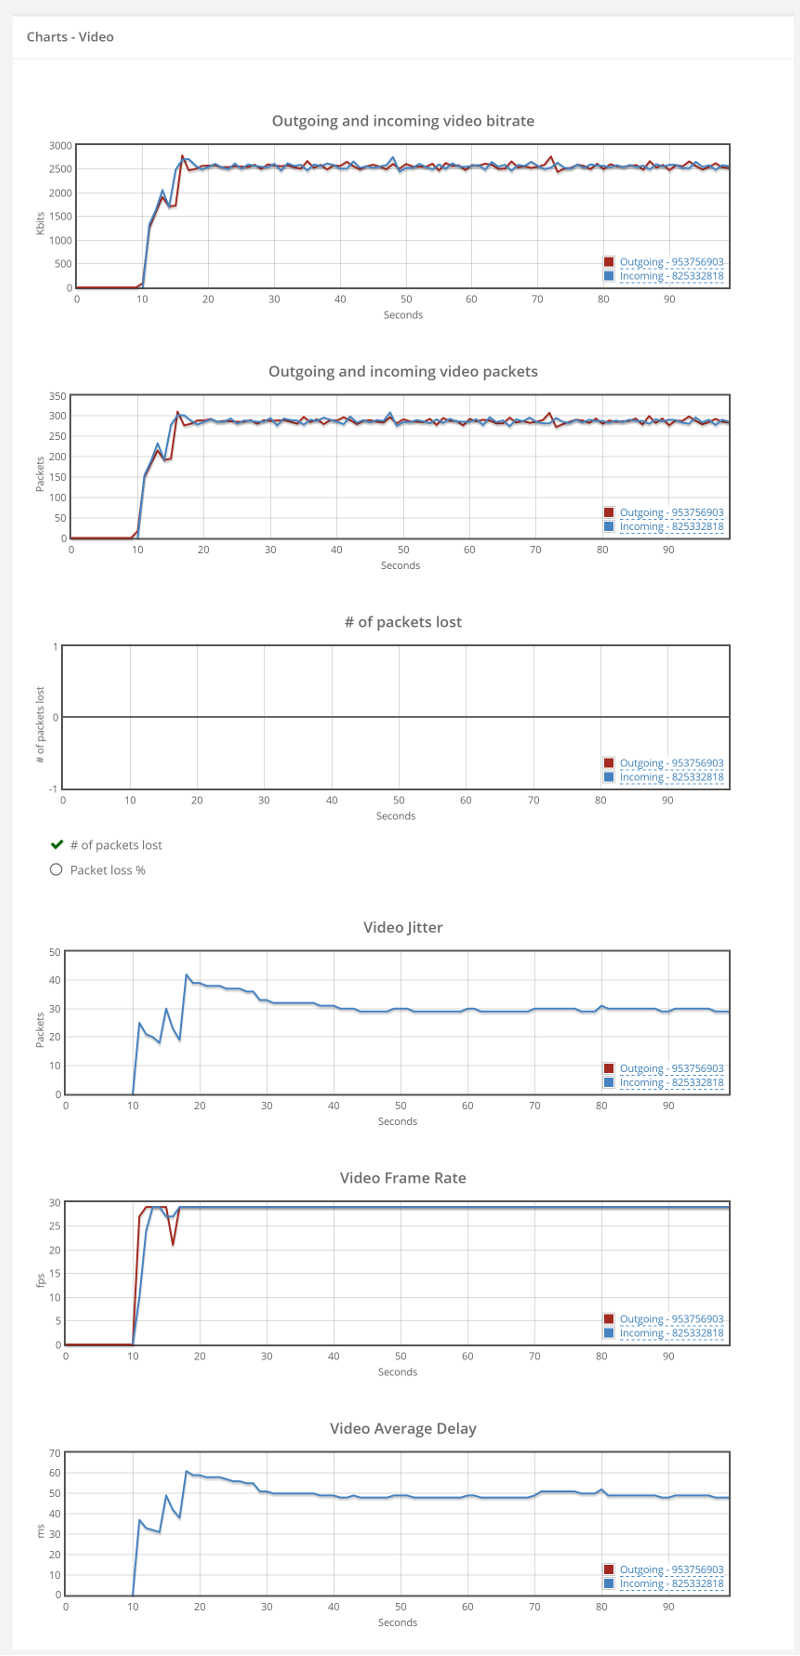
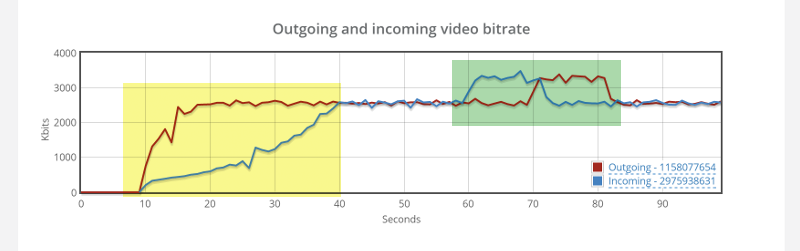
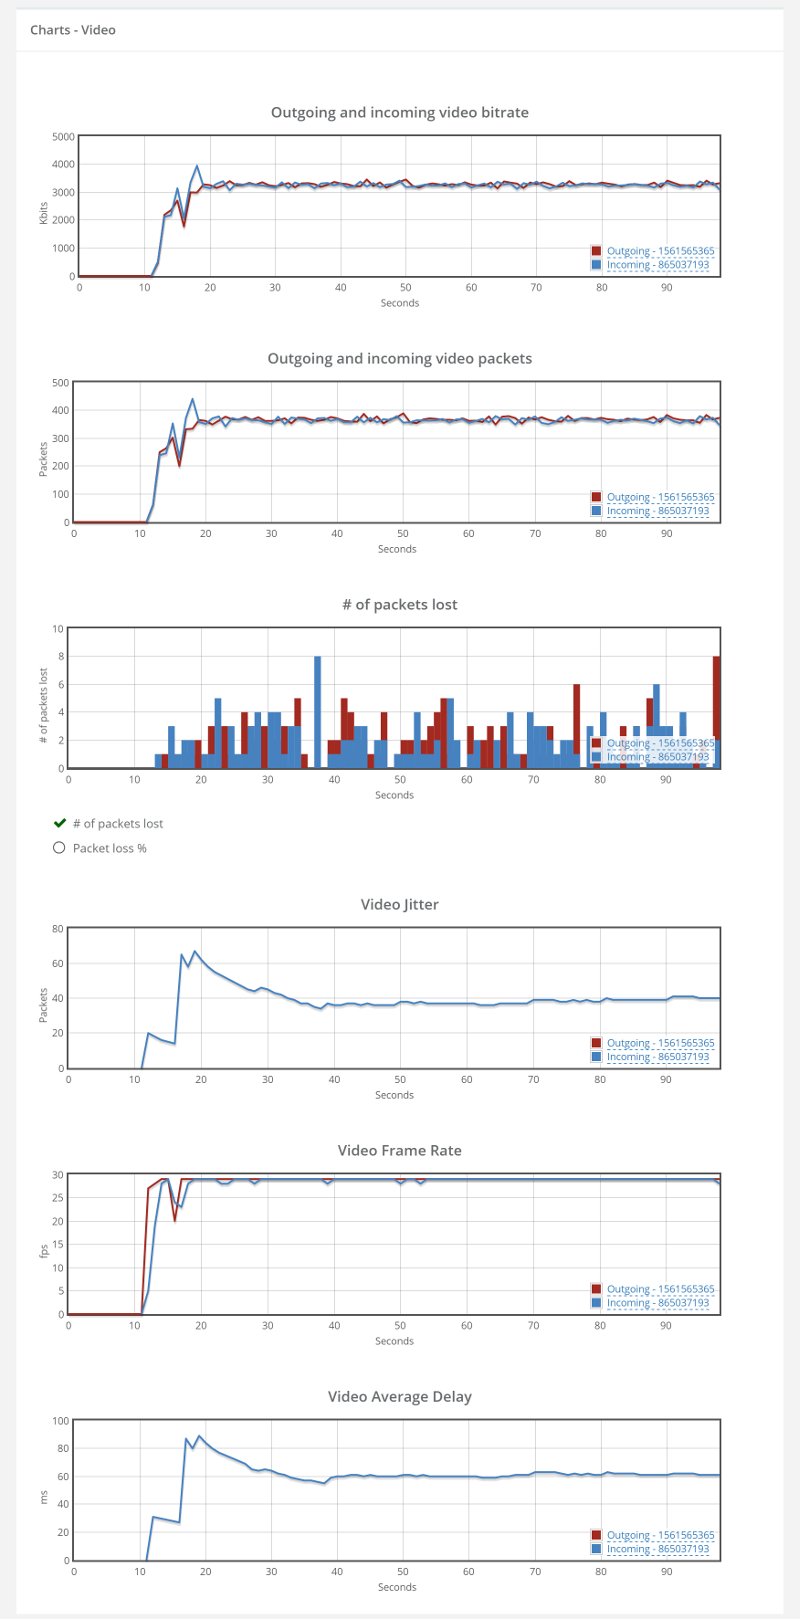
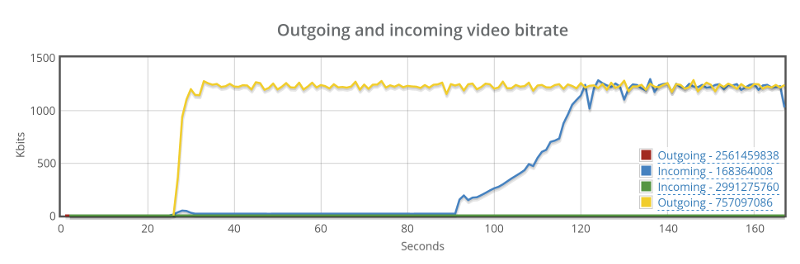
Things don’t really stabilize… at least not in a 90 seconds period of a session.

I guess it is mainly due to the nature of TCP and how it handles packet losses. Which brings me to the other thing – the packet loss chart seems especially “clean”. There are almost no packet losses. That’s because TCP hides that and re-transmit everything so as not to lose packets. It also means that we have utilization of bitrate that is way higher than the 1.9Mbps – it is just not available for WebRTC – and in most cases, these re-tramsnissions don’t really help WebRTC at all as they come too late to play them back anyway.

What did we see?

I’ll try to sum it in two sentences:

  1. TCP for WebRTC is a necessary evil
  2. You want to use it as little as possible

And if you are interested about the most likely ICE candidate to connect, then checkout Fippo’s latest data nerding post.

1

How Different WebRTC Multiparty Video Conferencing Technologies Look Like on the Wire

MCU, SFU, Mesh – what do they really mean? We decided to take all these techniques to a spin to see what goes on on the network.

To that end, we used some simple test scripts in testRTC and handpicked a service that uses each of these techniques:

We used 4 browsers for each test. All running Chrome 48 (the current stable version). All from the same data center. All using the same 720p video stream as their camera source.

While the test lengths varied across tests, we will be interested to see the average bitrate expenditure of each to understand the differences.

Mesh

appear.in runs a mesh call. It means that each user will need to send its media to all other users in the session – as well as receive all the media streams from them.

This is how it looks like:

mesh video architecture

I’ve opened up an ad-hoc room there and got 4 of our browser agents into it. Waited about a minute and collected the results:

appear.in mesh video

Nothing much to see here. Incoming and outgoing video across the whole test is rather similar, if somewhat high.

Looking at one of the browser’s media channels tells the story:

appear.in mesh video

This agent has 3 outgoing and 3 incoming voice and video channels.

Average bitrate on the video channel is around 1.2 mbps, which means our agent runs about 3.6 megabytes uplink and downlink. Not trivial.

SFU

Talky uses Jitsi for its SFU implementation. It means that it doesn’t process video but rather routes it to everyone who needs it. Each browser sends its media to the SFU, which then forwards that media to all other participants.

This is how it looks like:

sfu video architecture

I took 4 browsers in testRTC and pointed them at a single Talky session. Here’s what the report showed:

Talky SFU video

The main thing to not there is that in total, the browsers we used processed a lot more incoming media than outgoing one (at a rate of 3 to 1). This shouldn’t surprise us. Look at how one of these browsers reports its media channels:

Talky SFU video

1 outgoing audio and video channel and then 3 incoming audio and video channels. There’s another empty video channel – Talky is probably using that for incoming screen sharing.

Note how in this case the same machines with the same network performance did a lot better. The outgoing video channel gets to almost 2.5 mbps bitrate. Almost twice as much as the mesh was capable of using. To make it clear – mesh doesn’t scale well.

MCU

For an MCU I picked BlueJeans service. We’ve been playing with it a bit on a demo account so I took the time to take a quick capture of a session. Being architectured around an MCU means that each browser sends a single video stream. The MCU takes all these video streams and composes them into a single video stream that is then sent to each participant separately.

mcu video architecture

As with the other two experiments, I used 4 browsers with this MCU, receiving this report highlights:

BlueJeans MCU video

Total kilobits here is rather similar. It seems that in total, browsers received less than they sent out.

Drilling down into a single browser report, we see the following channels:

BlueJeans MCU video

Single incoming and a single outgoing audio and video channels. We have an additional incoming/outgoing video channel with no data on it – probably saved for screen sharing. While similar to how Talky does it, BlueJeans opens up an extra outgoing channel by default while Talky doesn’t.

Outgoing bitrate averages at 1.2 mbps – a lot lower than the 2.5 mbps in Talky. I assume that’s because BlueJeans limited the bitrate from the browser, which actually makes a lot of sense for 720p video stream. The incoming video is even lower at 455 kbps bitrate on average.

This didn’t make sense to me, so I dug a bit deeper into some of our video charts and found this:

BlueJeans MCU video

So BlueJeans successfully managers to get its outgoing video from the MCU towards the browser up to the same 1.2 mbps bitrate. Thinking about it, I shouldn’t be surprised. Talky and appear.in are ad-hoc services, while BlueJeans is a full service with business logic in it – getting all browsers into the session takes more time with it, especially with how we’ve written the script for it. We have a full minute here from the browser showing its local video until it really “connects” to the conference.

Another interesting tidbit is that Chrome gets its bitrate to 1.2 quite fast – something Google took care of in 2015. BlueJeans takes a slower route towards that 1.2mbps taking about half a minute to get there.

So What?

Video comes in different shapes and sizes.

WebRTC reduces a lot of the decisions we had to make and takes care of most browser related media issues, but it is quite flexible – different services use it differently to get to the same use case – here multiparty video chat.

If you are looking to understand your WebRTC service better and at the same time automate your testing and monitoring – try out testRTC.

5

Will your WebRTC service cope with VP9?

Chrome 48 has been out for a week now with some much needed features – some of them we plan on using in testRTC ourselves.

One thing that got added is official VP9 support. Sam Dutton, developer advocate @Google for everything WebRTC (and then some), wrote a useful piece on how to use VP9 with Chrome 48.

A few things interesting here:

  1. Chrome 48 now supports both VP8 and VP9 video codecs
  2. While VP9 is the superior codec, it is NOT the preferred codec by default

That second thing, of VP9 not being the preferred codec, means it won’t be used unless you explicitly request it. For now, you probably don’t have to do anything about it, but how many Chrome versions will pass until Google flips this preference?

When should you start looking at VP9?

  1. If your service runs peer-to-peer and uses no backend media processing, then you should care TODAY. Change that preference in your code and try it out. That’s free media quality you’re getting here
  2. If your service routes media through a backend server but doesn’t process it any further, then you should try it out and see how well it works. With a bit of fine tuning you should be good to go
  3. If your service needs to encode or decode video in the backend, then you’ve got work to do, and you should have started a couple of months ago to make this transition

In all cases, now would be a good time to start if you haven’t already.

Let’s take a look at AppRTC and VP9

You may have noticed I am a fan of using AppRTC for a baseline, so let’s look at it for VP9 as well. Google were kind enough to add support for VP9 to AppRTC, which means that our own baseline test for our testRTC users already supports VP9.

I took our AppRTC testRTC script for a spin. Decided to use a 720p resolution for the camera output and placed two users on it to see what happens. Here are screenshots of the results:

Chrome 48 AppRTC with VP9

What you see above is a drill down of one of the two test agents running in this test. The call was set to around 3 minutes and the interesting part here is in the bottom – the fact that we’re using VP9 for this call. You can also see that the average bitrate for the video channel is around 1.6Mbps. More about that later.

We could have done this when Chrome 48 was beta, but we didn’t have this blog then, so there wasn’t any point 🙂

When you look at the graphs for the video channels, this is what you see:

Chrome 48 AppRTC with VP9

From the above charts, there are 3 things I want to mention:

  1. It takes Chrome around 30 seconds to get to the average 1.6Mbps bitrate with VP9
  2. It is rather flaky, going up and down in bitrate quite a lot
  3. This also affects the audio bitrate (not seen here, but in another graph in the report that I didn’t put here)

How does this compare to VP8?

I took the same test and used Chrome 47 for it via testRTC. Here’s what I got:

Chrome 47 AppRTC with VP8

The main difference here from Chrome 48’s VP9 implementation? Average bitrate is around 2.5Mbps – around 0.9Mbps more (that’s 36% difference).

What’s telling though is the other part of the report:

201602-Chrome-47-VP8-2

Notice the differences?

  1. It takes Chrome 47 10 seconds or less to get VP8 to its 2.5Mbps average bit rate. A third the time that Chrome 48 needs for VP9. I didn’t further investigate if this is an issue of how Chrome works or the specific video codec implementation. Worth taking the time to look at though
  2. Chrome 47 is as stable as a rock once it reaches the available bitrate (or its limit)
  3. Audio (again, no screenshot) is just as predictable and straight in this case

How are you getting ready for VP9?

VP9 is now officially available in Chrome. There’s a lot way to go still to get it to the level of stability and network performance of VP8. That said, there are those that will enjoy this new feature immediately, so why wait?

We’re here for you. testRTC can help you test and analyze your WebRTC service with VP9 – contact us to learn more.