Tag Archives for " debugging "

How can watchRTC improve your WebRTC service operations?

watchRTC is our most recent addition to the testRTC product portfolio. It is a passive monitoring service that collects events information and metrics from WebRTC clients and analyzes, aggregates and visualizes it for you. It is a powerful WebRTC monitoring and troubleshooting platform, meant to help you improve and optimize your service delivery.

Learn more about watchRTC

It’s interesting how you can start building something with an idea of how your users will utilize it, to then find out that what you’ve worked on has many other uses as well.

This is exactly where I am finding myself with watchRTC. Now, about a year after we announced its private beta, I thought it would be a good opportunity to look at the benefits our customers are deriving out of it. The best way for me to think is by writing things down, so here are my thoughts at the moment:

What is watchRTC and how does it work?

watchRTC collects WebRTC related telemetry data from end users, making it available for analysis in real time and in aggregate.

For this to work, you need to integrate the watchRTC SDK into your application. This is straightforward integration work that takes an hour or less. Then the SDK can collect relevant WebRTC data in the background, while using as little CPU and network resources as possible.

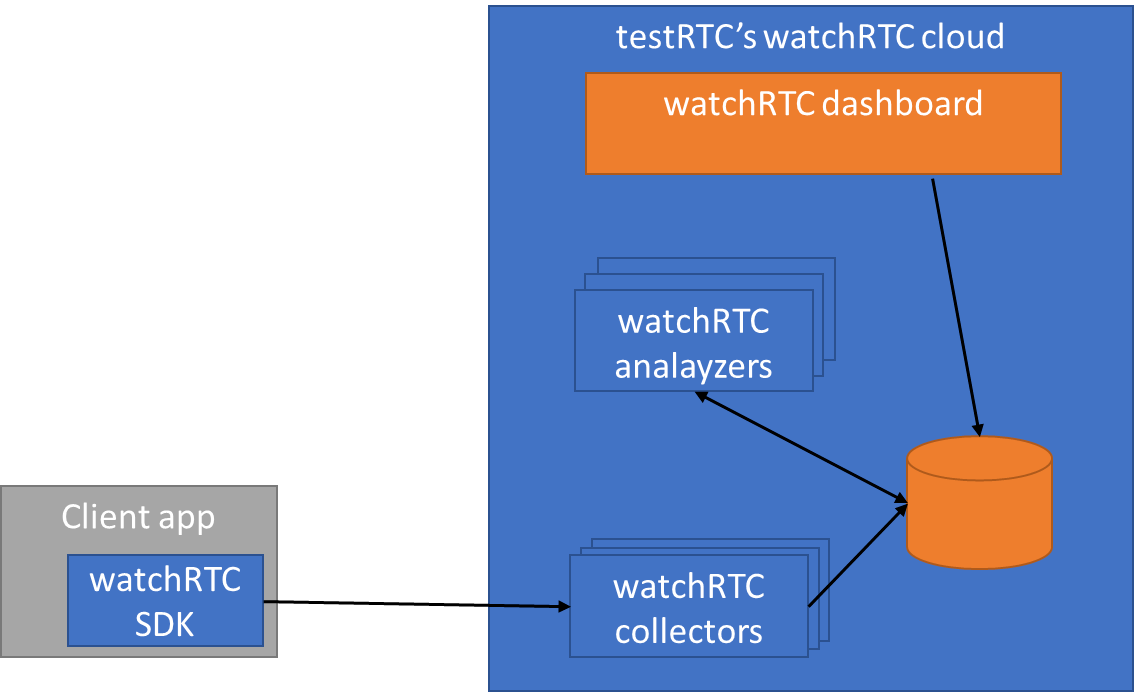
On the server side, we have a cloud service that is ready to collect this telemetry data. This data is made available in real-time for our watchRTC Live feature. Once the session completes and the room closes, the collected data can get further analyzed and aggregated.

Here are 3 objectives we set out to solve, and 6 more we find ourselves helping with:

#1- Bird’s eye view of your WebRTC operations

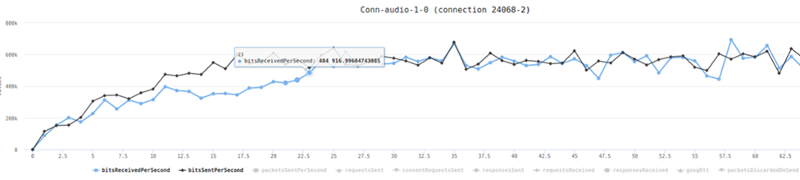
This is the basic thing you want from a WebRTC passive monitoring solution. It collects data from all WebRTC clients, aggregates and shows it on nice dashboards:

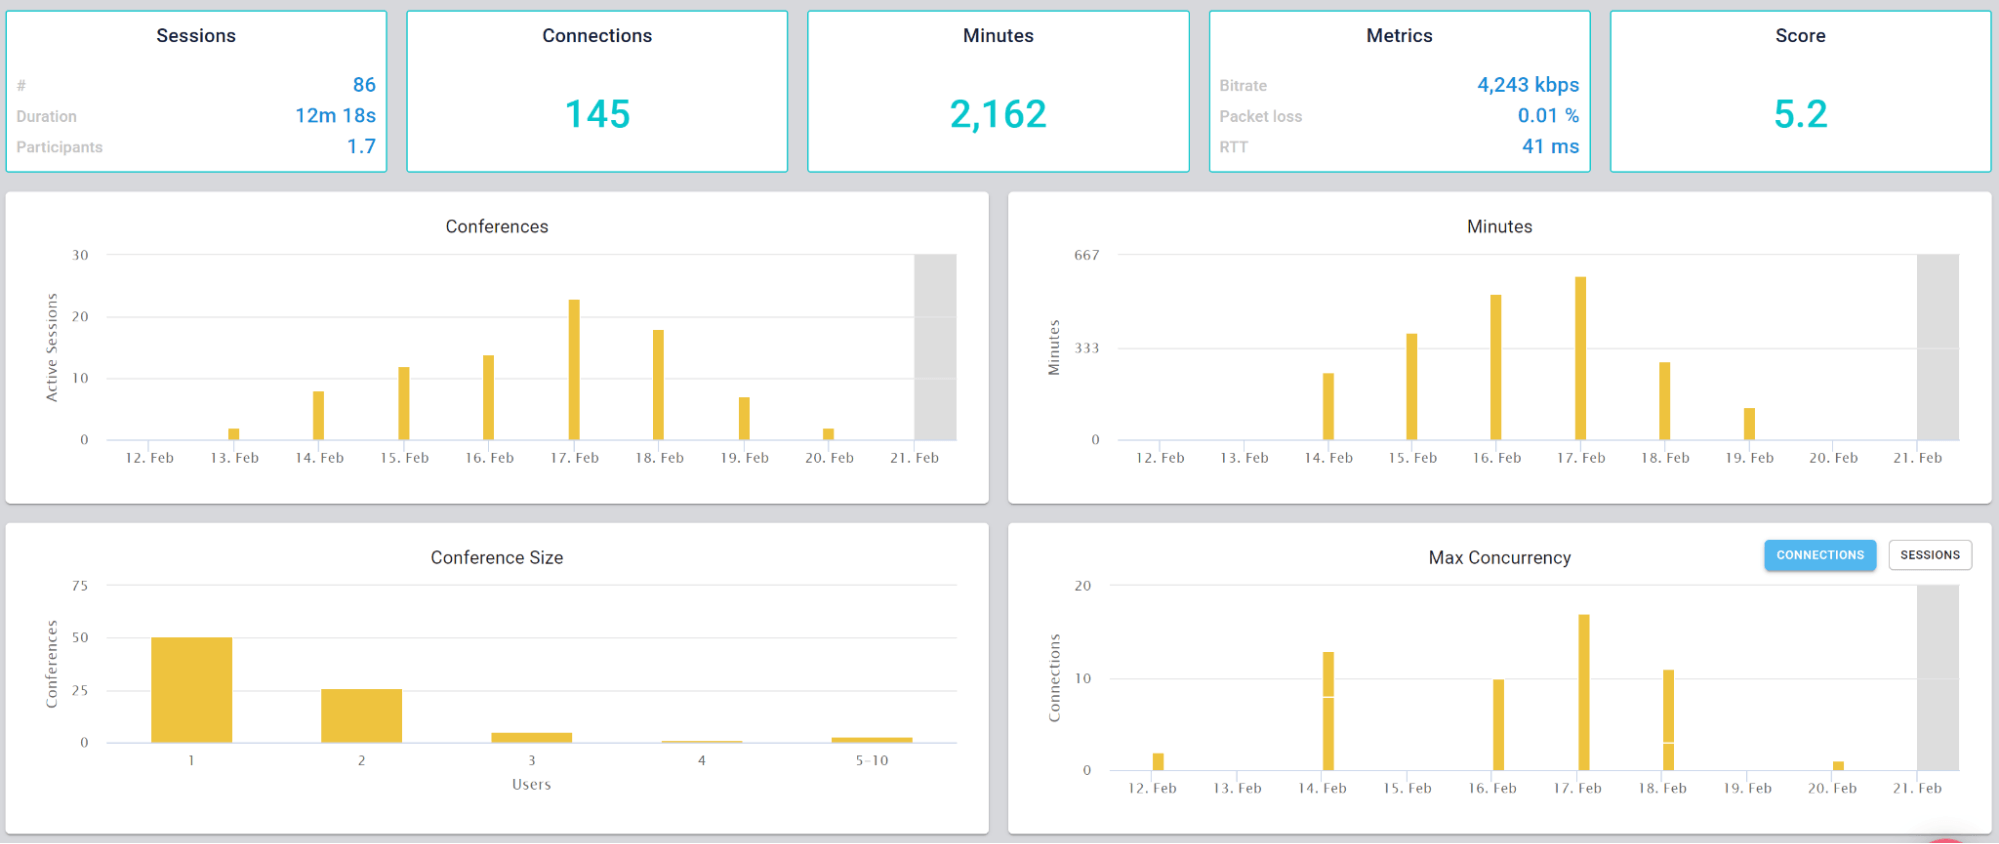
The result offers powerful overall insights into your users and how they are interacting with your service.

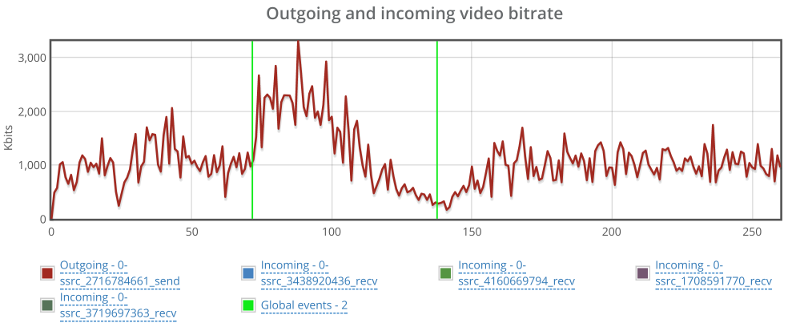
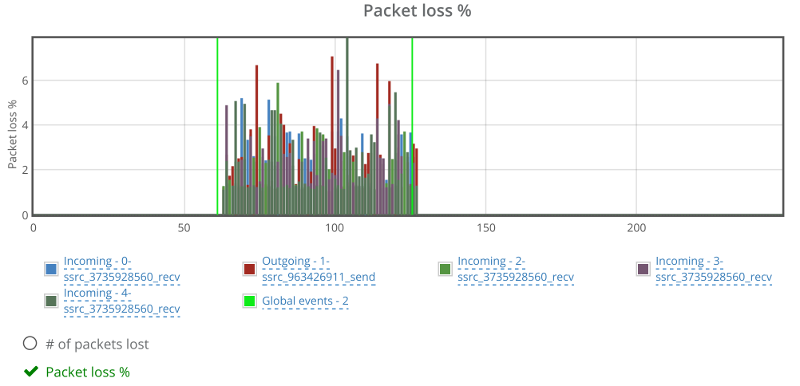
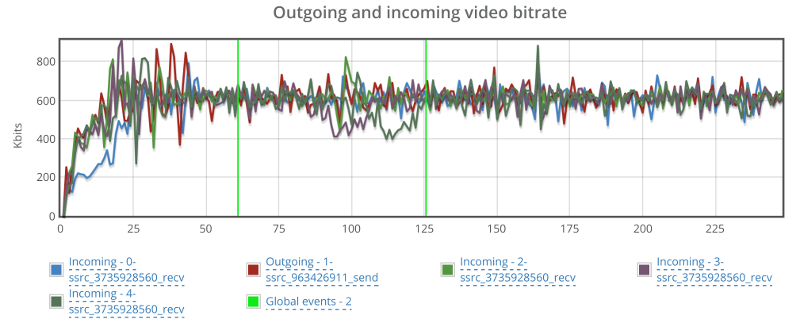
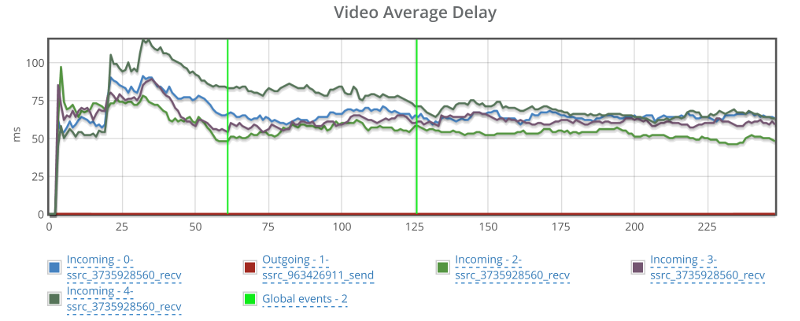
#2- Drilldown for debugging and troubleshooting WebRTC issues

watchRTC was built on the heels of other testRTC services. This means we came into this domain with some great tooling for debugging and troubleshooting automated tests.

With automated testing, the mindset is to collect anything and everything you can lay your hands on and make it as detailed as possible for your users to use it. Oh – and be sure to make it simple to review and quick to use.

We took that mindset to watchRTC with a minor difference – some limits on what we collect and how. While we’re running inside your application we don’t want to interrupt it from doing what it needs to do.

What we ended up with is the short video above.

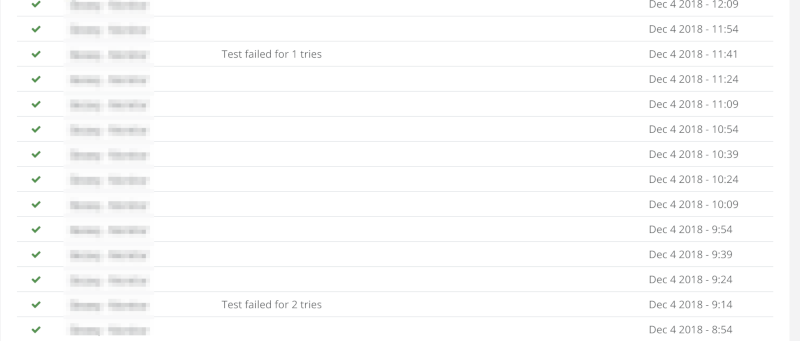
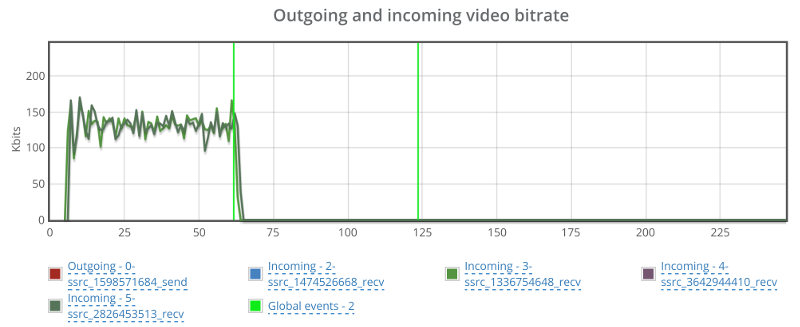
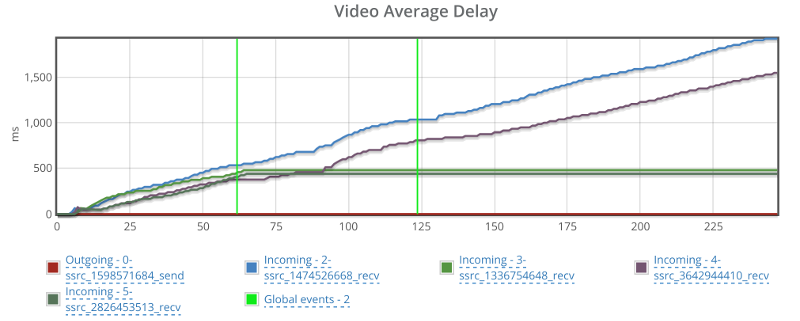
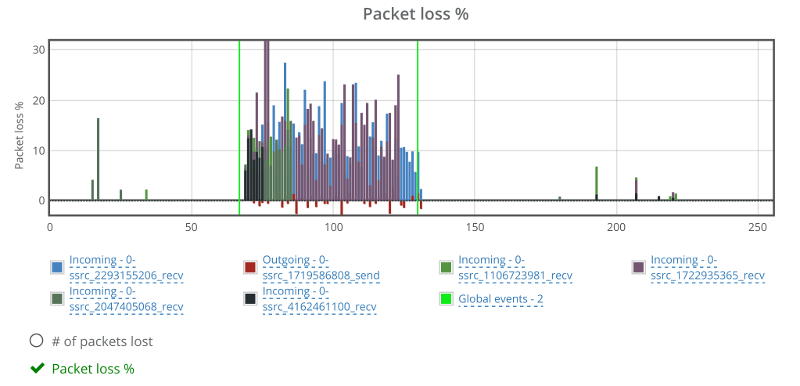
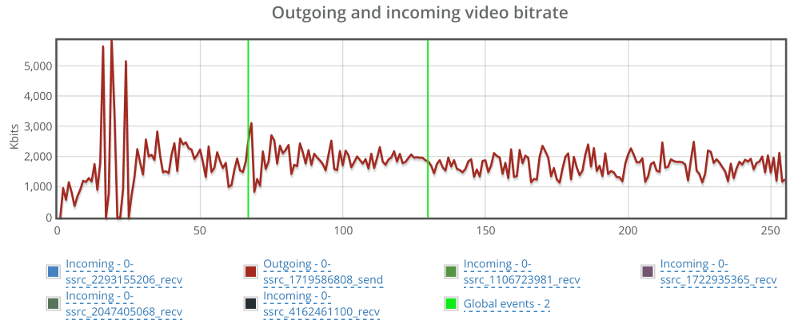
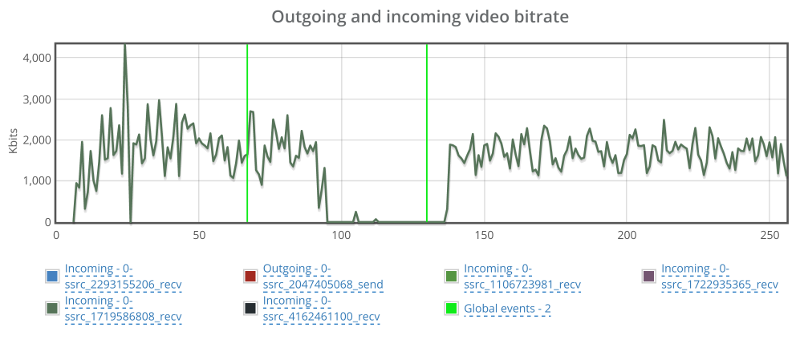
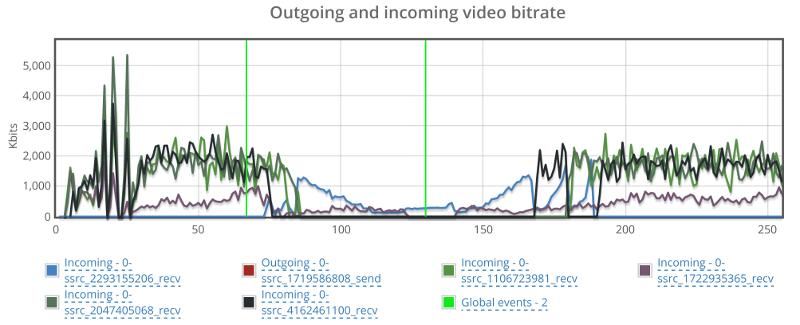
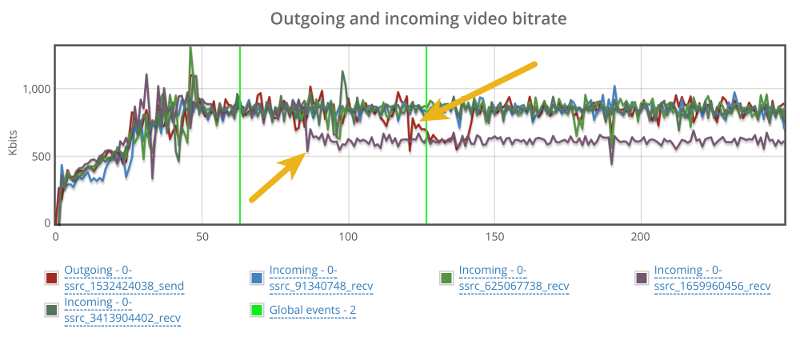
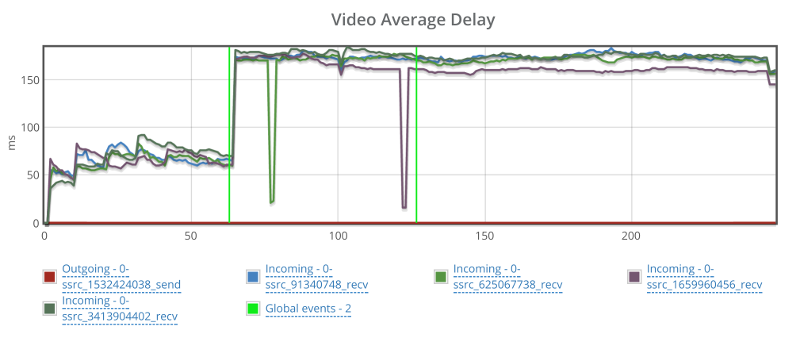
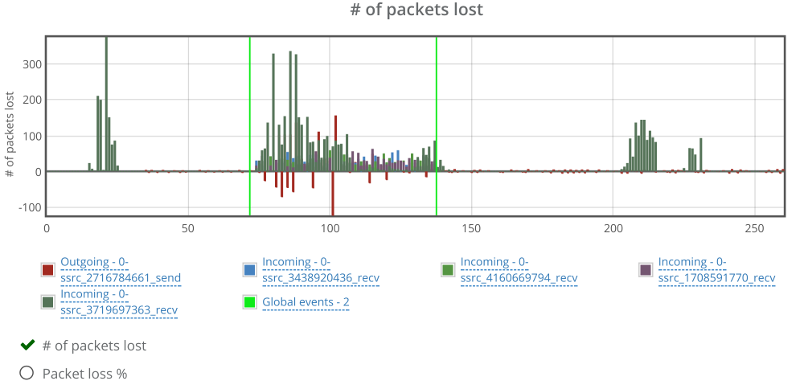
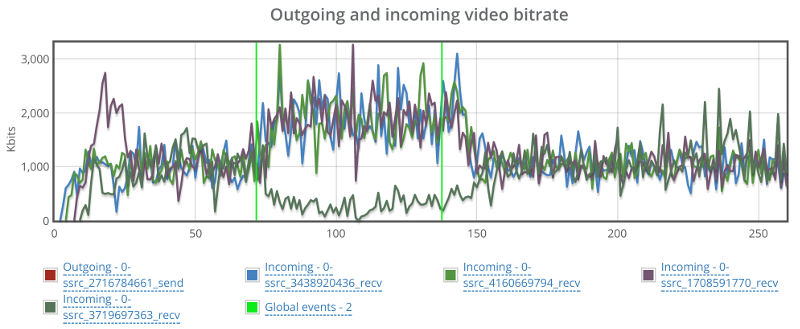
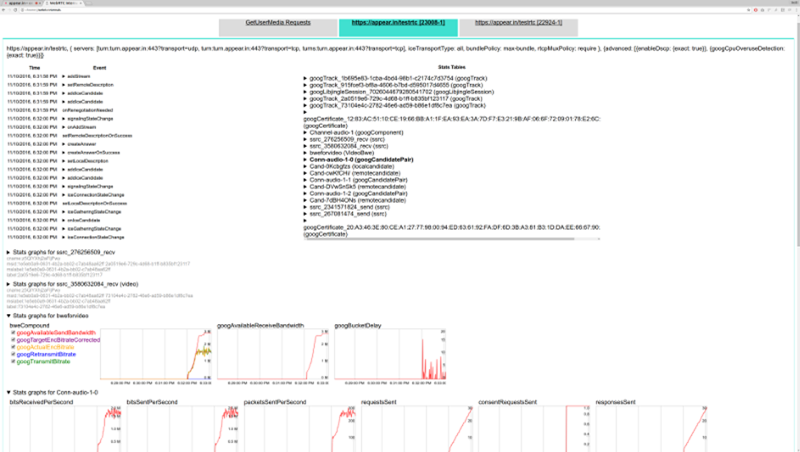
From a history view of all rooms (sessions) you can drill down to the room level and from there to the peer (user) level and finally from there to the detailed WebRTC analytics domain if and when needed.

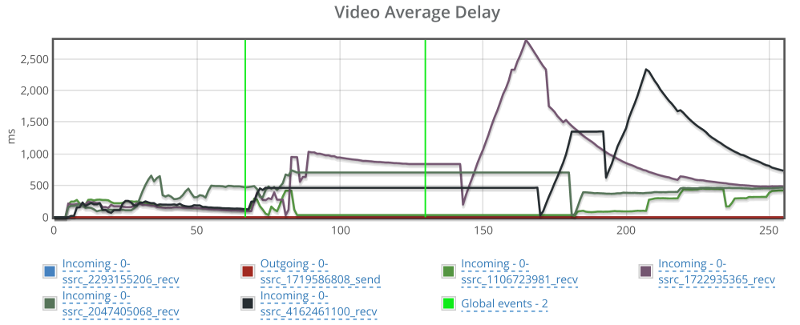
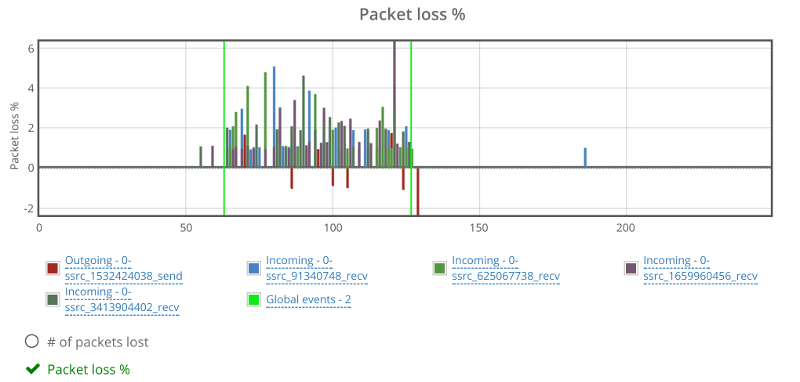
In each layer we immediately highlight the important statistics and bubble up important notifications. The data is shown on interactive graphs which makes the work of debugging a lot simpler than any other means.

#3 – Monitoring WebRTC at scale

Then there’s the monitoring piece. Obvious considering this is a monitoring service.

Here the intent is to bubble up discrepancies and abnormal behavior to the IT people.

We are doing that by letting you define the thresholds of various metric values and then bubbling up notifications when such thresholds are reached.

Now that we’re past the obvious, here are 5 more things our clients are doing with watchRTC that we didn’t think of when we started off with watchRTC:

#4 – Application data enrichment and insights

There’s WebRTC session data that watchRTC collects automatically, and then there’s the application related metadata that is needed to make more sense out of the WebRTC metrics that are collected.

This additional data comes in different shapes and sizes, and with each release we add more at our clients request:

  • Share identifiers between the application and watchRTC, and quickly switch from one to the other across monitoring dashboards
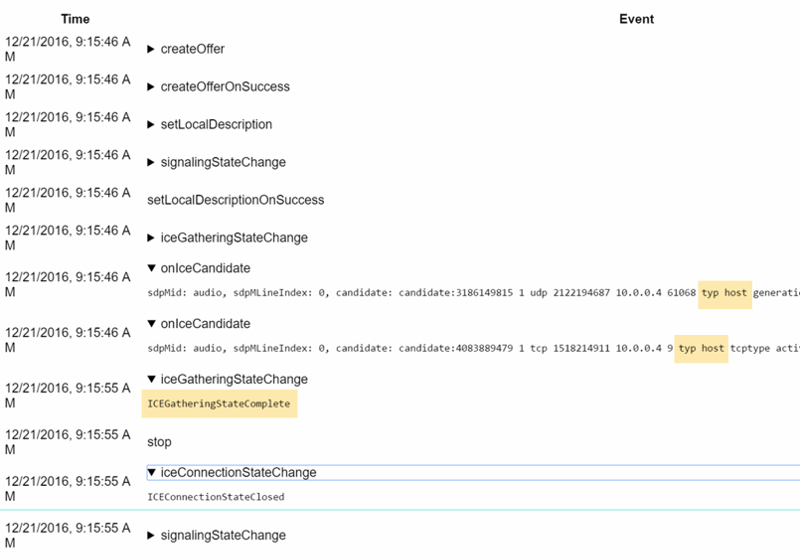
  • Add application specific events to the session’s timeline
  • Map the names of incoming channels to other specific peers in a session
  • Designate different peers with different custom keys

The extra data is useful for later troubleshooting when you need to understand who the users involved are and what actions have they taken in your application.

#5 – Deriving business intelligence

Once we started going, we got these requests to add more insights.

We already collect data and process it to show the aggregate information. So why not provide filters towards that aggregate information?

Starting with the basics, we let people investigate the information based on dates and then added custom keys aggregation.

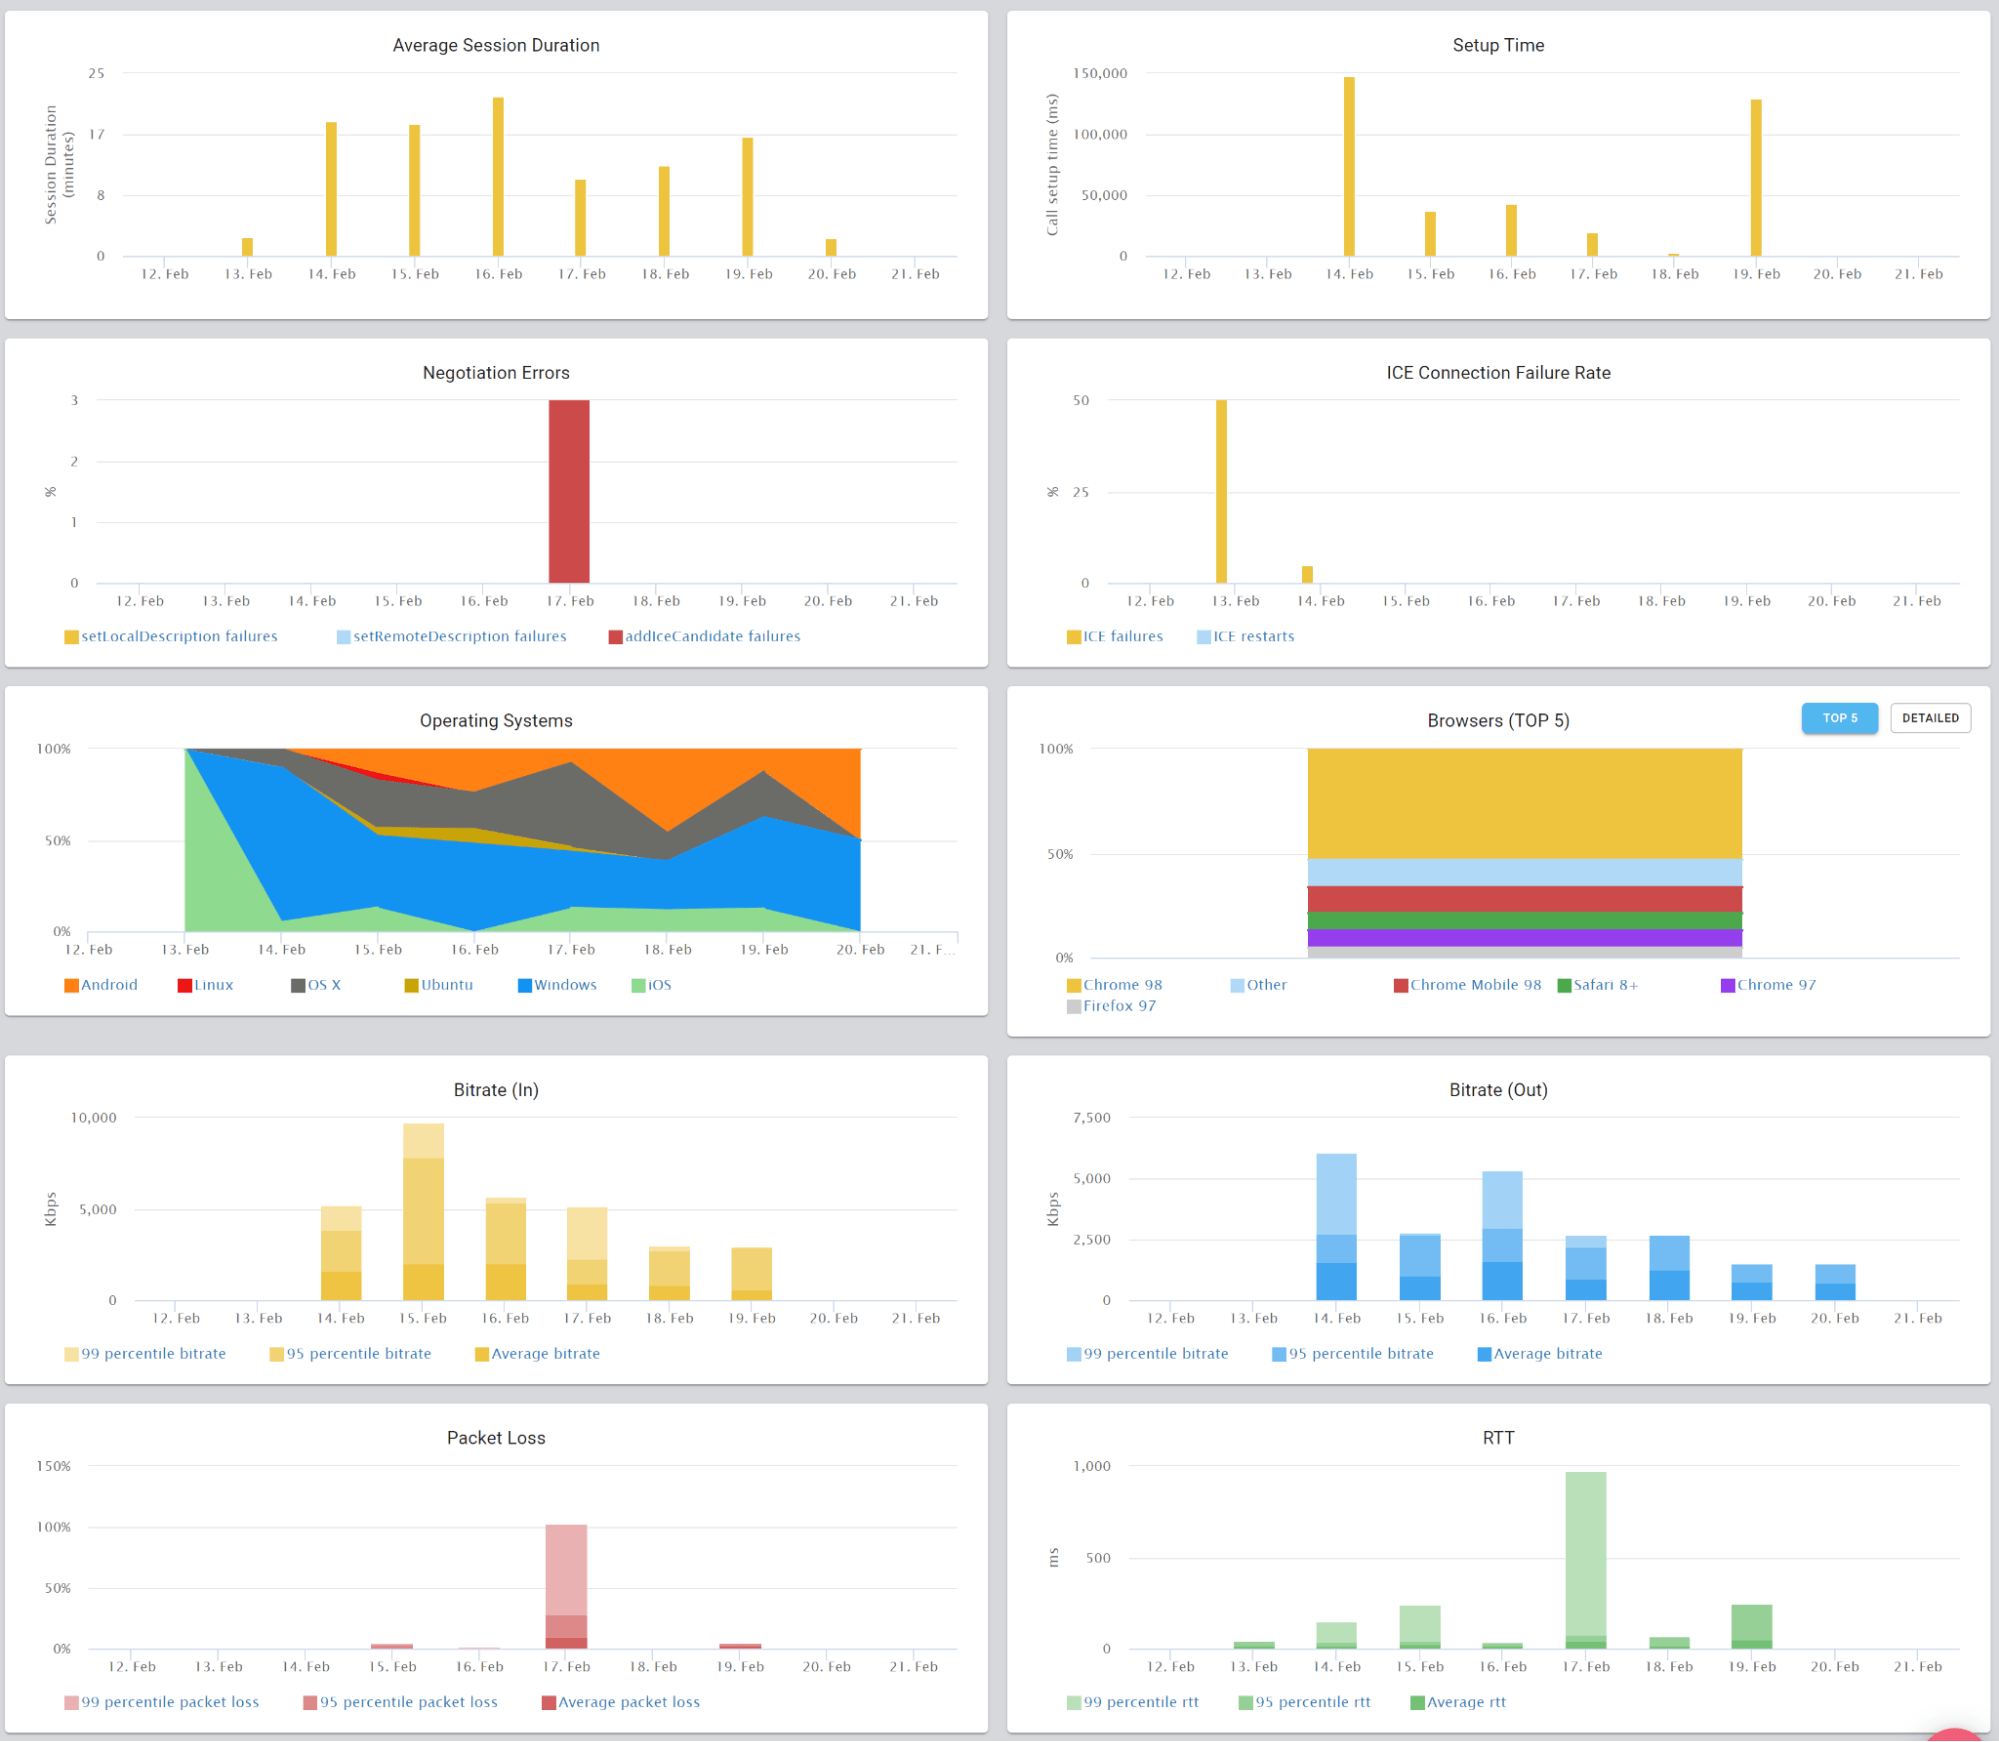
Now? We’re full on with high level metrics – from browsers and operating systems, to score values, bitrates and packet loss. Slice and dice the metrics however you see fit to figure out trends within your own custom population filters.

On top of it all, we’re getting ready to bulk export the data to external BI systems of our clients – some want to be able to build their own queries, dashboards and enrichment.

#6 – Rating, billing and reporting

Interestingly, once people started using the dashboards they then wanted to be able to make use of it in front of their own customers.

Interestingly, not all vendors are collecting their own metrics for rating purposes. Being able to use our REST API to retrieve highlights for these, and base it on the filtering capabilities we have, enables exactly that. For example, you can put a custom key to denote your largest customers, and then track their usage of your service using our APIs.

Download information as PDFs with relevant graphs or call our API to get it in JSON format.

#7 – Optimization of media servers and client code

For developers, one huge attraction of watchRTC is their ability to optimize their infrastructure and code – including the media servers and the client code.

By using watchRTC, they can deploy fixes and optimizations and check “in the wild” how these affect performance for their users.

watchRTC collects every conceivable WebRTC metric possible, optimization work can be done on a wide range of areas and vectors as the results collected capture the needed metrics to decide the usefulness of the optimizations.

#8 – A/B testing

With watchRTC you can A/B test things. This goes for optimizations as well as many other angles.

You can now think about and treat your WebRTC infrastructure as a marketer would. By creating a custom key and marking different users with it, based on your own logic, you can A/B test the results to see what’s working and what isn’t.

It is a kind of an extension of optimizing media servers, just at a whole new level of sophistication.
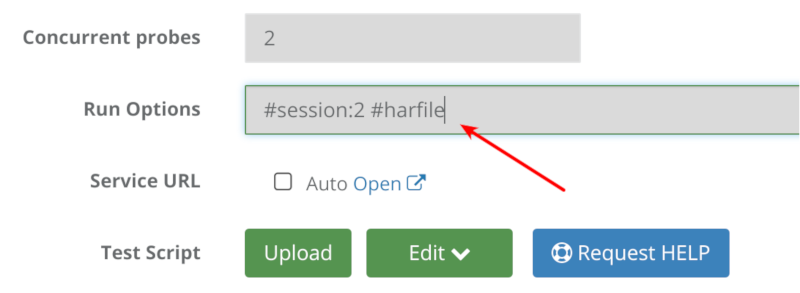
#9 – Manual testing

If you remember, our origin is in testing, and testing is used by developers.

These same developers already use our stress and regression testing capabilities. But as any user relying on test automation will tell you – there are times when manual testing is still needed (and with WebRTC that happens quite a lot).

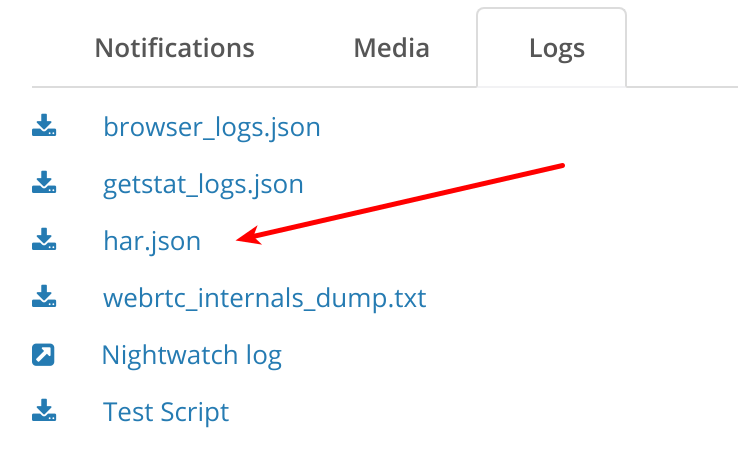
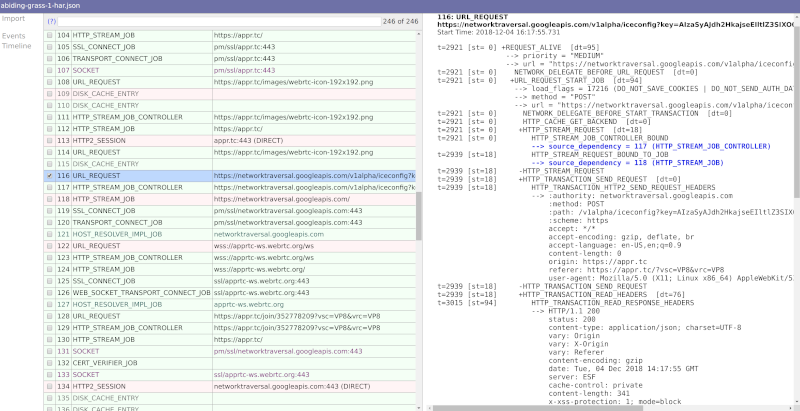
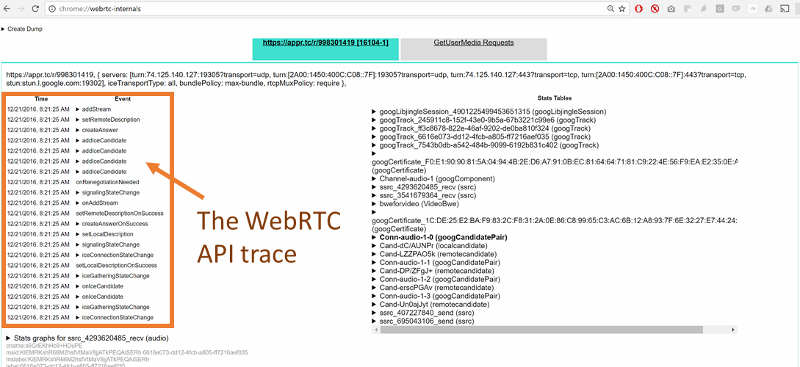
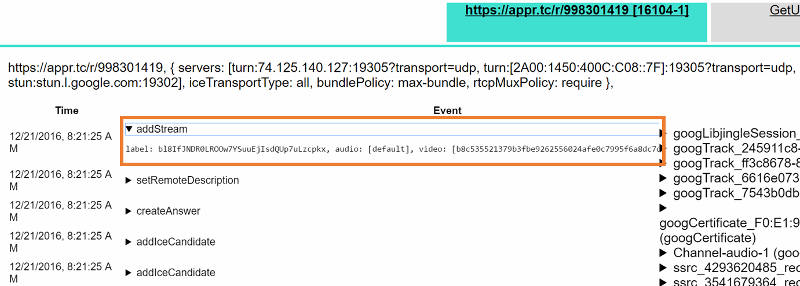
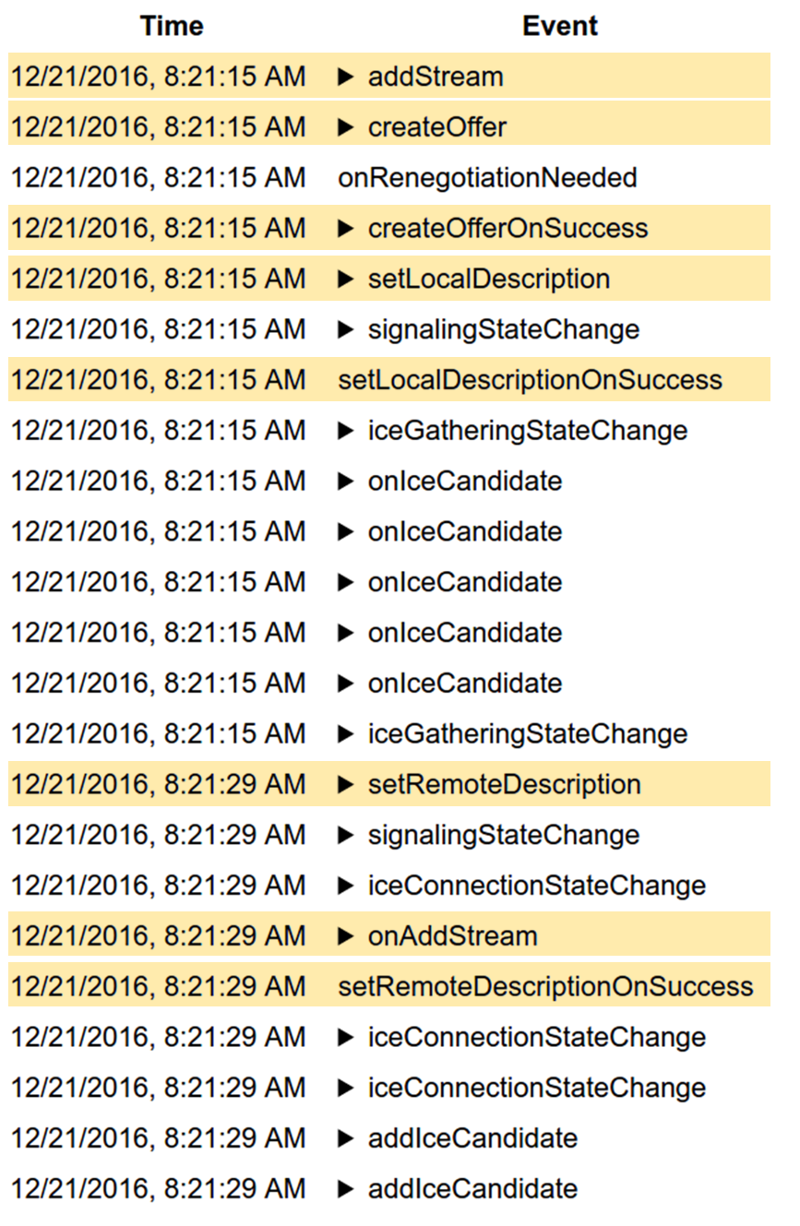
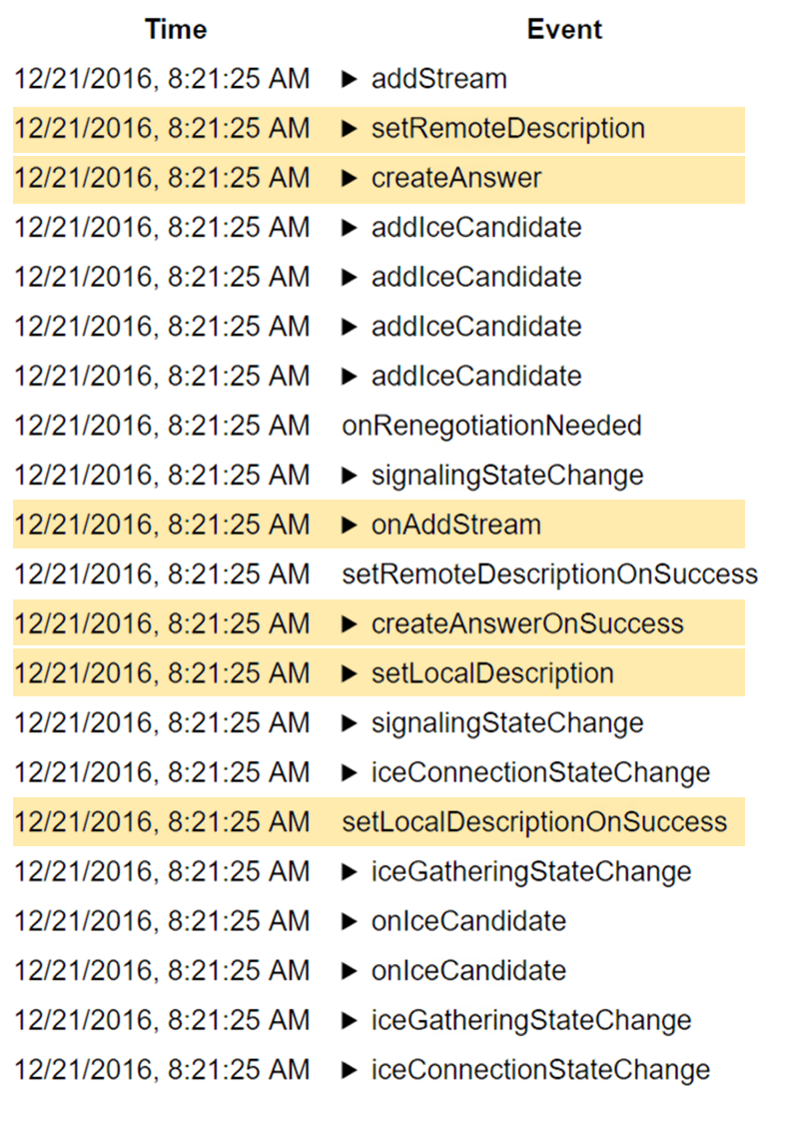
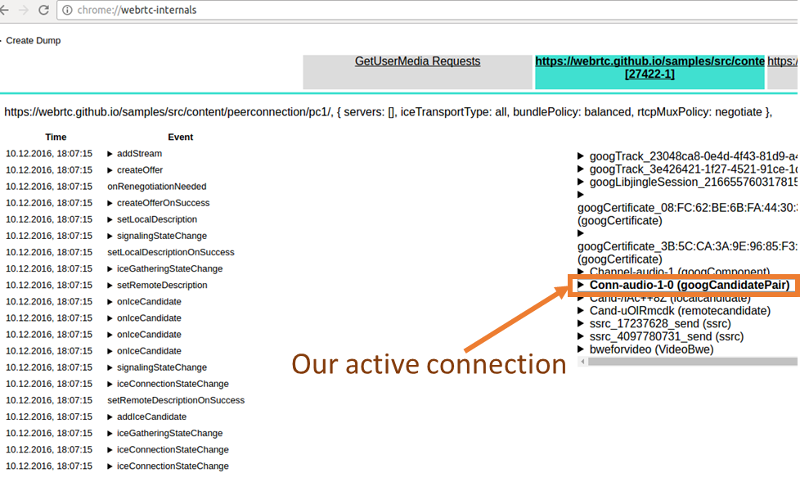
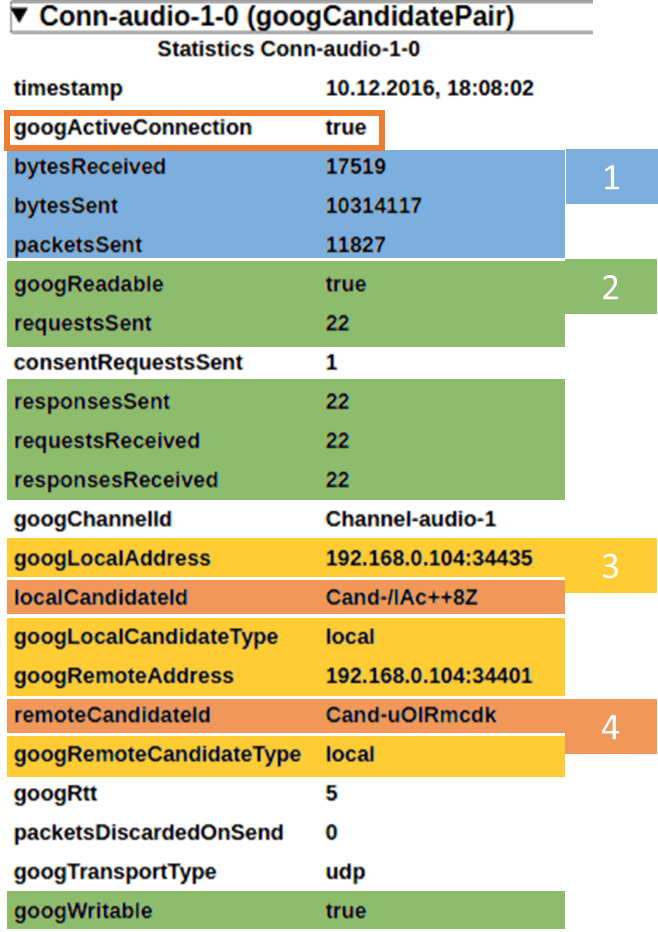
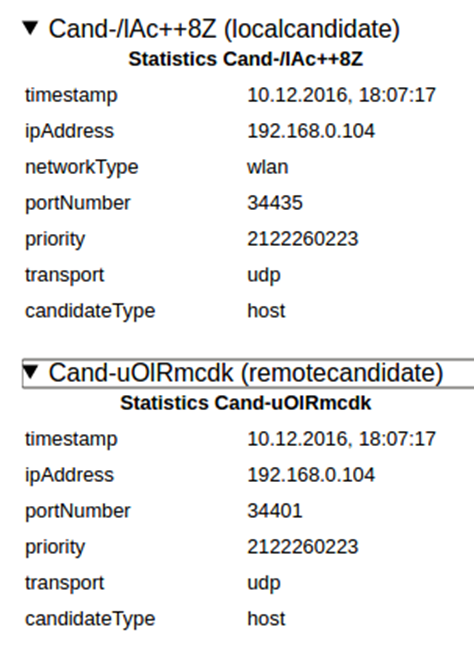
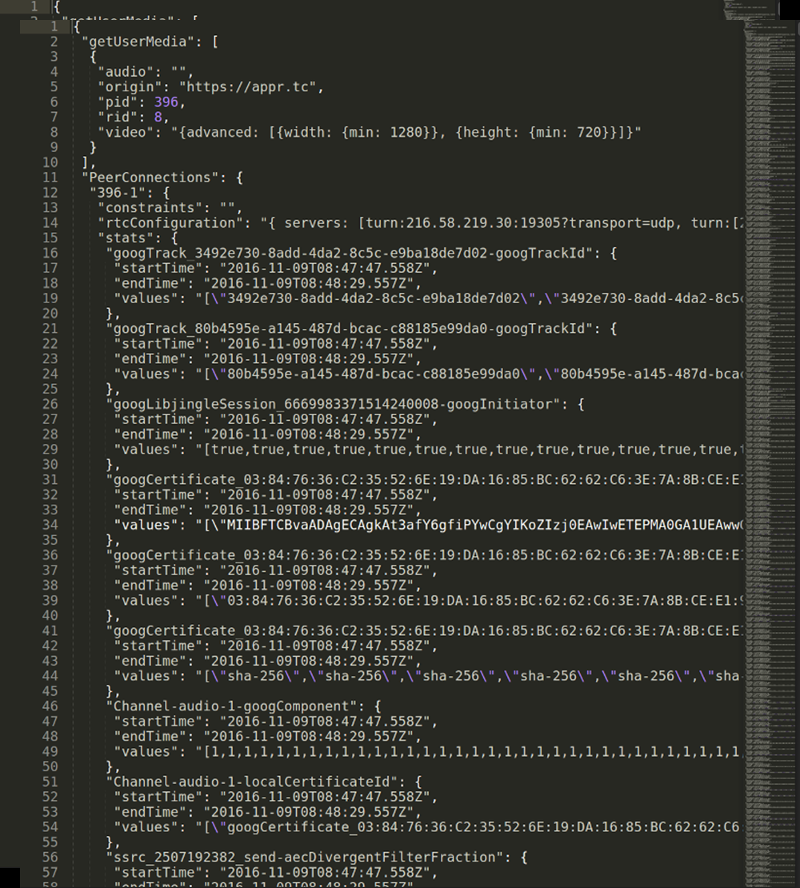
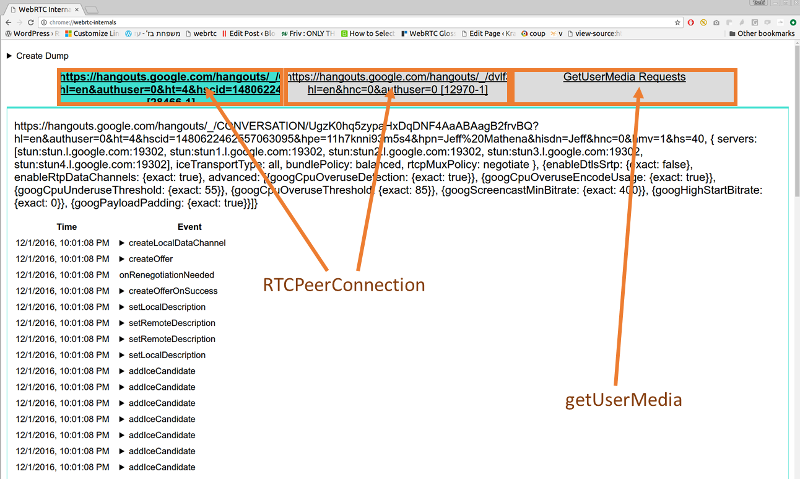
The challenge with manual testing and WebRTC is data collection. A tester decided to file a bug. Where does he get all of the information he needs? Did he remember to keep his chrome://webrtc-internals tab open and download the file on time? How long does it take him to file that bug and collect everything?

Well, when you integrate with watchRTC, all of that manual labor goes away. Now, the tester needs only to explain the steps that caused the bug and add a link to the relevant session in watchRTC. The developer will have all the logs already there.

With watchRTC, you can tighten your development cycles and save expensive time for your development team.

watchRTC – run your WebRTC deployment at the speed of thought

One thing we aren’t compromising with watchRTC is speed and responsiveness. We work with developers and IT people who don’t have the time to sit and wait for dashboards to load and update, therefore, we’ve made sure and are making it a point for our UI to be snappy and interactive to the extreme.

From aggregated bird’s eye dashboard, to filtering, searching and drilling down to the single peer level – you’ll find watchRTC a powerful and lightning fast tool. Something that can offer you answers the moment you think of the questions.

If you’re new to testRTC and would like to find out more we would love to speak with you. Please send us a brief message, and we will be in contact with you shortly.

2

Network monitoring: 8 benefits of active monitoring in WebRTC

Call it WebRTC active monitoring or WebRTC synthetic monitoring, the concept is rather simple. What you are trying to do is run a scenario from real browsers the same way a user would. Why? So you can see (=track and monitor) your WebRTC application the way your customers do.

You know pingdom? It is a service that pings your website every couple of seconds. If it fails to get a response – you receive an email that your website is down. A simple and straightforward solution. There are many similar services out there and they work beautifully. If all you’re after is to answer the question “is my website still up?”

This, though is different than asking the question “is my website working properly?”

How do you go about monitoring a website for that? You dig one or two levels deeper, specifically, by putting on probes that load your webpages and look for indication that these pages are fresh and not erroneous. Why? Because a ping test of a website can be happy with this kind of a result:

That’s Google Calendar being down a few weeks back. I am not sure that a ping test would notice that, as a page does load.

The path to synthetic/active monitoring

What would an IT person do? Add more metrics that he can track. CPU use, memory use, network traffic. And then add more metrics from the application: page views, open sessions, etc.

These metrics are prone to two problems:

  1. Seasonality changes their behavior. Think weekend or holiday traffic versus regular days, or opening hours versus night time
  2. The lights might be on but there’s nobody home. All looks fine, but somehow a user is unable to login or get connected to a certain service due to breakage in the connection of two internal systems. Since monitoring is done on low level metrics, such cases might be missed

The next step for our IT person would be to have a probe act like a user to going through the system to understand its behavior. These probes conduct synthetic monitoring, where they act like real users going through the system.

The same applies to WebRTC applications as well.

8 benefits of active monitoring in WebRTC

Call it WebRTC active monitoring or WebRTC synthetic monitoring, the concept is rather simple. What you are trying to do is run a scenario from real browsers the same way a user would. Why? So you can see (=track and monitor) your WebRTC application the way your customers do. And once you automate it and run it frequently, you can gain insights and understanding that you just can’t get in any other way.

Here are 8 benefits that got customers like Vidyo to use testRTC for monitoring their WebRTC cloud deployment:

#1 – Predictability and Objectivity

When you run an active monitor you are in control. You know where the probes are coming from, what is the performance of the machines they use offer, and what their network conditions are. And if you don’t, then running that active monitor in the same scenario a couple of times will create the baseline you need.

With that information, you can now run the scenario as an active monitor, and if all goes well the results will be consistent. The moment something changes – there’s a pretty high level of confidence that something changed in your WebRTC deployment. That’s predictability.

The fact that the metrics collected and analyzed results are based on machine automation, you also gain objectivity. While it will be hard to say how bad a jitte value of 120 is versus 100, it will be easy to say that if you had a jitter value of 100 for a few months and now that has changed to 120 in the monitor you are running, then things changed for the worse, and it would be wise to check why.

#2 – End-to-End

When we deploy a monitor with a new client of ours at testRTC there’s almost always a learning period of a month or two. At that time, we need to assist our client to fine tune and tweak the script written for the monitor.

Common things we need to do is slow down button clicking or add retries in certain strategic places (like login procedures). Why? Because production WebRTC services sometimes receive 502 when people try to login, connect or start sessions. Real users would simply refresh the page by clicking F5 or retry clicking a button.

In some cases, our clients would go about hunting these bugs and fix them. In others, we’d build these retry mechanisms into the script used by the monitor.

The thing is though, that when a WebRTC session fails, it can fail a lot before it even started. Or it can work nicely, but screen sharing fails. Or screen sharing will work but PSTN dial-in won’t. Being able to define the most important WebRTC scenarios and synthetically monitor for them gives you an end-to-end solution.

#3 – Be the first to know

You need to be the first to know when there is an issue. That issue can be with the login, directory service, session initialization, media quality or any other problem that might arise.

If you are operating a contact center, then calls take place at certain times of the day (office hours). Understanding potential failures before they happen simply by running a monitor prior to a Monday morning shift starting the day would give you more time to resolve issues.

If you have millions of calls taking place a day on your system, then this might not be an issue for you – or more likely, your users would complain at the same time your service monitoring will notice a failure. In such a case, other reasons such as predictability would make more sense to using synthetic monitoring. This is doubly so since using predictable probes that create synthetic sessions should result consistent outcomes, as opposed to real users where you lack any control over their machine, location and network.

#4 – Simplicity

There’s something to be said about simple approaches for complex problems.

When users can’t connect to your service, do you know why that is? If they complain about quality, is it because of their device, network connection or your service? How do you even go about analyzing this?

WebRTC synthetic monitoring reduces a lot of the variables and brings predictability with it into the process. What you end up collecting and how you serve that to the IT person in charge is also quite important – there are so many metrics and parameters to look at with WebRTC that many don’t find their way around.

What we’re razor focused in testRTC is in making the analysis process as simple as possible to our clients. Letting them glean the insights they need with the least amount of effort on their part. Our upcoming release goes in that trend and is already being trialed by a few of our clients.

#5 – Debuggability

The monitor failed or alerted at an issue. Great. Now what? How do you make that alert an actionable one?

With passive monitoring of live users, there’s very little you can do in a lot of cases. Quality is a subjective thing that is affected quite a lot by the user’s own device and network. Move a meter or two farther away from your current position while in a call, and your Wifi connection might become unusable. In my house, using Wifi in the bedroom is quite the challenge. The living room and my home office? They’re guaranteed to give high network quality. At least up to the carrier. My desktop has its good days and bad days, depending on the number of Chrome tabs opened and the number of days since the last reboot.

If you run a synthetic monitor for WebRTC, then there are quite a few things at your disposal. Here are some that we’ve implemented in testRTC for our clients:

  • Collect all possible data, so developers can look at logs and figure out the issues. This includes WebRTC metrics, browser console logs, network events log, browser performance data and screenshots
  • Visualize the scenario and the metrics collected, keeping it simple at first glace with high level graphs and aggregations while enabling drill down to the minute details
  • Automate threshold on metrics, to make sure tests warn or fail on certain use cases and conditions that are suitable for you
  • Grab a screenshot at the time of failure, so you can see the moment the scenario fails
  • Execute the scenario again, so you can see the failure (since the scenario and probes are predictable, there’s a high likelihood the failure will occur again)
  • Join a running synthetic session via VNC, so you can see for yourself how the session progresses

#6 – No instrumentation

Synthetic monitoring requires no instrumentation of your service.

Since you end up using real browsers, running real scenarios, the only thing you’ll probably need is create certain users for running the monitor and that’s about it.

There’s no code you’ll need to inject into your service. No js file to include. No SDK to compile into your app.

That means it is faster to deploy to production than alternatives and the potential effect it has on your service due to the addition of external code is non-existent, since you’ve changed nothing in the code.

#7 – Privacy

A synthetic monitor collects synthetic metrics. It doesn’t sit on your live users, so there’s no live user data collection taking place. There’s also no real indication of the size of your deployment, the trajectory and growth of your service or anything similar associated with it.

We’ve seen reluctance of clients to share such data with cloud based services. These mostly stem from legal issues such as where the data gets collected and stored, but also from a business perspective of having a third party trusted with the day to day communications that takes place. In many cases, companies are happier having this part of the operation take place in-house.

With an active monitor, the only data collected and analyzed is the data generated by the browser of the active monitor itself and no one else. The users used by the active monitor are dummy users created for that purpose only.

#8 – Fixed investment

Talking about predictability… as your service grows, a WebRTC active monitor act in the same manner. This means your investment in running the monitor won’t be changing either. This is never the case with a passive monitor, where pricing is based on the size of the user base as well as the amount of traffic.

That means you can budget and plan ahead for longer periods of time at relatively low investment.

When will you need to grow your investment? When you want to deepen your analysis. This is done by deploying more monitors (to run from more geographic locations or to hit different data centers of your service), increasing the frequency of the monitors (to get alerted on issues earlier) or when you beef up monitors (by adding more probes to test larger video group calls for example).

testRTC’s active monitoring

If you are in need of better visibility of your WebRTC application, then by all means – explore passive monitoring and deploy it. But also check how active monitoring can improve your day-to-day operations and in the end, improve uptime and media quality for your users.

We’re here to help, so contact us for a demo.

Testing Firefox has just become easier (and other additions in testRTC)

We’ve pushed a new release for our testRTC service last month. This one has a lot of small polishes along with one large addition – support for Firefox.

I’d like to list some of the things you’ll be able to find in this new release.

Firefox

When we set out to build testRTC, we knew we will need to support multiple browsers. We started off with Chrome (just like most companies building applications with WebRTC), and somehow drilled down into more features, beefing up our execution, automation and analysis capabilities.

We tried adding Firefox about two years ago (and failed). This time, we’re taking it in “baby steps”. This first release of Firefox brings with it solid audio support with rudimentary video support. We aren’t pushing our own video content but rather generating it ad-hoc. This results less effective bitrates that we can reach.

The challenge with Firefox lies in the fact that it has no fake media support the same way Chrome does – there is no simple way to have it take up media files directly instead of the camera. We could theoretically create virtual camera drivers and work our way from there, but that’s exactly where we decided to stop. We wanted to ship something usable before making this a bigger adventure (which was our mistake in the past).

Where will you find Firefox? In the profile planning section under the test editor:

When you run the tests, you might notice that we alternate the colors of the video instead of pushing real video into it. Here’s how it looks like running Jitsi between Firefox and Chrome:

That’s a screenshot we’ve taken inside the test. That cyan color is what we push as the video source from Firefox. This will be improved over time.

On the audio side you can see the metrics properly:

If you need Firefox, then you can now start using testRTC to automate your WebRTC testing on Firefox.

How we count minutes

Up until now, our per minute pricing for tests was built around the notion of a minimum length per test of 10 minutes. If you wanted a test with 4 probes (that’s 4 browsers) concurrently, we calculated it as 4*10=40 minutes even if the test duration was only 3 minutes.

That has now changed. We are calculating the length of tests without any specific minimum. The only things we are doing is:

  1. Length is rounded up towards the nearest minute. If you had a test that is 2:30 minutes long, we count it as 3 minutes
  2. We add to the test length our overhead of initiation for the test and teardown. Teardown includes uploading results to our servers and analyzing them. It doesn’t add much for smaller tests, but it can add a few minutes on the larger tests

End result? You can run more tests with the minutes allotted to your account.

This change is automatic across all our existing customers – there’s nothing you need to do to get it.

Monitoring tweaks

We’ve added two new capabilities to monitoring, due to requests of our customers.

#1 – Automated run counter

At times, you’ll want to alternate information you use in a test based on when it gets running.

One example is using multiple users to login to a service. If you run a high frequency monitor, which executes a test every 2-5 minutes, using the same user won’t be the right thing to do:

  • You might end up not leaving the first session when running the next monitor a couple of minutes later
  • Your service might leave session information for longer (webinars tend to do that, waiting for the instructors to join the same session for ten or more minutes after he leaves)
  • If a monitor fails, it might cause a transient state for that user until some internal timeout

For these, we tend to suggest clients to use multiple users and alternate between them as they run the monitors.

Another example is when you want in each round of execution to touch a different part of your infrastructure – alternating across your data centers, machines, etc.

Up until today, we’ve used to do this using Firebase as an external database source that knows which user was last used – we even have that in our knowledge base.

While it works well, our purpose is to make the scripts you write shorter and easier to maintain, so we added a new (and simple) environment variable to our tests called RTC_RUN_COUNT. The only thing it does is return the value of an iterator indicating how many times the test has been executed – either as a test or as a monitor.

It is now easy to use by calculating the modulu value of RTC_RUN_COUNT with the number of users you created.

You can learn more about RTC_RUN_COUNT and our other environment variables in our knowledge base.

#2 – Additional information

We had a customer recently who wanted to know within every run of a monitor specific parameters of that run – in his case, it was the part of his infrastructure that gets used during the execution.

He could have used rtcInfo(), but then he’ll need to dig into the logs to find that information, which would take him too long. He needed that when the monitors are running in order to quickly pinpoint the source of failures on his end.

We listened, and added a new script command – rtcSetAdditionalInfo(). Whatever you place in that command during runtime gets stored and “bubbled up” – to the top of test run results pages as well as to the test results webhook. This means that if you connect the monitor to your own monitoring dashboards for the service, you can insert that specific information there, making it easily accessible to your DevOps teams.

Onwards

We will be looking for bugs (and fixing them) around our Firefox implementation, and we’re already hard at work on a totally new product and on some great new analysis features for our test results views.

If you are looking for a solid, managed testing and monitoring solution for your WebRTC application, then try us out.

Monitoring WebRTC apps just got a lot more powerful

As we head into 2019, I noticed that we haven’t published much around here. We doubled down on helping our customers (and doing some case studies with them) and on polishing our service.

In the recent round of updates, we added 3 very powerful capabilities to testRTC that can be used in both monitoring and testing, but make a lot of sense for our monitoring customers. How do I know that? Because the requests for these features came from our customers.

Here’s what got added in this round:

1. HAR files support

HAR stands for HTTP Archive. It is a file format that browsers and certain viewer apps support. When your web application gets loaded by a browser, all network activity gets logged by the browser and can be collected by a HAR file that can later be retrieved and viewed.

Our focus has always been WebRTC, so collecting network traffic information that isn’t directly WebRTC wasn’t on our minds. This changed once customers approached us asking for assistance with sporadic failures that were hard to reproduce and hard to debug.

In one case, a customer knew there’s a 502 failure due to the failure screenshot we generate, but it wasn’t that easy to know which of his servers and services was the one causing it. Since the failure is sporadic and isn’t consistent, he couldn’t get to the bottom of it. By using the HAR files we can collect in his monitor, the moment this happens again, he will have all the network traces for that 502, making it easier to catch.

Here’s how to enable it on your tests/monitors:

Go to the test editor, and add to the run options the term #har-file


Once there and the test/monitor runs next, it will create a new file that can be found under the Logs tab of the test results for each probe:

We don’t handle visualization for HAR files for the moment, but you can download the file and place it on a visual tool.

I use netlog-viewer.

Here’s what I got for appr.tc:

2. Retry mechanism

There are times when tests just fail with no good reason. This is doubly true for automating web UI, where minor time differences may cause problems or when user behavior is just different than an automated machine. A good example is a person who couldn’t login – usually, he will simply retry.

When running a monitor, you don’t want these nagging failures to bog you down. What you are most interested in isn’t bug squashing (at least not everyone) it is uptime and quality of service. Towards that goal, we’ve added another run option – #try

If you add this run option to your monitor, with a number next to it, that monitor will retry the test a few more times before reporting a failure. #try:3 for example, will retry twice the same script before reporting a failure.

What you’ll get in your monitor might be something similar to this:

The test reports a success, and the reason indicates a few times where it got retried.

3. Scoring of monitor runs

We’ve started to add a scoring system to our tests. This feature is still open only to select customers (want to join in on the fun? Contact us)

This scoring system places a test based on its media metrics collected on a scale of 0-10. We decided not to go for the traditional MOS scoring of 1-5 because of various reasons:

  1. MOS scoring is usually done for voice, and we want to score video
  2. We score the whole tests and not only a single channel
  3. MOS is rather subjective, and while we are too, we didn’t want to get into the conversation of “is 3.2 a good result or a bad result?”

The idea behind our scores is not to look at the value as good or bad (we can’t tell either) but rather look at the difference between the value across probes or across runs.

Two examples of where it is useful:

  1. You want to run a large stress test. Baseline it with 1-2 probes. See the score value. Now run with 100 or 1000 probes. Check the score value. Did it drop?
  2. You are running a monitor. Did today’s runs fair better than yesterday’s runs? Worse? The same?

What we did in this release was add the score value to the webhook. This means you can now run your monitors and collect the media quality scores we create and then trendline them in your own monitoring service – splunk, elastic search, datadog, whatever.

Here’s how the webhook looks like now:

The rank field in the webhook indicates the media score of this session. In this case, it is an AppRTC test that was forced to run on simulated 3G and poor 4G networks for the users.

As with any release, a lot more got squeezed into the release. These are just the ones I wanted to share here this time.

If you are interested in a monitoring service that provides predictable synthetics WebRTC clients to run against your service, checking for uptime and quality – check us out.

How Nexmo Integrated testRTC into their Test Automation for the Nexmo Voice API

Nexmo found in testRTC a solution to solve its end-to-end media testing challenges for their Nexmo Voice API product, connecting PSTN to WebRTC and vice versa.

Nexmo is one of the top CPaaS vendors out there providing cloud communication APIs to developers, enabling enterprises to add communication capabilities into their products and applications.

One of Nexmo’s capabilities involves connecting voice calls between regular phone numbers (PSTN) to browsers (using WebRTC) and vice versa. This capability is part of the Nexmo Voice API.

Testing @ Nexmo

Catering to so many customers with ongoing deployments to production means that Nexmo needs to take testing seriously. One of the things Nexmo did early on was introduce automated testing, using the pytest framework. Part of this automated testing includes a set of regression tests –  a huge amount of tests that provide very high test coverage. Regression tests get executed whenever the Nexmo team has a new version to release, but these tests can also be launched “on demand” by any engineer, they can also be triggered by the Jenkins CI pipeline upon a merge to a particular branch.

At Nexmo, development teams are in charge of the quality of their code, so there is no separate QA team.

In many cases, launching these regression tests first creates a new environment, where the Nexmo infrastructure is launched dynamically on cloud servers. This enables developers to run multiple test sessions in parallel, each in front of their own sandboxed environment, running a different version of the service.

When WebRTC was added to Nexmo Voice API, there was a need to extend the testing environment to include support for browsers and for WebRTC technology.

On Selecting testRTC

“When it comes to debugging, when something has gone wrong, testRTC is the first place we’d go look. There’s a lot of information there”

Jamie Chapman, Voice API Engineer at Nexmo

Nexmo needed WebRTC end-to-end tests as part of their regression test suite for the Nexmo Voice API platform. These end-to-end tests were around two main scenarios:

  1. Dialing a call from PSTN and answering it inside a browser using WebRTC
  2. Calling a PSTN number directly from a browser using WebRTC

In both cases, their client side SDKs get loaded by a web page and tested as part of the scenario.

Nexmo ended up using testRTC as their tool of choice because it got the job done and it was possible to integrate it into their existing testing framework:

  • The python script used to define and execute a test scenario used testRTC’s API to dynamically create a test and run it on the testRTC platform
  • Environment variables specific to the dynamically created test environment got injected into the test
  • testRTC’s test result was then returned back to the python script to be recorded as part of the test execution result

This approach allowed Nexmo to integrate testRTC right into their current testing environment and test scripts.

Catering for Teams

The Voice API engineering team is a large oneAll these users have access to testRTC and they are able to launch regression tests that end up running testRTC scripts as well as using the testRTC dashboard to debug issues that are found.

The ability to have multiple users, each with their own credentials, running tests on demand when needed enabled increased productivity without dealing with coordination issues across the team members. The test results themselves get hosted on a single repository, accessible to the whole team, so all developers  can easily share faulty test results with the team .

Debugging WebRTC Issues

Nexmo has got regression testing for WebRTC off the ground by using testRTC. It does so by integrating with the testRTC APIs, scheduling and launching tests on demand from Nexmo’s own test environment. The tests today are geared towards providing end-to-end validation of media and connectivity between the PSTN network and WebRTC. Validation that testRTC takes care of by default.

When things break, developers check the results collected by testRTC. As Jamie Chapman, Voice API engineer at Nexmo said: “When it comes to debugging, when something has gone wrong, testRTC is the first place we’d go look. There’s a lot of information there”.

testRTC takes screenshots during the test run, as well as upon failure. It collects browser logs and webrtc-internals dump files, visualizing it all and making it available for debugging purposes. This makes testRTC a valuable tool in the development process at Nexmo.

On the Horizon

Nexmo is currently making use of the basic scripting capabilities of testRTC. It has invested in the API integration, but there is more that can be done.

Nexmo are planning to increase their use of testRTC in several ways in the near future:

11

How do WebRTC Media Servers Behave on Packet Loss?

Differently from each other.

Whenever I see people comparing WebRTC media servers, they tend to focus on scale:

– How many sessions can you cram in parallel?

– How many streams can you serve from a single machine?

– How much bitrate can you pump out?

All of these are very important questions – they end up in your sizing calculation that then go into your pricing model for your service. Oh, and we did cover this a bit here when talking about handling WebRTC browsers synchronization at scale.

Now that our new version is taking shape (still in staging, so if you want access – ping us), it is time to play a bit with a few new toys we’ve added for our beloved community of sadists (you may know them as test engineers, but the good ones are sadists – they like inflicting pain upon digital products and services).

What I am talking about here is a combination of two script commands we have:

  1. rtcEvent() – place a vertical event in the graphs
  2. rtcSetNetworkProfile() – change network profiles in runtime

You’ll see how it looks in a second.

What Packet Loss Does?

Packet loss is bad.

You don’t control it. And it can happen at any time. Come and go as it pleases.

The moment you have packet loss, there will be some degradation in the quality of the media. Lost packets means lost data. Means can’t playback something. It might be minor. It might be important.

Next thing that happens? WebRTC (or most other VoIP products for that matter) will start lowering bitrates. Why? Because it assumes there’s congestion on the network, and it is trying to play nice with everyone.

But what happens once that packet loss is gone? Does things go back to normal? And if they do, then how fast will that happen?

My Experiment

I decided to devise a simple enough experiment to get some answers here. I chose the following steps:

  1. Connect to a service
  2. Run for a full minute
  3. Set packet loss to 10% for a full minute
  4. Go back to normal – no packet loss
  5. Wait two minutes

That’s it. What I am interested in is less of what happens during the second minute, but more what happens in the last two minutes, and how that is different than what we have in the first minute of the session.

In general, I decided to place 5 users in the same session, to get that media server working a bit. And I also decided to focus on the SFU kind.

The services I tinkered with are:

  1. AppRTC, just as a baseline for this exercise
  2. Janus, an open source media framework, that can act as an SFU
  3. Jitsi Videobridge, an open source SFU
  4. mediasoup, a relatively new open source SFU
  5. SwitchRTC, a commercial SFU
  6. appear.in, a service that recently added its own self-developed SFU (in beta at the moment)

If you are looking for Kurento or other SFUs – they weren’t included not because I didn’t want to, but because there was no readily available installation out there that I could just use.

I’ll be happy to add more SFUs to the comparison, so give us a shout out if you want to run such an analysis.

Let the fun begin.

AppRTC – My Favorite Baseline

For our baseline, I decide to use AppRTC.

This time, I had to use only 2 browsers, as AppRTC doesn’t support any group calling capabilities.

What it does do is offer the vinyl WebRTC experience.

I started with writing a simple script to fit my needs:

var roomUrl = process.env.RTC_SERVICE_URL + "testRTC" + process.env.RTC_SESSION_IDX + '?vsc=VP8';

var agentType = Number(process.env.RTC_IN_SESSION_ID);
var recuperationTime = 60; // in seconds

client
   .rtcInfo(roomUrl)
   .rtcProgress('open ' + roomUrl)
   .url(roomUrl)
   .waitForElementVisible('body', 60000)
   .pause(2000)
   .click('#confirm-join-button')
   .waitForElementVisible('#videos', 20000)
// Minute 1
   .pause(recuperationTime * 500)
   .rtcScreenshot('Phase 1')
   .rtcProgress('Phase 1')
   .pause(recuperationTime * 500);

// Minute 2
   if (agentType === 1) {
   client
       .rtcEvent('10% Packet Loss start', 'global')
           .rtcSetNetworkProfile('custom', 'packet loss', 10, 'both', 'both'); // 10% packet loss
   }

client
   .pause(recuperationTime * 500)
   .rtcScreenshot('Phase 2')
   .rtcProgress('Phase 2')
   .pause(recuperationTime * 500)

   if (agentType === 1) {
    client
       .rtcSetNetworkProfile('') // back to pristine network conditions
       .rtcEvent('10% Packet Loss End', 'global');
   }

// Minute 3-4
client
   .pause(recuperationTime * 1000)
   .rtcScreenshot('Phase 3')
   .rtcProgress('Phase 3')
   .pause(recuperationTime * 1000);

A few things to note here:

  1. All test scripts on this post can be found on our github account. Easiest way to use them is to import them into your testRTC account
  2. I decided to force VP8 here. VP9 is erratic a bit in its bitrate so I wanted to go for VP8 – hence the addition of ‘?vsc=VP8’ in the first line of this script (check out all of AppRTC’s parameters here)
  3. When the second minute is up, the first probe in each session will generate a global rtcEvent and set packet loss in both directions to 10% (look at lines 23-27)
  4. After an additional second is over, the first probe in each session will generate another global rtcEvent and remove all packet loss and network constraints that might have been used (look at lines 35-39)

Running that using testRTC yields these results once you drill into one of these sessions:

Above you see two things:

  1. The green vertical lines – these are the result of the rtcEvent() calls
  2. The blue and red bars, showing incoming and outgoing packet loss percentage, which averages at 10%

Above you see the video bitrate graph, with the two horizontal lines on it.

Notice how the outgoing bitrate tries going up in the beginning and then drops from 2.5mbps to 1mbps in 60 seconds?

The other thing that interest me is the time it takes for WebRTC/AppRTC to get back to 2.5mbps. And that’s somewhere in the range of 15-20 seconds.

Oh, and because I know you’ll be interested in this – also remember this screenshot of the video average delay we had:

Before we move on to the media servers – remember that what I tried doing with AppRTC is provide a baseline. And the baseline here is “picture perfect”. I didn’t really expect any of the SFUs that I’ve used to be able to match AppRTC with its metrics.

Janus

Janus is an open source media server created and maintained by Meetecho.

They have an online demo running that supports a simple video room.

So we just hooked our script on top of that to get the results we needed. We aimed for 5 browsers in a single room – which will be the norm from now on in this article.

The Janus demo has somewhat of a single room, and I had to end up with a J3rry user in there, though he seemed harmless with no camera or bitrate in my session.

You can see above that the bitrates are rather low – around 140 kbps for each video stream coming into this room. And that’s even before I started adding packet loss.

During packet loss and after it, we “lost” two participants. Here’s a screenshot taken a minute after I stopped packet loss altogether:

The graphs in testRTC show a grim picture:

Janus reports packet losses at higher intervals than what WebRTC does, which is why we see the spikes on the outgoing reporting that go up to 50% and more. The weird thing is the two incoming channels that show around 10% of packet loss as well. Which is weird – more about this later.

Here’s how video bitrates look like for some of the streams (one outgoing and two incoming):

No change even though we have packet loss.

And here’s what happens in the two other incoming streams:

Apparently, these two incoming streams are the ones showing packet loss from the start. They somehow decided to drop to 0 the moment we cranked up the artificial packet loss from 0 to 10% – but never recuperated from it.

Looking at the average delay for the video…

Things can’t be good, but seems like this has nothing to do with my packet loss shenanigans.

It might be Janus and it might just be the demo machine. If I could, I’d reboot it and start all over again.

Jitsi

For me the Jitsi Videobridge is where I go first to run demos and tests on an SFU with testRTC:

  • It is out there
  • It is easy to automate
  • And I am a creature of habit…

To run our test here, we’ve directed 5 of our probes into a single room on the Jitsi meet online service/demo.

After a few attempts, I decided it would be better to disable simulcast, using this prefix to the URL: ‘#config.disableSimulcast=true’. I didn’t do it because simulcast is a bad thing, but because it made analyzing the results much harder for what I had in mind.

If we look at the packet loss graph, it will tell a similar story to what we’ve seen so far:

While there are some packet losses out of the one minute killzone I created, they are negligible (or at least sporadic). That negative values you see for packet losses in the red color? They are reports of the browser’s outgoing stream from the machine we induced packet loss on. This is most probably related to a Chrome bug (HT to Philipp Hancke).

I’ve split the video bitrate graphs here into two graphs – the outgoing one and the incoming ones since they tell two separate stories.

This one caught me by surprise – the outgoing bitrate shows no signs of a change due to packet loss. I wonder what Jitsi is doing (or not doing) to have packet loss ignored in such a way. So I decided to look at it from the receiving end of one of the other four browsers in the same session:

Bitrate drops to 0 for a duration of almost a full minute before coming back up.

Back to the browser with the trashed network, let’s see what happens to the incoming video streams:

Things drop down from around 2mbps to almost 0 on all incoming channels, taking around 40-60 seconds to get back to normal.

One last glance before we move on – check out video average delay:

Jitsi had some hard time recuperating from that packet loss.

It should be noted that I’ve played around with Jitsi before their recent updates – especially the ones including adaptivity.

Mediasoup

mediasoup is a rather new player in the open source SFU space. It is built in C++ as a Node.js module. After a quick Twitter chat, Iñaki Baz Castillo was kind enough to configure it to my needs (specifically, allowing for more bandwidth on the online demo).

Starting as always with packet loss:

The graph seems fine. Percentages are low because of the way packet losses are reported back from the media server. Probably some FEC / retransmissions are involved as well (this would be the case with many of the media servers out there).

Looking at the video bitrate, we see an interesting picture:

There’s a hiccup in the outgoing bitrate (the red line), but that for some reason takes place close to the end of the 60 seconds packet loss window.

There’s also a reduction in incoming bitrate for one of the video stream. It starts around 20 seconds into the packet loss zone, but it doesn’t recover even when we remove the packet losses.

Video delay is also a bit problematic:

It starts off nicely, goes up when packet losses start and never recuperates.

SwitchRTC

Moving on from open source to commercial, there’s SwitchRTC.

It started by me asking for a 2mbps bitrate limit. Now, the way this was set up and without simulcast, it meant the browser is going to need to encode 2mbps and decode 4 streams of 2mbps each. This turned out to be a bit too much for the way we configure our machines (and frankly – probably too much for almost any use case you plan on deploying when it comes to assuming what your typical customer may have).

The end result of it was graphs that went all over the place – each stream and each browser tried hard to compete on resources that were limited, and it wasn’t really nice.

So we dialed back down to 1mbps bitrate limit.

As always, let’s first look at the packet loss graph:

Two things here to note:

  1. One of the incoming video streams has packet losses outside the packet loss zone. Not unheard of, but a bit off the charges compared to others. I think that is due to the data centers used by SwitchRTC for this demo
  2. There’s negative packet losses on the outgoing video stream. This is due to the way SwitchRTC handles packet loss reporting (or more likely filtering packet loss reporting)

For bitrate, I took two screenshots. One for the incoming video streams and one for the outgoing video stream.

On the incoming stream we see an interesting phenomena.

When packet loss starts, bitrate picks up, most likely to overcome the packet loss. It makes sense, since we didn’t limit bitrates, so that seems like the correct strategy. Would be interesting to see what will happen if we limit bitrate as well.

The second thing, is that we have one of the incoming stream dropping down to almost zero and then picking up again. This is the same stream that shows high packet losses. I wonder what causes that.

The graph above shows the outgoing video stream. This is almost textbook behavior for the outgoing video. Once it notices there’s issues, it starts increasing bitrate to compensate, and when that fails – it drops down slowly. It is similar, though not as smooth as what you see with AppRTC.

appear.in

appear.in have a beta SFU, which Philipp Hancke was kind enough to let me use.

Now, appear.in isn’t a media server or a component you can use in your own service – it is a full service, which makes this comparison a bit unfair – checking demos and comparing them to a commercial service.

But then I wanted to check this one out, as it isn’t based on any external framework – it was self developed in house at appear.in

The results are interesting.

Packet loss graph looks rather nice, if a tad low in the percentage:

This shows how far appear.in goes in gauging and polishing the way they make use of network resources.

Video bitrate stays at the 600kbps vicinity – not showing any real effects from my additional packet loss:

Best part though is that the video delay graph doesn’t look erratic:

I am not sure how to compare these results to the rest. I will need more time to check this out – time that I just didn’t have available for this experiment of mine. I will leave it for some future tinkering.

Summing things up

Different media servers will act differently. Especially when putting them under different network conditions.

What I wanted to show here, is how you can use testRTC to goof around with whatever setting you want. Here are a few other ideas:

  1. Drop the network down to 0 bitrate. Wait a bit. Put it back up. Did media return? How quickly did it come up again?
  2. Limit bitrates to different levels. Check if your media server adapts things like resolutions and other interesting parameters to fit the needs
  3. Go down to 50 or 100 kbps. Does video persist or is the media server shutting it down in favor of audio?
  4. Limit bitrate and add a bit of packet loss at the same time (this would be closest to real life). See what happens then – how will the media server behave?
  5. Do the above while adding some load on the server. Does it start fidgeting or is it handling this nicely?

A few things to remember here:

This isn’t an apples to apples comparison

I haven’t taken each and every media server and installed it on my own on the same server configuration. I just used the online demos each of these vendors had. At times, asking for assistance and a bit of configuration from the vendor.

What was different:

  • The server(s) the media server was installed on
  • The configuration of the server, especially what max bitrate it allows

What was similar:

  • I tried disabling simulcast in all servers. Assume that’s a bad thing to do, but I wanted a level playing field on that front
  • The browser used. It was the same for all tests. This includes their version, the machine they were installed on, the network they used, their geographical location – everything
  • The scenario itself. I essentially executed the same scenario over and over again in front of different media servers

Where do we go from here?

Media servers are hard to develop. They are hard to tweak and optimize. And they are hard when it comes to making sizing decisions with them.

They are also pretty good. Most of the ones shown here are running in production services with live customers.

When you go tomorrow to pick the media server for your own project. Or when you want to plan how to size capacities per machine. Or if you want to check your media server in real life scenarios – we’ve got your back.

Check us out. I am sure we can be of help to you.

9

The Missing chrome://webrtc-internals Documentation

There’s a wealth of information tucked into the chrome://webrtc-internals tab, but there was up until recently very little documentation about it. So we set out to solve that, and with the assistance of Philipp Hancke wrote a series of articles on what you can find in webrtc-internals and how to make use of it.

The result? The most up to date (and complete) webrtc-internals documentation.

To make sure it doesn’t get lost, here are the links to the various articles:

  1. webrtc-internals and getstats parameters – a detailed view of webrtc-internals and the getstats() parameters it collects
  2. active connections in webrtc-internals – an explanation of how to find the active connection in webrtc-internals – and how to wrap back from there to find the ICE candidates of the active connection
  3. webrtc-internals API trace – a guide on what to expect in the API trace for a successful WebRTC session, along with some typical failure cases

Enjoy!

1

Your best WebRTC debugging buddy? The webrtc-internals API trace

This time, we take you through the webrtc-internals API trace to see what can you learn from it.

To make this article as accurate as possible, I decided to go to my source of truth for the low level stuff related to WebRTC – Philipp Hancke, also known as fippo or hcornflower. This in a way, is a joint article we’ve put together.

Before we do, though, you should probably check out the other articles in this series:

  1. Parameter’s meaning in webrtc-internals
  2. Finding the current active connection in webrtc-internals

Now back to the API trace.

WebRTC is asynchronous

Here’s something you probably already noticed. WebRTC is asynchronous to the extreme. It almost painstakingly makes sure that whatever you are trying to achieve – you won’t be able to without multiple calls in different contexts of your JavaScript app in the browser.

It isn’t because the authors of WebRTC are mean. It is because the nature of communications is asynchronous. It is made worse by the various network topologies that require the use of curses like STUN, TURN and ICE and by the fact that we require the user to authorize things like accessing his camera.

This brings us to the tricky situation of error handling. With WebRTC, it takes place everywhere. Anything you do can fail twice:

  1. When you call the API and it returns
  2. When the callback/promise/event handler/whatever returns back with the result of your API call

This means that in many cases, you are going to be left with a half baked solution that looks at some of the error cases (did you ever see a sample that takes care of edge cases or failure scenarios?).

It also means that often times you’ll need to be able to debug them. And that’s what the API trace in webrtc-internals can help you with.

The webrtc-internals API trace

If you open chrome://webrtc-internals while in an active WebRTC session, you will immediately see the API trace:

WebRTC API trace sample

This is the list of API calls and events done on the peer connection, informing you of the progress and state of the connection.

You can click on any of these APIs to see its parameters.

WebRTC API trace click to expand

Before we look at what kind of analysis we can derive from these traces, let’s look at what some of the connection methods and events do.

    • addStream: if this method was called, the Javascript code has added a MediaStream to the peerconnection. You can see the id of the stream as well as the audio and video tracks. onAddStream shows a remote stream being added, including the audio and video track ids, it is called between the setRemoteDescription call and the setRemoteDescriptionOnSuccess callback
    • createOffer shows any calls to this API including the options such as offerToReceiveAudio, offerToReceiveVideo or iceRestart. createOfferOnSuccess shows the results of the createOffer call, including the type (which should be ‘offer’ obviously) and the SDP resulting from it. createOfferOnFailure could also be called indicating an error but that is quite rare
    • createAnswer and createAnswerOnSuccess and createAnswerOnFailure are similar but with no additional options
    • setLocalDescription shows you the type and SDP used in the setLocalDescription call. If you do any SDP munging between createOffer and setLocaldescription you will see this here. This results in either a setLocalDescriptionOnSuccess or setLocalDescriptionOnFailure callback which shows any errors. The same applies to the setRemoteDescription and its callbacks, setRemoteDescriptionOnSuccess and setRemoteDescriptionOnFailure
    • onRenegotiationNeeded is the old chrome-internal name for the onnegotiationneeded event. If your app uses this you might want to look for it
    • onSignalingStateChange shows the changes in the signaling state as a result of calls to setLocalDescription and setRemoteDescription. See the wonderful diagram in the specification for the gory details. At the end of the day, you will want to be in the stable state most of the time
    • iceGatheringStateChange is the little brother of the ice connection state. It will show you the state of the ice gatherer. It will change to gathering after setLocalDescription if there are ICE candidates to gather
    • onnicecandidate events show all candidates gathered, with information for which m-line and MID. Likewise, the addIceCandidate method shows that information from the other side. Typically you should see both event types. See below for a more detailed discussion of these events
    • oniceconnectionstate is one of the most important event handlers. It tells you whether a peer-to-peer connection succeeded or not. From here, you can start searching for the active candidate as we explained in the previous post

The two basic flows we can see are that of something offering connections and answering. The offerer case will typically consist of these events:

WebRTC API Trace - offer side

  • (addStream if the local side wants to send media)
  • createOffer
  • createOfferOnSuccess
  • setLocalDescription
  • setLocalDescriptionOnSuccess
  • setRemoteDescription
  • (onaddstream if the remote end signalled media streams in the SDP)
  • setRemoteDescriptionOnSuccess

While the answerer case will have:

WebRTC API Trace - answer side

  • setRemoteDescription
  • (onaddstream if the remote end signalled media streams in the SDP)
  • createAnswer
  • createAnswerOnSuccess
  • setLocalDescription
  • setLocalDescriptionOnSuccess

In both cases there should be a number of onicecandidate events and addIceCandidate calls along with signaling and ice connection state changes.

Let us look at two specific cases next.

Example #1 – My WebRTC app works locally but not on a different network!

This is actually one of the most frequent questions on the discuss-webrtc list or on stackoverflow. Most of the time the answer is “you need a TURN server” and “no, you can not use some TURN server credentials that you found somewhere on the internet”.

So it works locally. That means that you are creating an offer, sending it to the remote side, calling setLocalDescription() and are getting an answer that you feed into setRemoteDescription(). It also means that you are getting candidates in the onicecandidate() event, sending them to the remote side and getting candidates from there which you call the addIceCandidate() method with.

And locally you get a oniceconnectionstatechange() event to connected or completed:

WebRTC API trace - ICE state changes

Great! You probably just copied and pasted these pieces of code from somewhere on github.

Now… why does it not work when you’re on a different network? On different networks, you need both a STUN and a TURN server. Check if your app is using a STUN and TURN server and that you’re passing them correctly at the top of webrtc-internals:

NAT configuration in webrtc-internals

As you can see (assuming you have good eyes), there are a number of ice servers used here. In the case of our screenshot, it’s Google’s apprtc sample. There is a stun server, stun:stun.l.google.com:19302. There are also four TURN servers:

  1. turn:64.233.165.127:19305?transport=udp
  2. turn:[2A00:1450:4010:C01::7F]:19305?transport=udp
  3. turn:64.233.165.127:443?transport=tcp
  4. turn:[2A00:1450:4010:C01::7F]:443?transport=tcp

As you can see, apprtc uses TURN over both UDP and TCP and is running TURN servers for both IPv4 and IPv6.

Now just because you configured a TURN server does not mean there won’t be any errors. The TURN server might not be reachable. Or your credentials might not work (this will happen if you “found” the credentials on a list of “free public servers”). In order to verify that the STUN and TURN servers you use actually work you need to look at the onicecandidate() events.

If you use a STUN or a TURN server, you should see a onicecandidate() event with a candidate that has a ‘typ srflx’.

Similarly, if you use a TURN server, you need to check if you get an onicecandidate() event where the candidate has a ‘typ relay’.

Note that Chrome stops gathering candidates once it establishes a connection. But if your connection gets established you are probably not going to debug this issue.

If you get both of these you’re fine. But you also need to check what candidates your peer sent you with which addIceCandidate() was called.

Example #2 – The network is blocking my connection

Networks that block UDP traffic are quite common. TURN/TCP and TURN/TLS (as well as ICE-TCP even though we mention this mostly to make Emil Ivov happy) provide a way to enable calls even on those networks. This has some effect on the media quality as we discussed previously but let us see how we can detect whether we are on a network that is blocking UDP traffic to begin with.

If you want to follow along, open webrtc-internals and the webrtc candidate gathering demo page and start gathering. By default, it uses one of Google’s STUN servers. To keep things simple, uncheck the “gather IPv6 candidates” and “gather RTCP candidates” boxes before clicking on the “gather candidates” button:

Uncheck ICE gathering candidates

On webrtc-internals you will see a createOffer call with offerToReceiveAudio set to true (this is to create an m-line and gather candidates for it):

WebRTC ICE gathering receive audio

Followed by a createOfferOnSuccess and a setLocalDescription call. After that there will be a couple of onicecandidate events and an icegatheringstatechange to completed, followed by a stop call.

There should be an onicecandidate with a candidate that has a “typ srflx” in it:

ICE candidate types

It shows your public ip. If you don’t get such a candidate but only host candidates, either the STUN server is not working (which in the case of Google’s STUN server is somewhat unlikely) or your network is blocking UDP.

Now block UDP on your network (but mind you, do not block port 53 for DNS). If you don’t know a quick way to block UDP, lets try to simulate that by changing the stun server to something that will not respond, in this case Google’s well-known DNS server running at 8.8.8.8:

Fudging STUN configuration for WebRTC

Click “gather candidates” again. After around 10 seconds you will see a gathering state change to completed in webrtc-internals. But you will not see a server-reflexive candidate:

ICE negotiation with no STUN connectivity

You can try the same thing with a TURN UDP server. Make sure your credentials are valid (again, the “public TURN server list” is not a thing). This will show both a srflx and a relay candidate.

One of the nice tricks you can do here is to change the password to something invalid. Then you will only get a srflx but no relay candidate. Which is a nice and easy way to detect if your credentials are invalid — the candidates page even suggests this.

You can repeat this with TURN/TCP and TURN/TLS servers. You can even add all kinds of TURN servers and then use the priority trick we have shown in the last blog post to figure out from which servers you gathered candidates.

If you don’t get anything but host candidates you might be on a network which blocks both UDP traffic and is successful at blocking TURN/TCP and TURN/TLS. One scenario where that might happen currently is if there is a proxy that requires authentication which is not yet supported by Chrome.

Now let us take a step back. When is this useful? In a real-world scenario you will want to run with all kinds of STUN and TURN servers, otherwise you will get high failure rates. If you need to debug a failure to establish a connection, you should look for the onicecandidate and addIceCandidate events. They will allow you to figure out if the local or remote client was on a network that blocked it from establishing a connection to any peer outside the network.

What’s next?

So this time around, we’ve focused on the API traces:

  • We’ve acquainted with the fact that this is something that webrtc-internals does us a great service just by capturing all of these WebRTC API calls
  • We even went through the typical API calls and flows that are expected to appear in the WebRTC API trace
  • We’ve looked at two examples where the WebRTC API trace can help us debug the problems we’re seeing (there are more)
    • #1 – misconfiguration of NAT traversal servers
    • #2 – network blocking and the forgotten TURN/TCP configuration

We’re not done yet with this series. We still have one or more articles in the pipeline to close the basics of what webrtc-internals got up its sleeves.

If you are interested in keeping up with us, you might want to consider subscribing.

Huge thanks for Fippo in assisting with this series!

6

How do you find the current active connection in webrtc-internals?

Today, we want to help you find the current active connection in webrtc-internals.

To make this article as accurate as possible, I decided to go to my source of truth for the low level stuff related to WebRTC – Philipp Hancke, also known as fippo or hcornflower. This in a way, is a joint article we’ve put together.

Before we do, though, make sure that you know what the parameters in chrome://webrtc-internals mean.  If you don’t, then you should start with our previous article, which explains the meaning of the parameters in webrtc-internals (and getstats).

First things first:

Why is this of any importance?

While you can always go and check the statistics on your connection and channels, there are times when what you really want to do is understand HOW you got connected.

WebRTC allows connections to take one of 3 main routes:

  1. Direct P2P
  2. By making use of STUN (to find a public IP address)
  3. By making use of TURN (to relay all of your media through it)

WebRTC connection types

Which one did you use for this connection? Did this call end up going via TURN over TCP?

There are two times when this will be useful to us:

  1. When trying to understand what occurred in this call, how the ICE negotiation took place, which candidate ended up being used, did we need to renegotiate or switch between candidates – we need to know how to find the active connection
  2. When we want to know this programmatically – especially if we are collecting these WebRTC stats and trying to ascertain the test results from it or how our network behaves in production with live users

What is an active connection in WebRTC?

WebRTC uses the ICE protocol (described in RFC 5245 if you are really keen on the details) to find a way to connect two peers which may be behind NAT routers. To establish a connection, each peer gathers a number of candidates.

There are host candidates which represent local ip addresses and ports. These have a “typ host” when you expand the onicecandidate or addIceCandidate events in webrtc-internals.

onIceCandidate

Similarly, there are serverreflexive candidates where the peer asked a STUN server for its public ip address. These will have a “typ srflx” and an additional raddr field that shows the local ip address where this originated.

Last but not least there are relay candidates. Here, the peer asked a TURN server to open a port and relay traffic. These will show up in the onicecandidate and addIceCandidate with a “typ relay”. To make things more difficult, WebRTC clients can use either UDP, TCP or TLS to connect to the TURN server.

Let’s assume that you see a number of onicecandidate and addIceCandidate calls in webrtc-internals. There are conditions where this does not happen but typically WebRTC will use a technique known as “trickle ice”.

Once candidates have been exchanged, the WebRTC engine forms pairs of local and remote candidates and starts sending STUN packets to check if it gets a response. While the details of this are very much hidden from the application we can observe what is going on in webrtc-internals (and the getStats() API).

TURN in wireshark

The screenshot above was taken from Wireshark, a tool that can be used to sniff the local network. It shows a TURN message flowing in a session during the connection setup stage.

How do we find the current active connection in webrtc-internals?

Open one of the WebRTC samples that establishes a local peer-to-peer connection, mute your speaker and start a call. Also open chrome://webrtc-internals. Now let’s see if we can find out together the active connection.

Now that we’re running the “local peer-to-peer connection” sample off the WebRTC samples repository, there’s something to remember – it does not use STUN and TURN servers, so the number of candidates exchanged will be quite small. We’ve selected it on purpose, so we won’t have so much clutter to go over. What you will see is just four candidates in the onicecandidate event of the first connection (because of some rules about rtcp-mux and BUNDLE) and a single candidate in the addIceCandidate event.

An active connection in webrtc-internals

Now which of those candidate pairs is used? Fortunately webrtc-internals gives up a hint by showing the active candidate pair in bold. Typically the id of this will be Conn-audio-1-0 (with BUNDLE, the same candidate pair and connection is used also for the video). Let’s expand this and see why it is marked as bold:

WebRTC active connection statistics

The most important thing here is the googActiveConnection attribute which is true for the currently active connection and false for all others. We see quite a number of attributes here and while some of them have been discussed in the previous post let us repeat what we see here:

  1. bytesReceived, bytesSent and packetsSent specify the number of bytes and packets sent over this connection. packetsReceived is still MIA but since it is not part of the specification that probably will not change anymore
  2. googReadable specifies whether STUN packets were received on this pair, googWritable whether responses were sent. These google properties have been replaced by the requestsReceived, responsesSent, requestsReceived and responsesSent standard counters
  3. googLocalAddress and googRemoteAddress show the local IP and port. This is quite useful if you need to correlate the information in webrtc-internals with a Wireshark dump. googLocalCandidateType and googRemoteCandidateType give you more information about whether this was a local, serverreflexive or relayed candidate
  4. localCandidateId and remoteCandidateId give you the names of the local and remote candidate statistics. These allow you to get even more details

Lets search for the local and remote candidates specified in the localCandidateId and remoteCandidateId fields. Again this is pretty easy since there is only a single candidate pair.

WebRTC connection candidates

Despite having a different type (localcandidate and remotecandidate; the specification changed this slightly to local-candidate and remote-candidate; we imagine there was a lengthy discussion about the merits of the hyphen), the information in both candidates is the same:

  • the ipAddress is where packets are sent from or sent to
  • the networkType allows you to figure out the type of the network interface
  • the portNumber gives you the port that packets are sent to or from
  • the transport specifies the transport protocol of the candidate as shown in the candidate line. Typically this will be udp unless ICE-TCP is used
  • the candidateType shows whether this is a host, srflx, prflx or relay candidate. See the specification for further details
  • the priority is the priority of the candidate as defined in RFC 5245

The most interesting field here is the priority. When the implementation following the definition of the priority from RFC 5245, the highest 8 bit specify the type preference (= you’ll need to shift the priority attribute right >> 24 bits). This is of particular interest since for local candidates with a candidateType relay we can figure out the transport used between the client and the TURN server. Chrome uses a type preference of 2 for relay candidates allocated over TURN/UDP, 1 for TURN/TCP and 0 for TURN/TLS. Calculating priorities this way means that relayed connections will have a lower priority than any non-relayed candidates and that TURN servers will only be used as a fallback. As we have described previously, using TURN/TCP (or TURN/TLS) changes the behaviour of the WebRTC quite drastically. If you find this hard to understand do not worry, the specification is currently updated to address this!

What happens during an ICE restart?

So far we have been using a very simple example. Let’s make things more complicated with one of Philipp’s favorite topics, ICE restarts. Navigate away from the previous sample and go to this sample. Make a call. You will see an active candidate pair on chrome://webrtc-internals. Click on the “Restart ICE” button. Note how the data on the candidate pair Conn-audio-1-0 has changed, the ip addresses have changed and the STUN counters have been reset. And the data we have seen previously is now (usually) on a report with the identifier Conn-audio-1-1. The candidate pair is not used any longer but will stick around in getStats (and consequently webrtc-internals).

This is somewhat unexpected (and lead to filing an issue). It seems like the underlying webrtc.org library is renaming the reports in a way such that the active candidate always has the id Conn-audio-1-0. It has behaved like this for ages but this has some disadvantages. Among other things, it is not safe to assume that the number of bytesSent will always increase as it could reset, similar to a bug resetting the bytesSent counters on the reports with a type of ssrc that we have seen in the last post.

What’s next?

What have we learned so far?

  1. The meaning of parameters in webrtc-internals and getstats
  2. Active connections in WebRTC
    1. We saw why knowing and understanding the active connection is important (mainly for debugging purposes)
    2. We then went to look at how we find an active connection (it is in bold, and it’s googActiveConnection attribute is set to true
    3. We also reviewed the interesting attributes we can find on an active connection.
    4. We then linked back the active connection to its candidate pair using the candidates id’s, and found out the candidate type from it
    5. We even learned how to find over what transport protocol a candidate is allocated on a TURN server

We’ve only just started exploring webrtc-internals, and our plan is to continue working on them to create a series of articles that will act as the knowledge base around webrtc-internals.

If you are interested in keeping up with us, you might want to consider subscribing.

Huge thanks for Fippo in assisting with this series!

18

What do the Parameters in webrtc-internals Really Mean?

To make this one as accurate as possible, I decided to go to my source of truth for the low level stuff related to WebRTC – Philipp Hancke, also known as fippo or hcornflower. This in a way, is a joint article we’ve put together.

webrtc-internals is a great tool when you need to find issues with your WebRTC product. Be it because you are trying to test WebRTC and need to debug an issue or because you’re trying to tweak with your configuration.

How to obtain a webrtc-internals stats dump?

If you aren’t familiar with this tool, then open a WebRTC session in your Chrome browser, and while in that session, open another tab and direct it to this “internal” URL: chrome://webrtc-internals/

WebRTC Internals screenshot

Do it. We will be here waiting.

webrtc-internals allows downloading the trace as a large JSON thingy that you can layer look at, but when you do, you’ll see something like this:

WebRTC internals downloaded as JSON

Visualizing webrtc-internals stats

One of the first thing people start asking is – what exactly do these numbers say? It is what one of our own testers said the moment we’ve taken the code Fippo contributed to the community that enables shoving all these values into a time series graph and filtering them out.

This gives us graphs which are much larger than the 300×140 pixels from webrtc-internals:

Sample graph of WebRTC stats

The graphs are made using the HighCharts library and offer quite a number of handy features such as hiding lines, zooming into an area of interest or hovering to find out the exact value. This makes it much easier to reason about the data than the JSON dump shown above.

Back to the basic webrtc-internals page. At the top of this page we can see a number of tabs, one for all getUserMedia calls and one tab for each RTCPeerConnection.

Tabs in webrtc-internals

On the GetUserMedia Requests tab we can see each call to getUserMedia and the constraints passed to it. We don’t get to see the results unfortunately or the ids of the MediaStreams acquired.

RTCPeerConnection stats

For each peerconnection, we can see four things here:

webrtc-internals page structure

  1. How the RTCPeerConnection was configured, i.e. what STUN and TURN servers are used and what options are set
  2. A trace of the PeerConnection API calls on the left side. These API traces show all the calls to the RTCPeerConnection object and their arguments (e.g. createOffer) as well as the callbacks and event emitters like onicecandidate.
  3. The statistics gathered from the getStats() API on the right side
  4. Graphs generated from the getStats() API at the bottom

The RTCPeerConnection API traces are a very powerful tool that allows for example reasoning about the cause of ICE failures or can give you insights where to deploy TURN servers. We will cover this at length in a future blog post.

The statistics shown on webrtc-internals are the internal format of Chrome. Which means they are a bit out of sync with the current specification, some names have changed as well as the structure. At a high level, what we see on the webrtc-internals page is similar to the result we get from calling

RTCPeerConnection.getStats(function(stats) { console.log(stats.result()); )};

This is an array of (legacy) RTCStatsReport objects which have a number of keys and values which can be accessed like this:

RTCPeerConnection.getStats(function(stats) {

   var report = stats.result()[0];

   report.names().forEach(function(name) {

       console.log(name, report.stat(name));

   });

)}

Keep in mind that there are quite a few differences between these statistics (which chrome currently exposes in getStats) and the specification. As a rule of thumb, any key name that ends with “Id” contains a pointer to a different report whose id attribute matches the value of the key. So all of these reports are connected to each other. Also note that most values are string even if they look like numbers of boolean values.

The most important attribute of the RTCStatsReport is the type of the report. There are quite a few of them:

  • googTrack
  • googLibjingleSession
  • googCertificate
  • googComponent
  • googCandidatePair
  • localCandidate
  • remoteCandidate
  • ssrc
  • VideoBWE

Lets drill down into these reports.

googTrack and googLibjingleSession reports

The googTrack and googLibjingleSession don’t contain much information so we’ll skip them.

googCertificate report

The googCertificate report contains some information about the DTLS certificate used by the local side and the peer such as the certificate itself (encoded as DER and wrapped in base64 which means you can decode it using openssls x509 command if you want to), the fingerprint and the hash algorithm. This is mostly as specified in the RTCCertificateStats dictionary.

googComponent report

The googComponent report is acting as a glue between the certificate statistics and the connection. It contains a pointer to the currently active candidate pair (described in the next section) as well as information about the ciphersuite used for DTLS and the SRTP cipher.

googCandidatePair report

A report with a type of googCandidatePair describes a pair of ICE candidates, i.e. the low-level connection. From this report you can get quite some information such as:

  • The overall number of packets and bytes sent and received (bytesSent, bytesReceived, packetsSent; packetsReceived is missing for unknown reasons). This is the raw UDP or TCP bytes including RTP headers
  • Whether this is the active connection (googActiveConnection is “true” in that case and “false” otherwise). Most of the time you will be interested only in the statistics of the active candidate pair. The spec equivalent can be found here
  • The number of STUN request and responses sent and received (requestsSent and responsesReceived; requestsReceived and responsesSent) which count the number of incoming and outgoing STUN requests that are used in the ICE process
  • The round trip time of the last STUN request, googRtt. This is different from the googRtt on the ssrc report as we will see later
  • The localCandidateId and remoteCandidateId which point to reports of type localCandidate and remoteCandidate which describe the local and remote ICE candidates. You can still see most of the information in the googLocalAddress, googLocalCandidateType etc values
  • googTransportType specifies the transport type. Note that the value of this statistics will usually be ‘udp’, even in cases where TURN over TCP is used to connect to a TURN server. This will be ‘tcp’ only when ICE-TCP is used

There are a couple of things which are easily visualized here, like the number of bytes sent and received:

Bytes graph derived from WebRTC getstats data

localCandidate and remoteCandidate reports

The localCandidate and remoteCandidate are thankfully as described in the specification, telling us the ip address, port number and type of the candidate. For TURN candidates this will soon also tell us over which transport the candidate was allocated.

Ssrc report

The ssrc report is one of the most important ones. There is one for each audio or video track sent or received over the peerconnection. It is the old version of what the specification calls MediaStreamTrackStats and RTPStreamStats. The content depends quite a bit on whether this is an audio or video track and whether it is sent or received. Let us describe some common elements first:

  • The mediaType describes whether we are looking at audio or video statistics
  • The ssrc attribute specifies the ssrc that media is sent or received on
  • googTrackId identifies the track that these statistics describe. This id can be found both in the SDP as well as the local or remote media stream tracks. Actually this is violating the rule that anything named “…Id” is a pointer to another report. Google got the goog stats wrong 😉
  • googRtt describes the round-trip time. Unlike the earlier round trip time, this is measured from RTCP
  • transportId is a pointer to the component used to transport this RTP stream. Usually (when BUNDLE) is used this will be the same for both audio and video streams
  • googCodecName specifies the codec name. For audio this will typically be opus, for video this will be either VP8, VP9 or H264. You can also see information about what implementation is used in the codecImplementationName stat
  • The number of bytesSent, bytesReceived, packetsSent and packetsReceived (depending on whether you send or receive) allow you to calculate bitrates. Those numbers are cumulative so you need to divide by the time since you last queried getStats. The sample code in the specification is quite nice but beware that Chrome sometimes resets those counters so you might end up with negative rates.
  • packetsLost gives you an indication about the number of packets lost. For the sender, this comes via RTCP, for the receiver it is measured locally. This is probably the most direct indicator you want to look at when looking at bad call quality

Voice specific

For audio tracks we have the audioInputLevel and audioOutputLevel respectively (the specification calls it audioLevel) which gives an indication whether an audio signal is coming from the microphone (unless it is muted) or played through the speakers. This could be used to detect the infamous Chrome audio bug. Also we get information about the amount of Jitter received and the jitter buffer state in googJitterReceived and googJitterBufferReceived.

Video specific

For video tracks we get two major pieces of information. The first is the number of NACK, PLI and FIR packets sent in googNacksSent, googPLIsSent and googFIRsSent (and their respective Received) variants. This gives us an idea about how packet loss is affecting video quality.

More importantly, we get information about the frame size and rate that is input (googFrameWidthInput, googFrameHeightInput, googFrameRateInput) and actually sent on the network (googFrameWidthSent, googFrameHeightSent, googFrameRateSent).
Similar data can be gathered on the receiving end in the googFrameWidthReceived, googFrameHeightReceived statistics. For the frame rate we even get it split up between the googFrameRateReceived, googFrameRateDecoded and googFrameRateOutput.

On the encoder side we can observe difference between these values and get even more information about why the picture is scaled down. Typically this happens either because there is not enough CPU or bandwidth to transmit the full picture. In addition to lowering the frame rate (which could be observed by comparing differences between googFrameRateInput and googFrameRateSent) we get extra information about whether the resolution is adapted because of CPU issues (then googCpuLimitedResolution is true then — mind you that it is the string true, not a boolean value in Chrome’s current implementation) and if it is because the bandwidth is insufficient then googBandwidthLimitedResolution will be true. Whenever one of those conditions changes, the googAdaptionChanges counter increases.

We can see such a change in this diagram:

Checking WebRTC video width in getstats

Here, packet loss is artificially generated. In response, Chrome tries to reduce the resolution first at t=184 where the green line showing the googFrameWidthSent starts to differ from the googFrameWidthInput shown in black. Next at t=186 frames are dropped and the input frame rate of 30fps (shown in light blue) is different from the frame rate sent (blue line) which is close to 0.

In addition to these standard statistics, Chrome exposes a large number of statistics about the behaviour of the audio and video stack on the ssrc report. We will discuss them in a future post.

VideoBWE report

Last but not least the VideoBWE report. As the name suggests, it contains information about the bandwidth estimate that the peerconnection has. But there is quite a bit more useful information contained in this report:

  • googAvailableReceiveBandwidth – the bandwidth that is available for receiving video data
  • googAvailableSendBandwidth – the bandwidth that is available for sending video data
  • googTargetEncBitrate – the target bitrate of the the video encoder. This tries to fill out the available bandwidth
  • googActualEncBitrate – the bitrate coming out of the video encoder. This should usually match the target bitrate
  • googTransmitBitrate – the bitrate actually transmitted. If this is very different from the actual encoder bitrate, this might be due to forward error correction
  • googRetransmitBitrate – this allows measuring the bitrate of retransmits if RTX is used. This is usually an indication of packet loss.
  • googBucketDelay – is a measure for Google’s “leaky bucket” strategy for dealing with large frames. Should be very small usually

As you can see this report gives you quite a wealth of information about one of the most important aspects of the video quality – the available bandwidth. Checking the available send and receive bandwidth is often the first step before diving deeper into the ssrc reports. Because sometimes you might find behaviour like this which explains ‘bad quality’ complaints from users:

Bandwidth estimation graph for WebRTC

In this case “the bandwidth estimate dropped all the time” is a pretty good explanation for quality issues.

What’s next?

That’s a small part of what you can glean out of webrtc-internals. There’s more to it, which means Fippo and I will be churning out more posts in this serie of articles about webrtc-internals. If you are interested in keeping up with us, you might want to consider subscribing.

Huge thanks for Fippo in assisting with this one!