Tag Archives for " Firefox "

Testing Firefox has just become easier (and other additions in testRTC)

We’ve pushed a new release for our testRTC service last month. This one has a lot of small polishes along with one large addition – support for Firefox.

I’d like to list some of the things you’ll be able to find in this new release.

Firefox

When we set out to build testRTC, we knew we will need to support multiple browsers. We started off with Chrome (just like most companies building applications with WebRTC), and somehow drilled down into more features, beefing up our execution, automation and analysis capabilities.

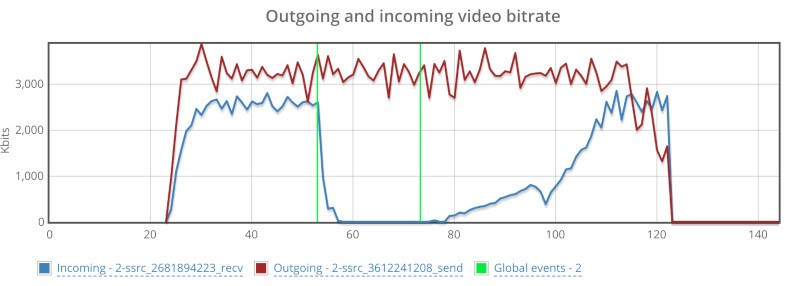
We tried adding Firefox about two years ago (and failed). This time, we’re taking it in “baby steps”. This first release of Firefox brings with it solid audio support with rudimentary video support. We aren’t pushing our own video content but rather generating it ad-hoc. This results less effective bitrates that we can reach.

The challenge with Firefox lies in the fact that it has no fake media support the same way Chrome does – there is no simple way to have it take up media files directly instead of the camera. We could theoretically create virtual camera drivers and work our way from there, but that’s exactly where we decided to stop. We wanted to ship something usable before making this a bigger adventure (which was our mistake in the past).

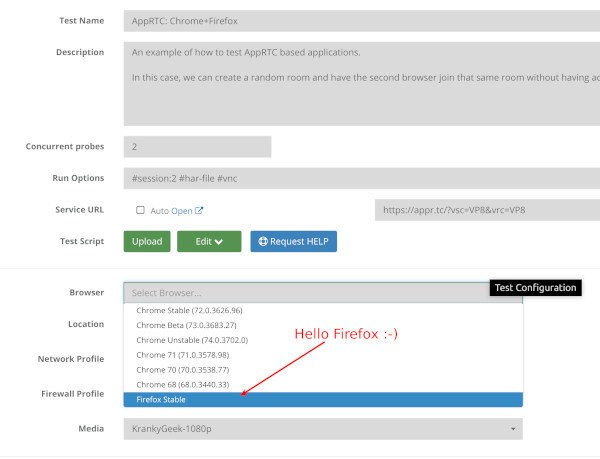
Where will you find Firefox? In the profile planning section under the test editor:

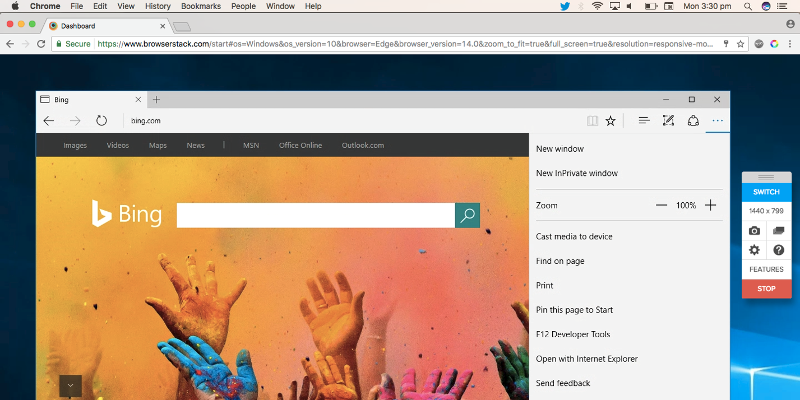
When you run the tests, you might notice that we alternate the colors of the video instead of pushing real video into it. Here’s how it looks like running Jitsi between Firefox and Chrome:

That’s a screenshot we’ve taken inside the test. That cyan color is what we push as the video source from Firefox. This will be improved over time.

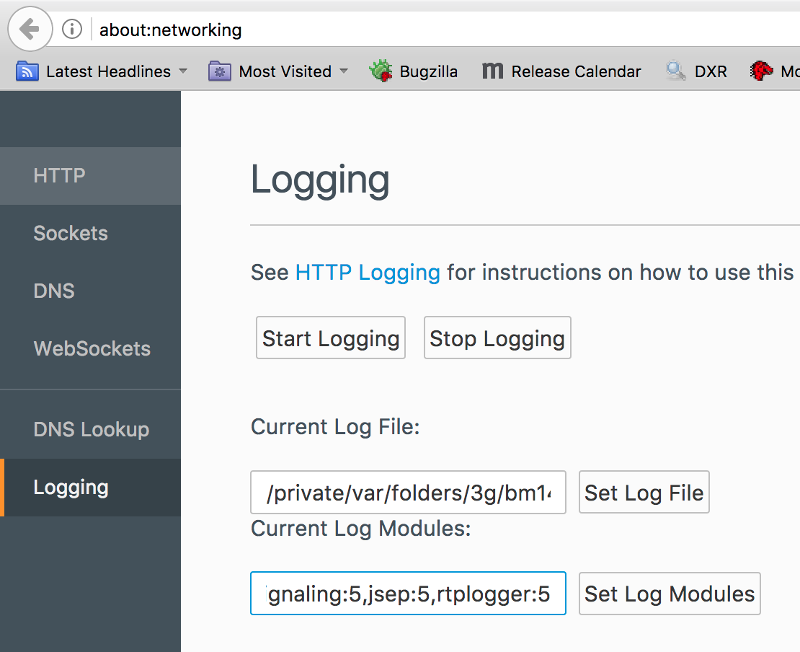
On the audio side you can see the metrics properly:

If you need Firefox, then you can now start using testRTC to automate your WebRTC testing on Firefox.

How we count minutes

Up until now, our per minute pricing for tests was built around the notion of a minimum length per test of 10 minutes. If you wanted a test with 4 probes (that’s 4 browsers) concurrently, we calculated it as 4*10=40 minutes even if the test duration was only 3 minutes.

That has now changed. We are calculating the length of tests without any specific minimum. The only things we are doing is:

  1. Length is rounded up towards the nearest minute. If you had a test that is 2:30 minutes long, we count it as 3 minutes
  2. We add to the test length our overhead of initiation for the test and teardown. Teardown includes uploading results to our servers and analyzing them. It doesn’t add much for smaller tests, but it can add a few minutes on the larger tests

End result? You can run more tests with the minutes allotted to your account.

This change is automatic across all our existing customers – there’s nothing you need to do to get it.

Monitoring tweaks

We’ve added two new capabilities to monitoring, due to requests of our customers.

#1 – Automated run counter

At times, you’ll want to alternate information you use in a test based on when it gets running.

One example is using multiple users to login to a service. If you run a high frequency monitor, which executes a test every 2-5 minutes, using the same user won’t be the right thing to do:

  • You might end up not leaving the first session when running the next monitor a couple of minutes later
  • Your service might leave session information for longer (webinars tend to do that, waiting for the instructors to join the same session for ten or more minutes after he leaves)
  • If a monitor fails, it might cause a transient state for that user until some internal timeout

For these, we tend to suggest clients to use multiple users and alternate between them as they run the monitors.

Another example is when you want in each round of execution to touch a different part of your infrastructure – alternating across your data centers, machines, etc.

Up until today, we’ve used to do this using Firebase as an external database source that knows which user was last used – we even have that in our knowledge base.

While it works well, our purpose is to make the scripts you write shorter and easier to maintain, so we added a new (and simple) environment variable to our tests called RTC_RUN_COUNT. The only thing it does is return the value of an iterator indicating how many times the test has been executed – either as a test or as a monitor.

It is now easy to use by calculating the modulu value of RTC_RUN_COUNT with the number of users you created.

You can learn more about RTC_RUN_COUNT and our other environment variables in our knowledge base.

#2 – Additional information

We had a customer recently who wanted to know within every run of a monitor specific parameters of that run – in his case, it was the part of his infrastructure that gets used during the execution.

He could have used rtcInfo(), but then he’ll need to dig into the logs to find that information, which would take him too long. He needed that when the monitors are running in order to quickly pinpoint the source of failures on his end.

We listened, and added a new script command – rtcSetAdditionalInfo(). Whatever you place in that command during runtime gets stored and “bubbled up” – to the top of test run results pages as well as to the test results webhook. This means that if you connect the monitor to your own monitoring dashboards for the service, you can insert that specific information there, making it easily accessible to your DevOps teams.

Onwards

We will be looking for bugs (and fixing them) around our Firefox implementation, and we’re already hard at work on a totally new product and on some great new analysis features for our test results views.

If you are looking for a solid, managed testing and monitoring solution for your WebRTC application, then try us out.

Do Browser Vendors Care About Your WebRTC Testing?

It is 2017 and it seems that browser vendors are starting to think of all of us WebRTC developers and testers. Well… not all the browser vendors… and not all the time – but I’ll take what I am given.

I remember years ago when I managed the development of a VoIP stack, we decided to rewrite our whole test application from scratch. We switched from the horrible “native” Windows and Unix UI frameworks to a cross platform one – Tcl/Tk (yes. I know. I am old). We also took the time to redesign our UI, trying to make it easier for us and our developers to test the APIs of the VoIP stack. These were the good ol’ days of manual testing – automation wasn’t even a concept for us.

This change brought with it a world of pain to me. I had almost daily fights with the test manager who had her team file bugs that from my perspective were UI issues and not the product’s issues. While true, fixing these bugs and even adding more tooling for our testing team ended up making our product better and more developers-friendly – an important factor for a product used by developers.

Things aren’t much different in WebRTC-land and browsers these days.

If I had to guess, here’s what I’d say is happening:

  • Developers are the main customers of WebRTC and the implementation of WebRTC in browsers
  • Browser vendors are working hard on getting WebRTC to work, but at times neglected this minor issue of empowering developers with their testing needs
  • Testing tools provided by browsers specifically for WebRTC are second class citizens when it comes to… well… almost everything else in the browser

The First 5 Years

Up until now, Chrome was the most accommodating browser out there when it came to us being able to adopt it and automate it for our own needs. It was never easy even with Chrome, but it is working, so it is hard to complain.

Chrome gives us out of the box the following set of capabilities:

  1. Support for Selenium and WebDriver, which allows us to automate it properly (for most versions, most of the times, when things don’t go breaking up on us suddenly). Firefox has similar capabilities
  2. The webrtc-internals Chrome tab with all of its goodness and data
  3. Ability to easily replace raw inputs of camera and microphone with media files (even if at times this capability is buggy)

We’ve had our share of Chrome bugs that we had to file or star to get specific features to work. Some of it got solved, while others are still open. That’s life I guess – you win some and you lose some.

Firefox was not that fun, to say the least. We’ve been struggling for a long time with it trying to get it to behave with Selenium inside a Docker container. The end result never got beyond 5 frames per second. Somehow, the combination of technologies we’ve been using didn’t work and never got the attention of Mozilla to take a look at – it may well be our own ignorance of how and where to nag the Mozilla team to get that attention 🙂

Edge? Had nothing – or at least not close to the level that Chrome and Firefox have on offer. We will get there. Eventually.

This has been the status quo for quite some time. Perhaps the whole 5 years of WebRTC’s existence.

But now things are changing.

And they are becoming rather interesting.

Mozilla Wiresharking

Mozilla introduced last month the ability to log RTP headers in Firefox WebRTC sessions.

While Chrome had something similar for quite some time, Firefox took this a step further:

“Bug 1343640 adds support in Firefox version 55 to log the RTP header plus the first five bytes of the payload unencrypted. RTCP will be logged in full and unencrypted.”

The best thing though? It also shared a script that can convert these logs to PCAP files, making them readable in Wireshark – a popular open source tool for analyzing network traffic.

The end result? You can now analyze with more clarity what goes on the network and how the browser behaves – especially if you don’t have a media server in the middle (or if you haven’t invested in tools that enable you to analyze it already).

This isn’t a first for Mozilla. It seems that lately, they have been sharing some useful information and pieces of code on their new Advancing WebRTC blog – a definite resource you should be following if you aren’t already.

Edge Does BrowserStack

Microsoft has been on a very positive streak lately. For over a year now, most of the Microsoft announcements are actually furthering the cause of their customers and developers without creating closed gardens – something that I find refreshing.

When it comes to WebRTC, Microsoft recently released a new version of Edge (in beta still) that is interoperable with Chrome and Firefox – on the codec level. While that was a rather expected move, the one we’ve seen last week was quite surprising and interesting.

An Edge testing partnership with BrowserStack: If you want to test your web app on the Edge browser, you can now use BrowserStack for free to do that (there are a few free plans there for it).

How does WebRTC comes to play here? As an enabler to a new feature that got introduced there:

See how that Edge window inside a Chrome app running on a Mac looks?

Guess what – BrowserStack are using WebRTC to enable this screen casting feature. While the original Microsoft announcement removed any trace of WebRTC from it, you can still find that over the web (here, here and here for example). For the geeks, we have a webrtc-internal dump!

The feature is called “Live Testing” at BrowserStack and offers the ability to run a cloud machine running Windows 10 and the Edge browser – and have that machine stream its virtual screen to your local machine – all assuming the local browser you are using for it all supports WebRTC.

In a way, this is a replacement of VNC (which is what we use at testRTC to offer this capability).

Is this coming from Microsoft? From BrowserStack?

I don’t really think it matters. It shows how WebRTC is getting used in new ways and how browser vendors are a major part of this change.

Will Google even care?

Google has been running along with WebRTC, practically on their own.

Yes. Mozilla with Firefox was there from the beginning. Microsoft is joining with Edge. Apple is slowly being dragged into it if you follow the rumormill.

But Google has been setting the tone through the initial acquisitions it made and the ongoing investment in it – both in engineering and in marketing. The end result for Google’s investments (not only in WebRTC but in everything HTML5 related)? Desktop browsers market share dominance

With these new toys that other browser vendors are giving us developers and testers – may that be something to reconsider and revisit? We are the early adopters of browsers, and we usually pick and choose the ones that offer us the greater power and enable us to speed our development efforts.

I wonder if Google will answer in turn with its own new tools and initiatives or continue in their current trajectory.

Should we expect better tooling?

Yes. Definitely.

WebRTC is hard to develop compared to other HTML5 technologies and it is a lot harder to test. Test automation frameworks and commercial offerings tend to focus on the easier problems of browser testing and they often neglect WebRTC, which is where we try to fill in these gaps.

I for once, would appreciate a few more trinkets from browser vendors that we could adopt and use at testRTC.