Tag Archives for " monitoring "

1

How to Prepare Your WebRTC Application for a Surge in Traffic

OK, this is the moment you’ve been waiting for: there’s a huge surge in traffic on your WebRTC application. Success! You even had the prescience to place all of your web application’s assets on a CDN and whatever uptime monitoring service you use, be it New Relic, Datadog or a homegrown Nagios solution – says all is fine. But there’s just one nagging problem – users are complaining. More than they used to. Either because the service doesn’t work at all for them or the quality of the media just doesn’t cut it for them. What The–?!

We recently hosted a webinar about preparing for that big WebRTC launch. You might want to check the suggestions we made there as well.

Register now for free: WebRTC – How NOT to Fail in Your Big Launch

Let’s start by focusing on the positives here. Your service is being used be people. Then again, these people aren’t getting the real deal – the quality they are experiencing isn’t top notch. What they are experiencing is inability to join sessions, low bitrates or inexplicable packet losses. These are different than your run of the mill 500 and 502 errors, and you might not even notice something is wrong until a user complains.

So, what now?

Here’s what I’m going to cover today:

  1. Learn how to predict service hiccups
  2. Prepare your WebRTC application in advance for growth

Learn How to Predict Service Hiccups

While lots of users is probably what you are aiming for in your business, the effects they can have on your WebRTC application if unprepared for it can be devastating. Sure, sometimes they’ll force your service to go offline completely, but in many other times, the service will keep on running but it will deliver bad user experience. This can manifest itself by having users wait for long times to connect, requiring them to refresh the page to connect or just having poor audio and video quality.

Once you get to that point, it is hard to know what to do:

  • Do you throw more machines on the problem?
  • Do you need to check your network connections?
  • How do you find the affected users and tell them things have been sorted out?

This mess is going to take up a lot of your time and attention to resolve.

Here is something you can do to try and predict when these hiccups are about to hit you:

Establish a Baseline

I’ve said it before and I’ll say it again. You need to understand the performance metrics of your WebRTC service. In order to do that, the best thing is to run it a bit with the acceptable load that you have and writing down for yourself the important metrics.

A few that come to mind:

  • Bitrate of the channels
  • Average packet loss
  • Jitter

Now that you have your baseline, take the time to gauge what exactly your WebRTC application is capable of doing in terms of traffic. How much load can it carry as you stack up more users?

One neat trick you can do is place a testRTC monitor and use rtcSetTestExpectation() to indicate the thresholds you’ve selected for your baseline. Things like “I don’t expect more than 0.5% packet loss on average” or “average bitrate must be above 500kbps”. The moment these thresholds are breached – you’ll get notified and able to see if this is caused by growth in your traffic, changes in usage behavior, etc.

Prepare Your WebRTC Application in Advance for Growth

There aren’t always warning signs that let you know when a rampaging horde of users may come at your door. And even when there is, you better have some kind of a solution in place and be prepared to react. This preparation can be just knowing your numbers and have a resolution plan in place that you can roll out or it can be an automated solution that doesn’t require any additional effort on your end.

To get there, here are some suggestions I have for you.

Find Your System’s Limits

In general, there are 3 main limits to look at:

  1. How big can a single session grow?
  2. How many users can I cram into a single server?
  3. How many users can my service serve concurrently?

You can read more on strategies and planning for stress testing and sizing WebRTC services. I want to briefly touch these limits though.

1. How big can a single session grow?

Being able to handle 500 1:1 sessions doesn’t always scale to 100 groups of 10 users sessions. The growth isn’t linear in nature. On top of it, the end result might choke your server or just provide bitrates that are just too low above a certain number of users.

Make sure you know what’s the biggest session size you are willing to run.

Besides doing automated testing and checking the metrics against the baseline you want, you can always run an automated test using testRTC and at the same time join from your own browser to get a real feeling of what’s going on. Doing that will add the human factor into the mix.

2. How many users can I cram into a single server?

Most sizing testing are about understanding how many sessions/users/whatever can you fit in a single server. Once you hit that number, you should probably launch another server and use a load balancer to scale out.

Getting that number figured out based on your specific scenario and infrastructure is important.

3. How many users can my service serve concurrently?

Now that you know how to scale out from a single server, growing can be thought of as linearly (up to a point). So it is probably time to put in place automatic scale out and scale down and test that this thing works nicely.

Doing so will greatly reduce the potential and destruction that a service hiccup can cause.

CDN and Caching

Make sure all of the HTML assets of your WebRTC application that static are served through a CDN.

In some cases, when we stress test services, just putting 200 browsers in front of an HTML page that serves a WebRTC application can cause intermittent failures in loading the pages. That’s because the web serving part of the application is often neglected by WebRTC developers who are focusing their time and energy on the bigger resource hogs.

We’ve had numerous cases where the first roadblock we’ve hit with a customer was him forgetting to place a minor javascript file in the CDN.

Don’t be that person.

Geographically Distributed Deployment

The web and WebRTC are global, but traffic is local.

You don’t want to send users to the other side of the globe unnecessarily in your service. You want your media and NAT traversal servers to be as close to the users as possible. This gives you the flexibility of optimizing the backend network when needed.

Make sure your deployment is distributed along multiple datacenters, and that the users are routed to the correct one.

Philipp Hancke wrote how they do it at appear.in for their TURN servers.

Monitor Everything

CPU. Memory. Storage. Network. The works.

Add application metrics you collect from your servers on top of it.

And then add a testRTC monitor to check media quality end-to-end to make sure everything run consistently.

Check across large time spans if there’s an improvement or degradation of your service quality.

Stress Testing

Check your system for the load you expect to be able to handle.

Do it whenever you upgrade pieces of your backend, as minor changes there may cause large changes in performance.

Don’t Let Things Out of Your Control

WebRTC has a lot of moving parts in it so deploying it isn’t as easy as putting up a WordPress site. You should be prepared for that surge in traffic, and that means:

  1. Understanding the baseline quality of your service
  2. Knowing where you stand with your sizing and scale out strategy
  3. Monitoring your service quality so you can react before customers start complaining

Do it on your own. Use testRTC. Use whatever other tool there is at your disposal.

Just make sure you take this seriously.

We recently hosted a webinar about preparing for that big WebRTC launch. You might want to check the suggestions we made there as well.

Register now for free: WebRTC – How NOT to Fail in Your Big Launch

3

The 4 Techniques of Monitoring WebRTC Services

I remember that first time our servers went down after we had a couple of paying customers.

We got a call from a customer once. The only thing he wanted was to use our monitoring service. Since I knew him before, and knew he wasn’t interested in our monitoring – I asked him why.

I got something similar to this answer:

“We have monitoring on everything. We monitor the machine’s CPU, memory, storage. We look at the network. We collect metrics from our apps and monitor these as well. But yesterday we had a downtime of our service and we didn’t know it until a customer complained.”

Which brings me to the point – with WebRTC, it is extremely important to use end-to-end monitoring. It is also extremely important that this monitoring thingy you are putting in place knows a thing or two about WebRTC, otherwise, how will you know if the customer is really getting that video call or just looking at a blank screen?

Great. So now that we know we have a problem what’s the solution?

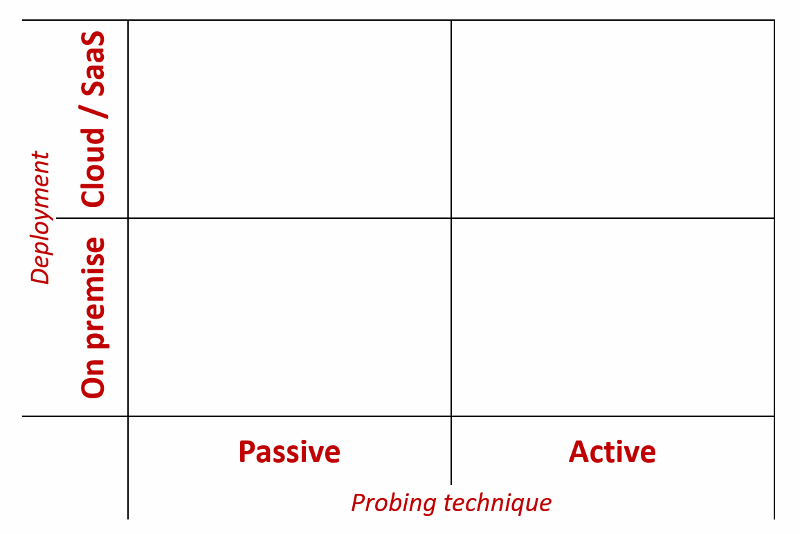
Luckily (or not?), there’s more than one way to handle monitoring WebRTC services. I like characterizing the solution based on 2 parameters, making for a nice quadrants to visualize it:

I’ll be using the terms active and passive here to describe the probing technique in a way that might be somewhat confusing to some, but for me this works.

Active monitoring is a system which actively generates traffic in the monitored product, using the generated traffic and the product’s behavior to determine its health.

Passive monitoring is a system which passively collects metrics off the different product components, determining from that the product’s health.

The exact definition/architecture of what is Cloud / SaaS versus what is on premise on premise for me ends up depending on what probing probing technique you refer to – active or passive monitoring. Let’s see how they compare (and along the way explain what cloud and on premise is in each case).

#1 – Active Monitoring (Cloud / SaaS)

Active monitoring is for us the most popular monitoring service that our customers subscribe to.

The way such a monitor works?

  • It has a specific scenario it executes
  • It runs it at a given frequency
  • It validates a certain set of expectations, deciding if there were any failures requiring raising an alert

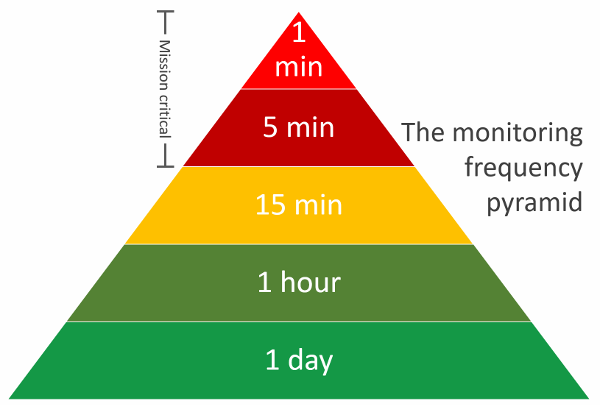
The WebRTC monitoring frequency pyramid above shows the various frequencies such a monitor can employ.

A daily monitor is akin to a ping – a healthcheck placed on a demo system for example; while a 1-minute monitor is mission critical – it is there to find issues and alert about them as soon as possible and before your customers notice them.

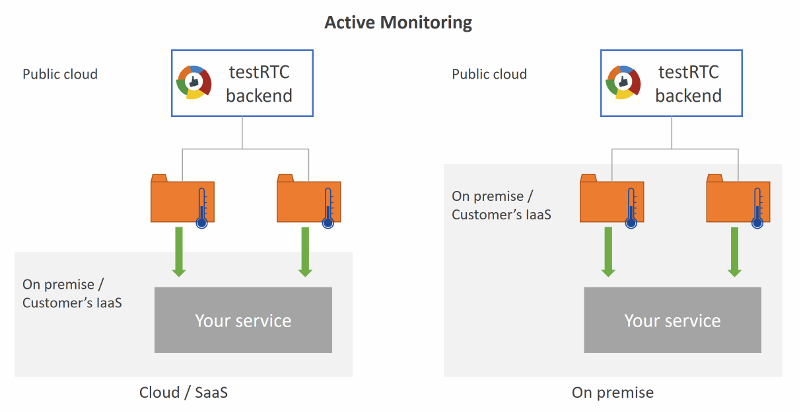
The cloud part of the active monitor is about the machines used to run your service. You deploy them in the cloud, probably on a managed monitoring service (we’ve got one for you). It means less setup hassle and also the ability to decide the geographical location of these machines.

Why use active monitoring?

  1. When your service runs at specific hours of the day. Contact centers for example, or doctor appointments. They tend to have their own “opening hours”, but what happens when the system breaks outside of opening hours? When do you get notified it? When the first customer complains at the beginning of the shift? Or 5 hours earlier when you get an alert from an active monitoring system? In order to get alerts ahead of time here, you need a “non-user” to join the session
  2. When the failure occurs before WebRTC altogether. Sure you have a great way to monitor calls that happen to interact with the WebRTC APIs. But what if the service failure occurs earlier? Like a connection error between your web server and the directory service? An active monitor that runs end-to-end can find and pinpoint such issues
  3. Consistency. Passive monitors show the experience of your users. But it can’t reproduce the same settings to show you if and how you improved – and it is devilishly hard to decide if the problem is a user problem or a service problem. An active monitor can be configured to run in very specific network configurations – over and over again. Its results can be compared in certain timeframes to show the objective degradation or improvement of the service
  4. Zero instrumentation. Nothing needs to change in your service to accommodate for active monitoring. The active probes that will interact with your service accommodate themselves to whatever you are doing today

Not all is rosy here though. To setup a good active monitor you need to plan a use case that fits nicely. One in which the UI of your service is predictable and simple enough to automate. I’ve seen a couple of times instances where monitors failed due to inconsistencies in the UI which caused service failures – things that humans would be comfortable with but automation would not be.

#2 – Active Monitoring (On premise)

An On premise active monitoring solution is similar to a cloud based active monitoring solution with one minor difference: the probes that are used are deployed “on premise” as opposed to “in the cloud”.

What does it mean exactly?

For an education service, where teachers and students can be anywhere, a cloud based approach works great. It actually mimics how the service is used “live”. So having the probes deployed strategically across the globe in different locations makes a lot of sense.

But for a contact center for example, where the agent sits inside the office, you sometimes want to have a monitor on site – a machine dedicated to monitoring also the network constraints that your agents feel – placing the machine within the same subnet on your local LAN.

So, the difference between Cloud and On premise Active Monitoring in WebRTC?

To sum things up – you deploy the probes on premise or in the cloud, but collecting and analysis can happen in both approaches in the cloud. Oh, and obviously, you can also end up deploying some probes on premise and others in the cloud (especially for a call center scenario).

The advantages of the on premise approach is that you get closer to real life scenarios with it for the use cases where you can place your users at a given location.

The main disadvantage is that this is usually a bit more expensive and time consuming to setup and maintain (there’s less of an option to use economies of scale fairy dust for it).

#3 – Passive Monitoring (Cloud / SaaS)

With passive monitoring, there are no real probes. We treat each and every user who interacts with the WebRTC service as a “probe for hire”, available if and when he decides to interact with the service.

In its Cloud variant, the data pulled off from the device gets shipped to the cloud to a third party service who aggregates and analyzes the metrics available in WebRTC (usually by means of getstats calls).

The advantages of this approach is that it gives you the data and analysis on your real user’s interactions. You can’t get any closer to that when it comes to reality. It is also easy to setup and get started with.

There are certain disadvantages though:

  1. Uptime. There is no indication of uptime here. If no users call the doctor before 8am, then you get no data for the time the system is idle – and no visibility towards its health
  2. Predictability. A session may experience failures or issues that relate to the user’s device or network. You will definitely want to optimize your service as much as possible for such cases as well, but it will be hard to check for objective trends of the service’ quality in such a way
  3. Privacy. You send the metrics about your service’ real live traffic to a third party, who can easily discern the size of your operation
  4. Instrumentation. You need to modify your product’s code to integrate with a passive monitoring solution. This will typically be a minor hindrance, but will be there

#4 – Passive Monitoring (On premise)

In many cases, people end up using homegrown passive monitoring systems.

What they do is collect data off the devices and then aggregate and analyze it in their own backend monitoring system. Terms like Elastic Search and Kibana and Graylog get thrown into the air – or god forbid – Big Data.

The biggest advantage here? You collect, get and analyze exactly what you want to. Oh – and you can also easily enrich that information you collect with your business logic and other metrics unrelated to WebRTC. In many cases, this is the reason I’ve seen vendors foregoing the cloud based passive monitoring approach – the need for enrichment and wider analysis.

The big disadvantage here is probably time and material. Putting such an operation in place can be time consuming and expensive. It requires developers to work on your monitoring infrastructure which no one sees at the end of the day instead of having them focus on your core product’s offering and features.

We’re in the process of running a pilot with an on premise passive monitoring product. If you want to learn more, just contact us.

Which shall it be?

Passive or active. Cloud or on premise.

If you are serious with what you are doing, and want to run it as a business – a viable commercial service – then you will need monitoring.

I urge you not to be happy enough with web based monitoring solutions and also go for an end-to-end type of a monitoring service that understands WebRTC.

Check out the enhancements we’ve made to testRTC

It has been a while since we released a version, so it is with great pleasure that I am writing this announcement.

Yes. Our latest release is now out in the wild. We’ve upgraded our service on Sunday, so it is about time we take you for a quick roundup of the changes we’ve made.

#1 – Support for projects and users

This one is long overdue. Up until today, if you signed up for testRTC, you had to share your credentials with whoever was on your team to work with him on the tests. This was impossible to work with, assuming you wanted QA, R&D and DevOps to share the account and work cooperatively with the tests and monitors that got logged inside testRTC.

So we did what we should have – we now support two modes of operation:

  1. A user can be linked to multiple projects
    • So if your company is running multiple projects, you can now run them separately, having people focused on their own environment and tests
    • This is great for those who run segregated services for their own customers
    • It also means that now, a user can switch between projects with a single set of credentials in the system
  2. A project can belong to multiple users
    • Need someone to work on writing the scripts and executing them? You got it
    • Have a developer working on a bug that got reported with a link to testRTC? Sure thing
    • The IT guy who just received a downtime alarm from the WebRTC monitor we run? That’s another user
    • Each user has his own place in the project, and each is distinguished by his own credentials

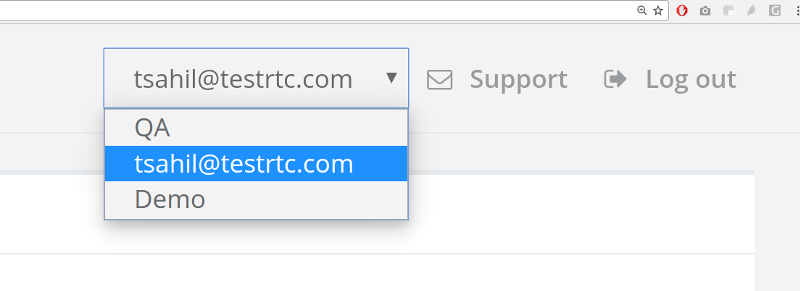
testRTC project selection

If you require multiple projects, or want to add more users to your account just contact our support.

#2 – Longer, bigger tests

While theoretically, testRTC can run any test at any length and size, things aren’t always that easy.

There are usually two limitations to these requirements:

  1. The time they take to prepare, execute, run and collect results
  2. The time it takes to analyze the results

We worked hard in this release on both elements and got to a point where we’re quite happy with the results.

If you need long tests, we can handle those. One of the main concerns with long tests is what to do if you made a mistake while configuring them? Now you can cancel such tests in the middle if necessary.

Canceling a test run

If you need to scale tests to a large number of browsers – we can do that too.

We are making sure we bubble up the essentials from the browsers, so you don’t have to work hard and rummage through hundreds of browser logs to find out what went wrong. To that end, the tables that show browser results have been reworked and are now sorted in a way that will show failures first.

#3 – Advanced WebRTC analysis

We’ve noticed in the past few months that some of our customers are rather hard core. They are technology savvy and know their way in WebRTC. For them, the graphs we offer of bitrates, latencies, packet losses, … – are just not enough.

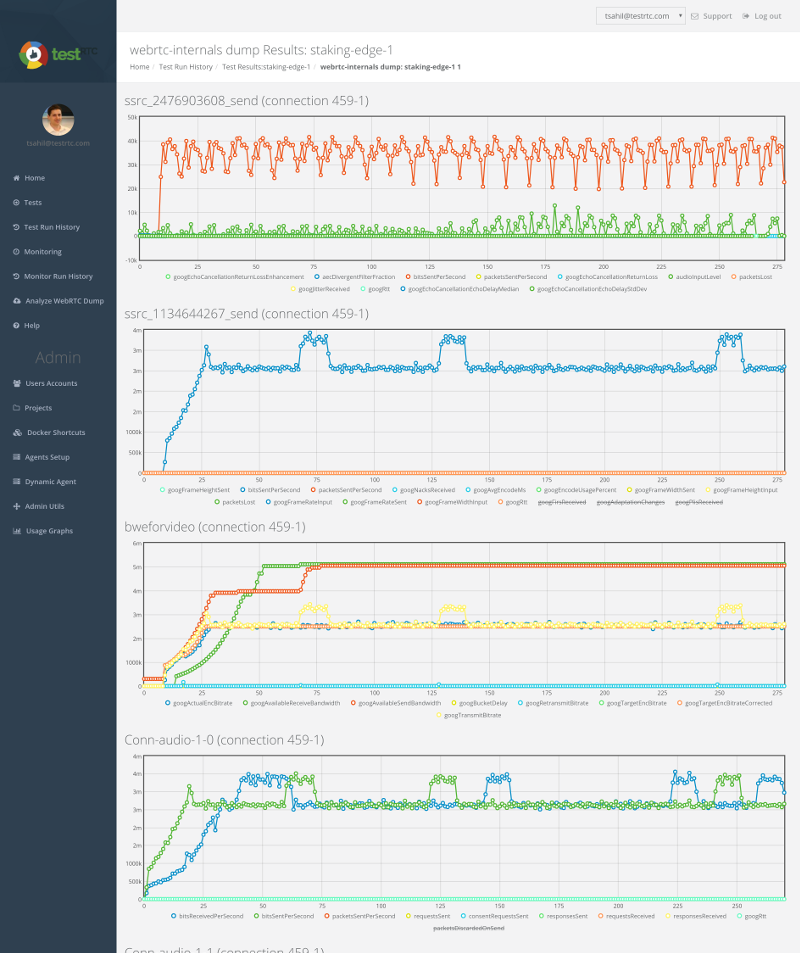
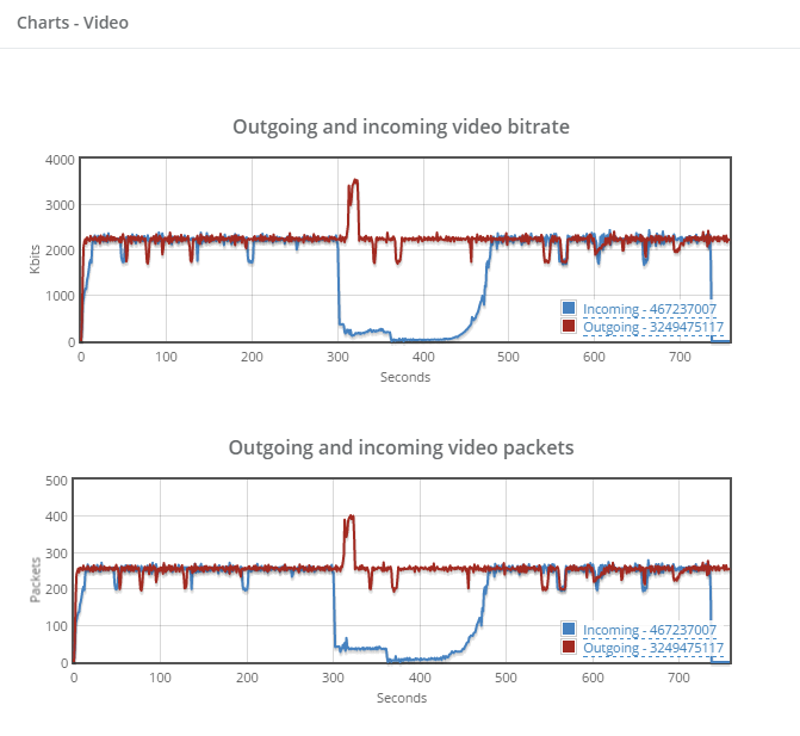
Chrome’s webrtc-internals and getstats() offer a wealth of additional information that we offered up until now only in a JSON file download. Well… now we also visualize it upon request right from the report itself:

Advanced WebRTC graphs

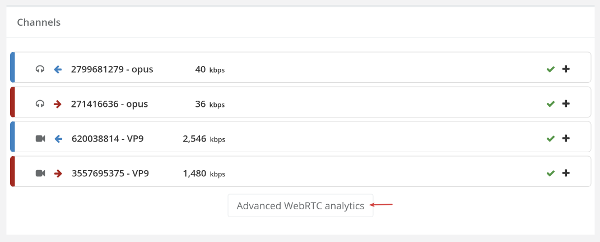
These graphs are reachable by clicking the webrtc_internals_dump.txt link under the Logs tab of a test result. Or by clicking the Advanced WebRTC Analytics button located just below the channels list:

Access advanced WebRTC graphs

I’d like to thank Fippo for the work he did (webrtc-dump-importer) – we adopted it for this feature.

#4 – Simulation of call drops and dynamic network changes

This is something we’ve been asked more than once. We have the capability of modeling the network of our probes, so that the browser runs with a specific configuration of a firewall or via a specific type of simulated network. We’re modifying and tweaking the profiles we have for these from time to time, but now we’ve added a script command so that you can change this configuring in runtime.

What can you do with it? Run two minutes of a test with 2 Mbps, then close virtually everything for 20-30 seconds, then open up  the network again – and see what happens. It is a way to test WebRTC in your application in dynamic network conditions – ones that may require ICE restarts.

Dynamically changing network profile in testRTC

In the test above, we dynamically changed the network profile in mid-call to starve WebRTC and see how it affects the test.

How do you use this new capability? Use our new command rtcSetNetworkProfile(). Read all about it in our knowledge base: rtcSetNetworkProfile()

#5 – Additional test expectations

We had the basics covered when it came to expectations. You could check the number and types of channels, validate that there’s some bits going on in there, validate packet loss. And that’s about it.

To this list of capabilities that existed in rtcSetTestExpectations() we’ve now added the ability to add expectations related to jitter, video resolutions, frame rate, and call setup time. We’ve also taken the time to handle expectations on empty channels a lot better.

There’s really nothing new here, besides an enhancement of what rtcSetTestExpectations() can do.

#6 – Additional information in Webhook responses

testRTC can notify your backend whenever a test or a monitor run ends on the status of that run – success or failure. This is done by configuring a webhook that is called at the end of the test run. We’ve had customers use it to collect the results to their own internal monitoring systems such as Splunk and Elastic Search.

What we had on offer in the actual payload that was passed with the webhook was rather thin, and while we’re still trying to keep it simple, we did add the leading error in that response in cases of failure:

testRTC webhook test failure response

#7 – API enabled to all customers

Yes. We had APIs in the past, but somehow, there was friction involved, with customers needing to ask for their API key in order to use the API for their continuous integration plans. It worked well, but the number of customers asking for API keys – both customers and prospects under evaluation – has risen to a point where it was ridiculous to continue doing this manually. Especially when our intent is for customers to use our APIs.

So we took this one step forward. From now on, every account has an API key by default. That API key is accessible from the account’s dashboard when you login, so there’s no need to ask for it any longer.

testRTC API key

For those of you who have been using it – note that we’ve also reset your key to a new value.

Your turn

This has been quite a big release for us, and I am sure to miss an enhancement or two (or more).

Now back to you. How would you want to test WebRTC in your product?

We already have users. Why should we monitor WebRTC?

That’s actually a great question. We get this every once in awhile, so I wanted to touch it here.

Our WebRTC monitor? It is like pingdom, just more complex and end-to-end – we make sure that if a user tries to access your system he will end up getting media and not just a web page. And that distinction is important. Pingdom only states if a given IP address is responsive or that a URL returns a response. We go the extra mile of connecting a media session.

Back to the original question:

We already have users. Why should we monitor WebRTC?

That’s how the question goes. The service is up and running. People are using the service. We’ve even connected the servers we run to Nagios. Or New Relic. Or someone else. You know what? We even collect the WebRTC statistics on our live production system and closely monitor how real users perceive our service. Why do we need another monitor?

For the same reason you have Nagios and New Relic in there in the first place. If you have customers and they are happy and you check their stats – why invest in monitoring the servers directly?


Here are 4 reasons I heard directly from our customers:

#1 – We want to know before our customers complain

While the best predictor of a customer issue is a customer complaining, I am not sure this is the best approach.

Many vendors prefer knowing about a problem before their customers do. This gives them time to try and solve the issue – or at least give them the ability to tell the customer that they know about it and are trying to resolve it already.

A good example here is the launch of a new browser version. These upgrades tend to break things or change behavior in one way or another. You can put a monitor in front of the latest stable Chrome version – or better yet – the beta version. That way, you can catch more issues in advance and be prepared for them.

I’d say this is the main reason why customers subscribe to our WebRTC monitoring service. They may take different routes in what exactly it is that they monitor (locations, different deployments, different frequencies, different user profiles), but they all want to monitor their service.

#2 – Everything was up and running, but calls didn’t connect

We recently had a company approach us due to downtime that their service experienced. What they said was that the application monitoring that they had in place indicated service running perfectly well, but the service was effectively down for their customers.

You see, knowing that your server’s CPU is below 80% and memory looks fine doesn’t really indicate that if someone tries to communicate he will succeed. This type of monitoring is necessary but not sufficient.

By using testRTC monitor, you can rest assured that your service is up and running. Why? Because we access your service from a real browser just like a user would, and we go through all the hoops of your service to get to that media. And once we do? We can validate that the media also meets your criteria – like specific bitrates or packetloss target thresholds.

#3 – Uptime and network quality isn’t the same thing

If what you do is collect network statistics on calls getting connected by looking at WebRTC stats then think again. It might be necessary and important, but not enough either.

The assumption of such an activity that the service is up and running, and the only thing missing is knowing the network quality by reviewing the quality experienced by users. But is that a good predictor of the next failure? If you only monitor successful calls in the system, then how would you know that calls are failing because they can’t even begin to connect?

With the testRTC monitor this is something that is checked each and every time. Making sure that users can get connected. Sure. We’ll check the quality and your criteria of it. But first and foremost, we’ll make sure that session that needs to connect – get connected.

#4 – How do you baseline a service performance?

When you try and use the statistics collected from your live audience, it tells you how well this audience is experiencing your service, but does it tell you if/how can you improve it?

One of the toughest things to do with WebRTC is to spec out the server. You’ve built a service to scale. You’ve put in place scale out mechanisms on one of the biggest cloud providers. You know for certain that whenever you’ll need more capacity, your system will automagically grown and do so economically. Or will it?

Can you see from real users what will be the experience of the next user to join? Is he experiencing packet losses because of his own network (running from a smartphone in a basement connected over 2G) or is it because your server has a bad network connection of its own towards the internet and it is leaking packets?

Part of what our WebRTC monitor does is add predictability into the process. Whenever the monitor is scheduled to run, it will run as flawlessly as it did last time, over the same type of connection and network conditions you’ve asked it to. So if you see packet losses – you know it has to be something on your end.

This enables the creation of a baseline of your service performance, and put hard criteria in place against that baseline, so whenever a testRTC WebRTC probe will poke at your service and come back unsatisfied – you will know about it, and you will be able to take actionable measures to solve it.

How do you monitor WebRTC?

WebRTC is still rather new and nascent, so there’s little in the way of best practices and experience that got collected around it.

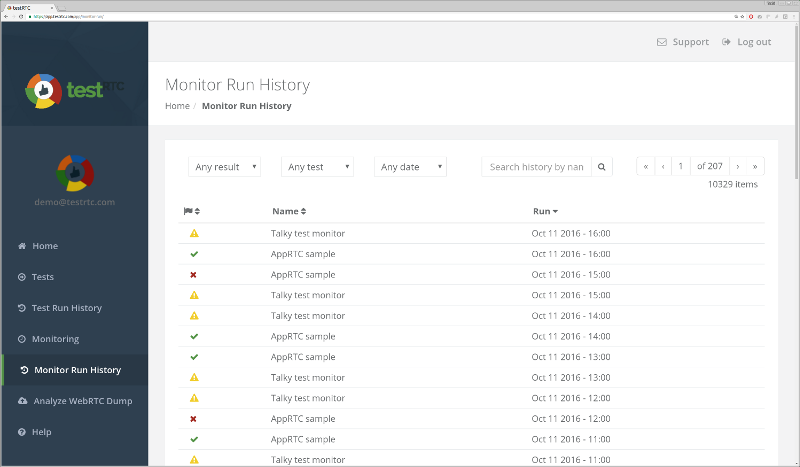
Here’s a screenshot I took just now from our demo account, where we run a few sample monitors in front of AppRTC and Talky (for no good reason other than the fact that we can):

WebRTC monitor sample screenshot

I am really interested in understanding how you monitor your service. What is it that you do to make sure it is up and running for your customers.

Introducing: Our Brand New Dashboard

We’ve been working hard these past two months, ever since we got our previous release out the door. This time, we invested a lot of time and thought on the small items. And one big item as well.

All over the service, you’ll notice some slight changes to the UI. This is an ongoing process to fine-tune the service and make it simpler to use for our customers.

The biggest visible addition to our latest release is the introduction of a new user dashboard.

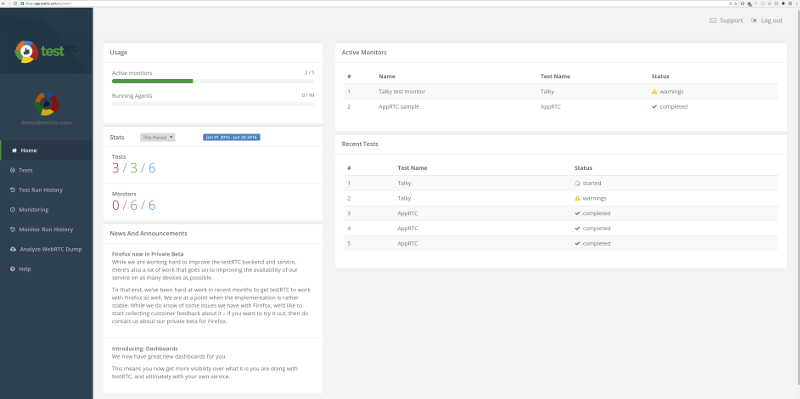
From now one, when a user logs in, he gets a bird’s eye view of his activities in testRTC:

Vive la Experiencia de Apuestas Más Emocionante con Yajuego Colombiano!

¿Estás listo para vivir la experiencia de apuestas más emocionante? En Yajuego Colombiano, podrás sumergirte en un mundo lleno de adrenalina y diversión, donde las apuestas se convierten en una verdadera aventura. En este artículo, descubrirás todo lo que necesitas saber sobre esta plataforma de apuestas en línea y por qué es la opción ideal para aquellos que buscan una experiencia única.

Desde una amplia variedad de juegos de casino hasta apuestas deportivas en tiempo real, Yajuego Colombiano ofrece una gama completa de opciones para satisfacer todos los gustos y preferencias. Además, cuenta con licencia y regulación en Colombia, lo que garantiza un ambiente seguro y confiable para todos los usuarios. Ya sea que estés interesado en probar tu suerte en las máquinas tragamonedas, desafiar a otros jugadores en emocionantes partidas de póker o apostar en tus equipos favoritos, Yajuego Colombiano tiene todo lo que necesitas para una experiencia de apuestas inigualable. ¡No esperes más y descubre todo lo que esta plataforma tiene para ofrecerte!

Descubre la emoción de las apuestas en línea con Yajuego Colombiano

Vive la experiencia de apuestas más emocionante con Yajuego Colombiano. En Yajuego, te ofrecemos una plataforma de apuestas en línea segura y confiable, donde podrás disfrutar de una amplia variedad de juegos y apuestas deportivas. Nuestro objetivo es brindarte la mejor experiencia de entretenimiento, con opciones para todos los gustos y preferencias.

En Yajuego, encontrarás una amplia selección de juegos de casino, desde las clásicas máquinas tragamonedas hasta emocionantes mesas de blackjack y ruleta. Además, podrás apostar en tus deportes favoritos, con una amplia gama de opciones y mercados disponibles. Nuestro equipo de expertos se encarga de ofrecerte las mejores cuotas y promociones, para que puedas maximizar tus ganancias.

Confía en Yajuego Colombiano para vivir la emoción de las apuestas en línea. Nuestra plataforma cuenta con todas las medidas de seguridad necesarias para proteger tus datos personales y transacciones. Además, nuestro equipo de atención al cliente está disponible las 24 horas del día, los 7 días de la semana, para brindarte el mejor soporte en caso de cualquier consulta o inconveniente. ¡Únete a Yajuego y vive la emoción de apostar hoy mismo!

Variedad de juegos y opciones para todos los gustos en Yajuego Colombiano

Vive la experiencia de apuestas más emocionante con Yajuego Colombiano! Descubre la adrenalina de apostar en tus deportes favoritos y disfruta de una amplia variedad de juegos de casino en línea. Con Yajuego, tienes la oportunidad de ganar grandes premios y vivir momentos llenos de emoción y diversión.

No te pierdas la oportunidad de aprovechar el código promocional Yajuego para obtener increíbles bonificaciones y beneficios adicionales. Este código te permitirá acceder a promociones exclusivas y aumentar tus posibilidades de ganar. ¡No esperes más y únete a la comunidad de apostadores de Yajuego para vivir la experiencia de apuestas más emocionante en Colombia!

Yajuego Colombiano te ofrece una plataforma segura y confiable para disfrutar de tus apuestas en línea. Con una amplia selección de deportes y juegos de casino, siempre encontrarás algo que se ajuste a tus gustos y preferencias. No importa si eres un experto en apuestas o si estás comenzando, Yajuego te brinda todas las herramientas necesarias para que vivas una experiencia única y emocionante. ¡Regístrate hoy y utiliza el código promocional Yajuego para empezar a disfrutar de todas las ventajas que esta plataforma tiene para ofrecerte!

Vive la experiencia de apuestas seguras y confiables con Yajuego Colombiano

¡Vive la experiencia de apuestas más emocionante con Yajuego Colombiano! En Yajuego, te ofrecemos una plataforma de apuestas en línea que te brinda la oportunidad de disfrutar de una amplia variedad de juegos y actividades emocionantes. Ya sea que te guste apostar en deportes, jugar a las tragamonedas o probar tu suerte en el casino en vivo, tenemos todo lo que necesitas para vivir una experiencia de apuestas inolvidable.

Nuestro objetivo en Yajuego es proporcionarte un entorno seguro y confiable para que puedas disfrutar de tus apuestas sin preocupaciones. Contamos con licencia y regulación en Colombia, lo que significa que cumplimos con los más altos estándares de seguridad y protección de datos. Además, nuestra plataforma es fácil de usar y está diseñada para ofrecerte una experiencia de juego fluida y sin complicaciones.

En Yajuego, también te ofrecemos una amplia gama de promociones y bonificaciones para que puedas maximizar tus ganancias. Desde bonos de bienvenida hasta promociones exclusivas, siempre encontrarás algo emocionante que te mantendrá entretenido. ¡Así que no esperes más y únete a la emoción de las apuestas en Yajuego Colombiano!

Bonificaciones y promociones exclusivas para maximizar tu diversión en Yajuego Colombiano

¡Vive la experiencia de apuestas más emocionante con Yajuego Colombiano! Si eres amante de la adrenalina y la emoción de las apuestas deportivas, no puedes dejar pasar la oportunidad de unirte a Yajuego. Con una amplia variedad de deportes disponibles para apostar, desde fútbol hasta baloncesto y tenis, encontrarás siempre el evento perfecto para disfrutar al máximo.

Además, Yajuego te ofrece una plataforma segura y confiable para realizar tus apuestas. Con su interfaz fácil de usar y su sistema de pagos seguro, puedes estar tranquilo de que tus ganancias estarán protegidas. No importa si eres principiante o un apostador experimentado, Yajuego te brinda todas las herramientas necesarias para que puedas disfrutar de la emoción de las apuestas sin preocupaciones.

Yajuego también se destaca por sus increíbles promociones y bonificaciones. Desde bonos de bienvenida hasta promociones especiales para eventos deportivos, siempre encontrarás una oferta que se adapte a tus necesidades. Además, Yajuego cuenta con un equipo de atención al cliente disponible las 24 horas del día, los 7 días de la semana, para resolver cualquier duda o problema que puedas tener.

No pierdas más tiempo y únete a la comunidad de Yajuego Colombiano. Vive la emoción de las apuestas deportivas y disfruta de una experiencia única. ¡Regístrate ahora y comienza a ganar con Yajuego!

Soporte al cliente excepcional para una experiencia de apuestas sin igual en Yajuego Colombiano

Vive la experiencia de apuestas más emocionante con Yajuego Colombiano! Si eres amante de las apuestas deportivas y los juegos de casino, Yajuego es tu mejor opción en Colombia. Con una plataforma fácil de usar y una amplia variedad de opciones de apuestas, Yajuego te brinda la emoción y diversión que estás buscando.

En Yajuego, podrás apostar en tus deportes favoritos, desde fútbol hasta baloncesto y tenis. Además, podrás disfrutar de una amplia selección de juegos de casino, como tragamonedas, ruleta y blackjack. Con las mejores cuotas del mercado y promociones exclusivas, Yajuego te ofrece la oportunidad de ganar grandes premios mientras te diviertes.

Además, Yajuego cuenta con un equipo de atención al cliente disponible las 24 horas del día, los 7 días de la semana, para resolver cualquier duda o consulta que puedas tener. Con métodos de pago seguros y rápidos, podrás realizar tus depósitos y retiros de manera fácil y confiable. No esperes más y vive la emoción de las apuestas con Yajuego Colombiano.

En conclusión, Yajuego Colombiano ofrece la experiencia de apuestas más emocionante que podrás encontrar en el mercado. Con su amplia variedad de juegos, bonificaciones y promociones, te garantizamos que nunca te aburrirás. Además, su plataforma segura y confiable te brinda la tranquilidad de saber que tus datos personales y transacciones están protegidos. Ya sea que prefieras las apuestas deportivas, los juegos de casino o las tragamonedas en línea, Yajuego tiene todo lo que necesitas para vivir la emoción de apostar. ¡No esperes más y únete a la diversión en Yajuego Colombiano hoy mismo!

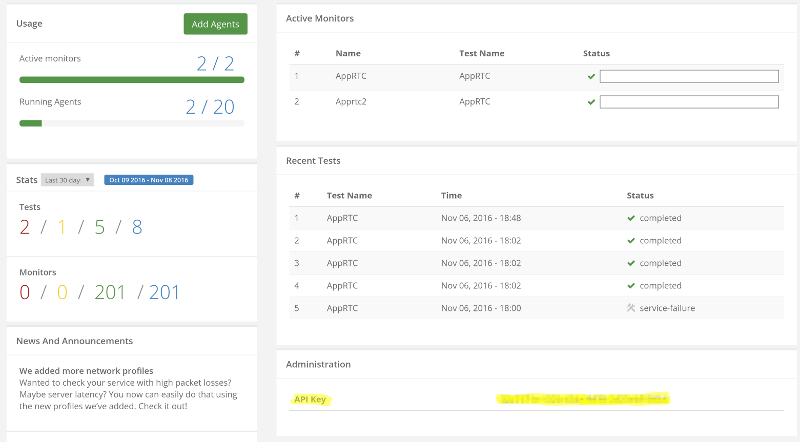
testRTC dashboard

What can you see on the dashboard?

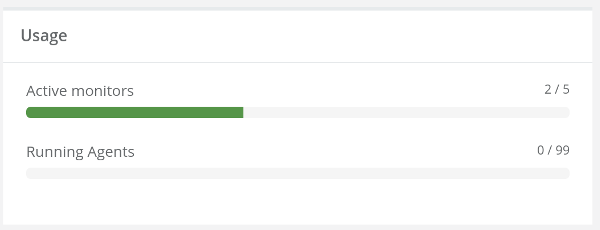
Usage

Usage

This area of the dashboard highlights the usage done in the account.

It allows you to understand what resources are available to you, so if you want to run a stress test, you will be able to use enough browsers.

If you want to do ad-hoc testing with more browsers than are available in your account, you’ll need to holler us and we’re enable more browsers on your account for a period of time.

Stats

Stats

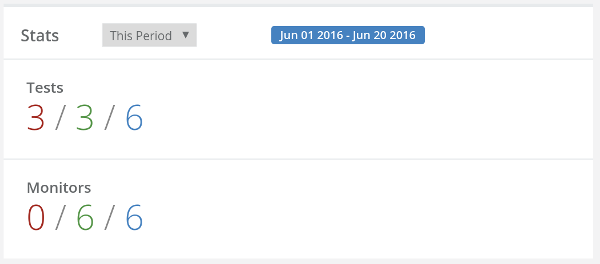
This area shows the statistics of your use over a span of time. It is quite useful for managers to understand how many tests were conducted and know how they fared.

  • In red, we indicate tests and monitor executions that failed for the period selected
  • In green, we indicate tests and monitor executions that succeeded for the period selected
  • In blue, we indicate the total number of tests and monitor executions for the period selected

And you can select a different period to look at.

Active Monitors

Active Monitors

This area indicate what monitors are up and running at the moment, along with the status of the most recent execution.

If you click on any of the rows, it will get you to the monitor run results, filtered for that specific monitor.

Recent Tests

Recent Tests

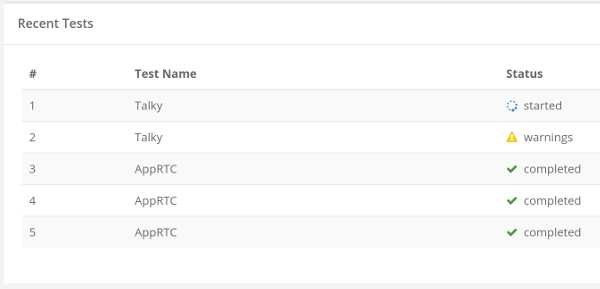
This area shows the last 5 tests that got executed, along with their results.

As with the active monitors, clicking on the test gets you to the results themselves.

News and Announcements

News and Announcements

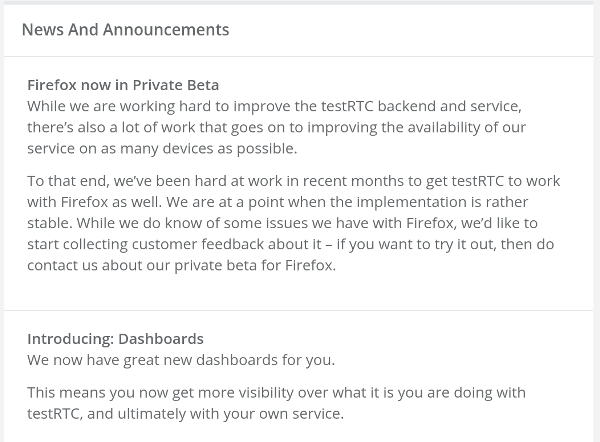
This area shows some news and announcements we have for our users.

What’s Next?

Consider the dashboard a work in progress. We’re sure there’s much to be improved here. We wanted to get this out the door and into the hands of our users. Ping us if you have any suggestions on how to improve it.

If you need to test or monitor a WebRTC product – don’t be shy – sign up for testRTC.

Use our Monitor During Development to Flush Out Your Nastiest WebRTC Bugs

Things break. Unexpectedly. All the time.

One thing we noticed recently is the a customer or two of ours decided to use our monitoring service in their staging versions or during development – and not only on their production system. So I wanted to share this technique here.

First off, let me explain how the testRTC monitoring service works.

In testRTC you write scripts that instruct the browser what to do. This means going to a URL of your service, maybe clicking a few buttons, implementing a form, waiting to synchronize with other browsers – whatever is necessary to get to that coveted media interaction. You can then configure the script for  number of browsers, browser versions, locations, firewall configurations and network conditions. And then you can run the test whenever you want.

The monitoring part means taking a test script in testRTC and stating that this is an active monitor. You then indicate what frequency you wish to use (every hour, 15 minutes, etc.) and indicate any expected results and thresholds. The test will the run in the intervals specified and alert you if anything fails or the thresholds are exceeded.

Luxury Casino: Where Dreams and Games Align!

Imagine a world where opulence and entertainment come together to create an unforgettable experience. Welcome to the realm of luxury casinos, where dreams and games align to offer a breathtaking escape from the ordinary. In this article, we will delve into the world of luxury casinos, exploring the allure of these extravagant establishments and the unparalleled excitement they provide. Get ready to be transported to a world of high stakes and luxurious surroundings as we uncover the secrets behind these exclusive gambling destinations.

From the moment you step foot into a luxury casino, you are enveloped in an atmosphere of grandeur and sophistication. The lavish décor, the shimmering lights, and the sound of spinning roulette wheels create an ambiance that is nothing short of mesmerizing. But luxury casinos are not just about the aesthetics; they are also about the thrill of the game. Whether you are a seasoned gambler or a novice looking to try your luck, these casinos offer a wide range of games that cater to every taste and skill level. Join us on a journey through the world of luxury casinos as we discover the allure of high stakes, the adrenaline rush of placing bets, and the unforgettable memories that can be made within these glamorous walls.

The Allure of Luxury: Exploring the World of High-End Casinos

Welcome to Luxury Casino, the ultimate destination where dreams and games align! Step into a world of opulence and excitement, where every moment is filled with the thrill of winning big. With our exquisite collection of top-notch casino games, impeccable service, and luxurious atmosphere, we guarantee an unforgettable gaming experience that will leave you yearning for more.

Indulge in the finest selection of classic and modern casino games, carefully curated to cater to every player’s taste. From the timeless allure of blackjack and roulette to the adrenaline-pumping action of slots and poker, our extensive range of games offers something for everyone. Whether you are a seasoned player or a novice exploring the world of online gambling, Luxury Casino provides a safe and secure environment that ensures fair play and complete peace of mind. Join us today and let us make your dreams come true!

Unforgettable Experiences: The Extravagant Amenities and Services Offered at Luxury Casinos

Welcome to Luxury Casino, where dreams and games align! Indulge in the ultimate online gaming experience at Luxury Casino, where you can escape into a world of opulence and excitement. With a wide selection of luxurious casino games, exclusive promotions, and a secure gaming environment, Luxury Casino is the perfect destination for discerning players seeking a taste of the high life. Whether you’re a seasoned gambler or new to the world of online casinos, Luxury Casino offers an immersive and thrilling gaming experience that will leave you wanting more.

At Luxury Casino, we pride ourselves on delivering the utmost in luxury and sophistication. Our extensive collection of top-quality casino games, including slots, table games, and progressive jackpots, are designed to provide endless entertainment and the chance to win big. With our state-of-the-art software, seamless gameplay, and stunning graphics, you’ll feel like you’ve stepped into a world-class casino from the comfort of your own home. Join the elite and experience the thrill of Luxury Casino today by visiting https://www.luxurycasinoslots.com/registration/ to create your account and start your luxurious gaming journey!

High Stakes, High Rewards: Unveiling the Thrilling Games and Jackpot Opportunities

Welcome to Luxury Casino, where dreams and games align to create an unforgettable gaming experience. As soon as you step into our virtual casino, you will be transported to a world of opulence and excitement. With our sleek and sophisticated design, you will feel like a VIP from the moment you log in.

At Luxury Casino, we pride ourselves on offering a vast selection of top-quality games to suit every player’s taste. Whether you prefer the thrill of slot machines, the challenge of table games, or the excitement of live dealer games, we have it all. Our extensive collection is constantly updated with the latest and greatest titles, ensuring that you will never run out of options.

Not only do we provide an exceptional gaming experience, but we also prioritize the safety and security of our players. Luxury Casino is licensed and regulated by the Malta Gaming Authority, guaranteeing fair play and secure transactions. Our state-of-the-art encryption technology ensures that your personal and financial information is always protected.

Join Luxury Casino today and embark on a journey of luxury and entertainment. With our generous welcome bonus, rewarding loyalty program, and 24/7 customer support, we are dedicated to providing the best possible experience for our players. Don’t miss out on the opportunity to indulge in the ultimate online casino experience at Luxury Casino!

Opulence and Elegance: How Luxury Casinos Create a Glamorous Atmosphere

Welcome to Luxury Casino, where dreams and games align to provide an unparalleled gaming experience. As soon as you step into our virtual world, you will be greeted with a sense of opulence and sophistication. Our meticulously designed platform offers a wide range of thrilling casino games, ensuring that there is something to suit every taste and preference.

At Luxury Casino, we pride ourselves on delivering the ultimate luxury gaming experience. With our state-of-the-art software and cutting-edge technology, you can expect seamless gameplay and stunning graphics that will transport you to a world of glamour and excitement. Whether you’re a fan of classic table games like blackjack and roulette, or prefer the thrill of spinning the reels on our vast selection of slot machines, Luxury Casino has it all. With our generous bonuses and promotions, you’ll have even more chances to win big and make your dreams a reality. Join us today and embark on a journey where luxury and gaming collide!

From Monte Carlo to Las Vegas: Iconic Luxury Casinos Around the World

Welcome to Luxury Casino, where dreams and games align to create an unrivaled gaming experience. Step into a world of opulence and excitement as you indulge in our luxurious selection of casino games. With cutting-edge technology and a sophisticated atmosphere, we bring the thrill of a real-life casino straight to your fingertips.

Prepare to be captivated by our vast array of games, ranging from classic table games like blackjack and roulette to the latest video slots and progressive jackpots. Our collection is carefully curated to ensure that every player finds their perfect match. Whether you’re a seasoned gambler or a novice looking to try your luck, Luxury Casino offers something for everyone.

At Luxury Casino, we pride ourselves on providing an unparalleled level of service and support. Our dedicated team of professionals is available around the clock to assist you with any inquiries or concerns you may have. With our secure and fair gaming environment, you can rest assured that your personal information and transactions are protected at all times. Join us at Luxury Casino and experience the epitome of luxury gaming today!

At Luxury Casino, dreams and games come together to create an unforgettable experience. With a wide selection of luxurious games and a commitment to excellence, this online casino truly stands out from the rest. From the moment you enter the virtual doors, you are transported to a world of opulence and excitement. The sleek and elegant design, combined with the highest quality graphics and sound effects, sets the stage for an immersive gaming experience like no other. Whether you are a seasoned player or new to the world of online casinos, Luxury Casino has something to offer everyone. With a vast array of games to choose from, including slots, table games, and progressive jackpots, you are sure to find your favorite. Plus, with their generous welcome bonus and ongoing promotions, you’ll always have something to look forward to. So why wait? Join Luxury Casino today and let your dreams come true!

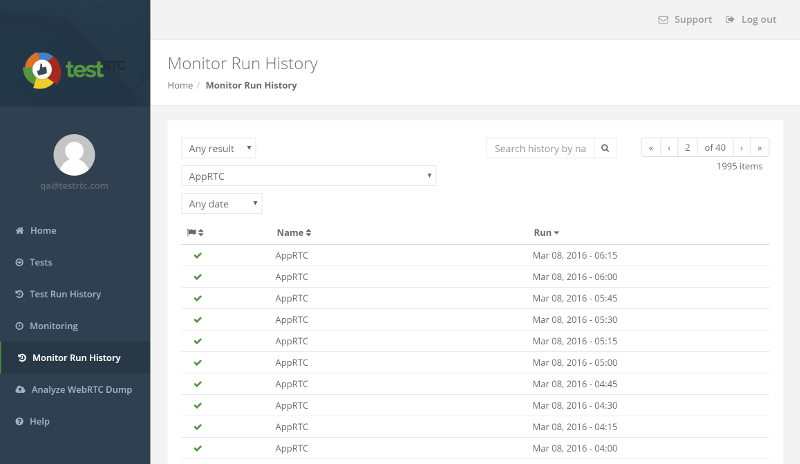
Here’s one of the ways in which we test our own monitor – by running it against AppRTC:

Monitoring AppRTC using testRTC

What you see above is the run history – the archive. It shows past executions of the AppRTC monitor we configured and their result. You should already know how fond I am of using AppRTC as a baseline.

We’ve added this service as a way for customers to be able to monitor their production service – to make sure their system is up and running properly – as opposed to just knowing the CPU of their server is not being overworked. What we found out is that some decided to use it on their development platform and not only the production system.

Why?

Because it catches nasty bugs. Especially those that happen once in a lifetime. Or those that need the system to be working for some time before things start to break. This is quite powerful when the service being tested isn’t pure voice or video calling, but has additional moving parts. Things such as directory service, databases, integration with third party services or some extra business logic.

The neat thing about it all? When things do break and the monitor catches that, you get alerted – but more than that, you get the whole shebang of debugging information:

  • Our reports and visualization
  • The webrtc-internals dump file
  • The console log
  • Screenshots taken throughout the session
  • In our next release, we’re adding some more tools such as an automatic screenshot taken at the point of failure

Those long endurance testing QA people love doing on systems for stretches of days or weeks? You can now set it up to run on your own systems, and get the most out of it when it comes to collection of post mortem logs and data that will assist you to analyze, debug and fix the problem.

Come check us out – you won’t regret it.

2

The day Talky and Jitsi failed – and why end-to-end monitoring is critical

It was a bad day for me. 14 January 2016.

I had a demo to show to a customer of testRTC. Up until that point, the demos we’ve shown potential customers were focused on Jitsi or Talky (depending on who did the demo).

There were a couple of reasons for picking these services for our demos:

  1. They are freely available, so using them required no approval from anyone
  2. They require no login to use, so the script on top of them was a simple one to explain and showcase
  3. They support video, making them visual – a good thing in a demo
  4. They support more than two participants, which shows how we can scale nicely
  5. In the case of Jitsi, you can visually see if the session is relayed or not – making it easy to show how our network configuration affects WebRTC media routing

We used to use them a lot. For me, they were always stable.

Until 14th of January last month, when both mysteriously failed on me. The failure was a subtle one. The site works. You can join sessions. You can see your camera capture. It tells you it is waiting for other participants to join. But it does that also when someone joins – that other participant? He sees the same message exactly.

You have two or more people in the same session, all waiting for each other, when they are already all effectively “in the meeting”.

Our scheduled demos for the day failed. We couldn’t show a decent thing to customers – relying on a third party was a small mistake – we switch to show demo on other services – but it cost us time in these meetings. Since then, we’ve gone AppRTC for our baseline.

I don’t know why Jitsi and Talky failed on the same day. They both make use of the Jitsi Videobridge, but I don’t believe it was related to the videobridge or even to the same issue – just a matter of coincidence.

While these things happen to all of us, we need to strive for continuous improvement – both in the time it takes us to find an issue as well as fixing it.