Tag Archives for " multiparty "

Automated WebRTC Testing using testRTC

Yesterday, we hosted a webinar on testRTC. This time, we were really focused on showing some live demos of our service.

I wanted this one to be useful, so I sat down earlier this week, working on a general story outline with the idea of showing live how you can write a test script from scratch, building more and more capabilities and functionality into it as I went along.

It was real fun.

If you missed it, I’d like to invite you to watch the replay:

watch @ crowdcast

For the purpose of this webinar, I took Jitsi Meet (https://meet.jit.si/) and created the following scripts for it:

  1. Simple one-on-one test
    • Then I cleaned it up a bit from nagging warnings
    • And added a few basic expectations
  2. 4-way video test
    • For this one I’ve added some synchronization across the probes, and made sure Jitsi is the one generating the random rooms
    • I changed the script to be aware of sessions (parallel meeting rooms in the same test)
    • Then I played with the test reconfiguring it to run 40 probes, 8 in each meeting room
  3. One-on-one test with network limits
    • Switched back to a 1:1 session, this time with the flexibility we achieved in (2)
    • Increased the test length to 3 minutes
    • Injected 5% packet loss to the test in the second minute of the test

I also went over some of the results from the Kurento post we’ve published yesterday and went through the screen sharing script we’ve written recently about that uses appear.in as an example

One of the things I was asked is to share the scripts used throughout the session.

So I cleaned up the scripts a bit and placed them on our Google Drive. I am sharing them here in two forms:

  1. The GDoc file of the script – open it to read, copy+paste it to wherever
  2. The JSON file of the script – you can import this one directly into your testRTC account (you’ll need to reconfigure the probe profiles before you run it):

Here they are:

  1. Simple one-on-one test: GDocJSON
  2. 4-way video test: GDocJSON
  3. One-on-one test with network limits: GDocJSON

We’re here for any questions you may have.

24

How Many Sessions Can a Kurento Server Hold?

Here’s a question we come across quite often at testRTC.

You decided to self develop your own service. Manage your own media servers. And now that time comes to understand your ongoing costs as well as decide on the scale out scheme – at what point do you launch/spawn a new server to take up some of the load from your current media servers farm? How many users can you cram into a single media server anyway?

We decided to check just that, doing it with the help of WebRTC.ventures who worked with us on the setup.

For the purpose of these set of sizing experiments, we picked up Kurento, one of the most versatile open source media servers out there today. We selected a few key scenarios, and WebRTC.ventures installed the server and configured it for us.

We then used our testRTC probes to understand how many users can we cram on the server in each scenario.

Simple scenario sizing is one step in the process. If you are serious about your service, then check out our best practices to stress testing your WebRTC application.

Get the best practices guide

Why Kurento?

There are a couple of reasons why we picked Kurento for this one.

  1. Because many use it out there, and we’ve been helping customers understand and debug it when they needed to
  2. It is versatile. We could try multiple scenarios with it with relative ease and little programming (although that wasn’t our part of the project)
  3. It does media processing beyond just routing media. We wanted to see how this will affect the numbers, especially considering the last reason below
  4. It’s the first of a few media servers we’re going to play with, so stay with us on this one

The Scenarios

For the Kurento service, we picked up 3 different scenarios we wanted to test:

  1. 1:1 video calls. A typical doctor visitation or similar scenario, where two participants join the same session and the session gets recorded (two separate streams, one for each participant).
  2. 4-way group video calls. The classic scenario, in an MCU configuration. Kurento decodes and encodes all media streams, so we’re giving it quite a workout
  3. Live broadcast. A single person talking to a large group of viewers.

For scenarios (1) and (2) our question is how many concurrent sessions can the Kurento server hold.

For scenario (3) our question is how many viewers for a single broadcast can the Kurento server hold.

The Setup

To set things up for our test, we did the following:

  • We went for a simple AWS t2.medium machine, but quickly had to switch to a more capable machine. We ended up with a c4.2xlarge instance (8 vCPU, 15 GB RAM) on AWS
  • We had it monitored via New Relic, to be able to check the metrics (but later decided to forgo this approach and just use top with root access directly on the machine)
  • We also had an easy way to reset the Kurento server. We knew that rattling it too much between tests without a reset would affect our results. We wanted a clean slate each time we started

The machine was hosted in Amazon US-East.

testRTC probes were coming in from a different cloud vendor, East and West US locations.

We didn’t do any TURN related stuff – so our browser traffic hit the Kurento server directly and over UDP.

The Process

For each scenario, we’ve written a simple test script that can scale nicely.

We then executed the test script in its minimal size.

For 1:1 video calls and broadcasts we used 2 probes and for the 4-way group video call we started with 4 probes.

We ran each test for a period of 4-5 minutes, to check the stability of the media flow.

We used that as the baseline of our results and monitored to see when adding more probes caused the media metrics to start faltering.

1:1 Video Calls

The above screenshot is what you’ll see if you participated in these sessions. There’s a picture in picture view of the session, where the full screen area is the remote incoming video and the smaller window holds our local view.

Baseline

Kurento’s basic configuration limits bitrate of calls to around 500kbps. This can be seen from running a single session in our high level chart:
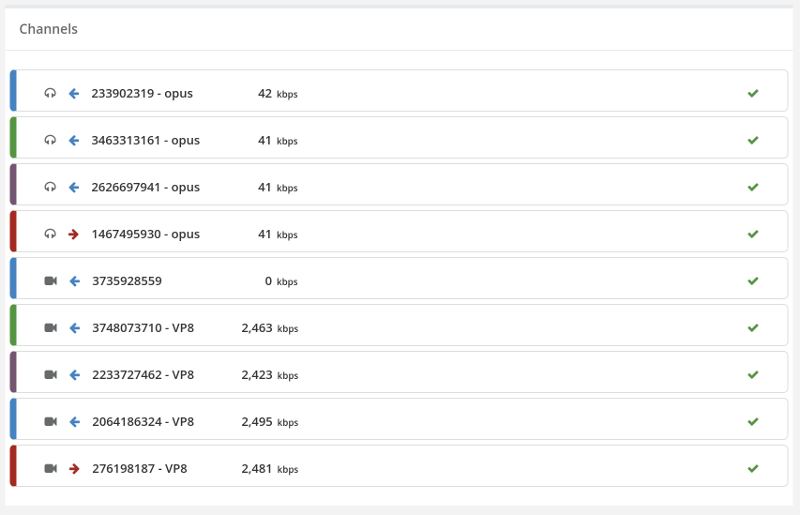
And here’s the stats on the channels of one of the two probes in this baseline test run:
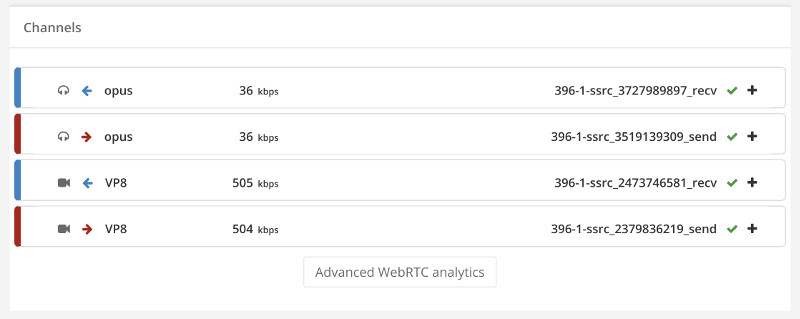
Now that we have our baseline, it was time to scale things up.

30 Probes (=15 sessions)

When we went up to 30 probes, running in 15 parallel 1:1 video sessions, we ended up with this graph:
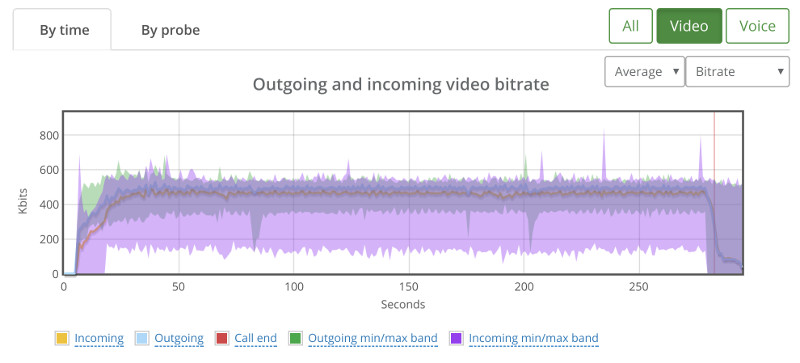
While the average bitrate is still around 500kbps, we can see that the min/max bands are not as stable.

If we look at the packet loss graph, things aren’t happy (the baseline had no packet losses):
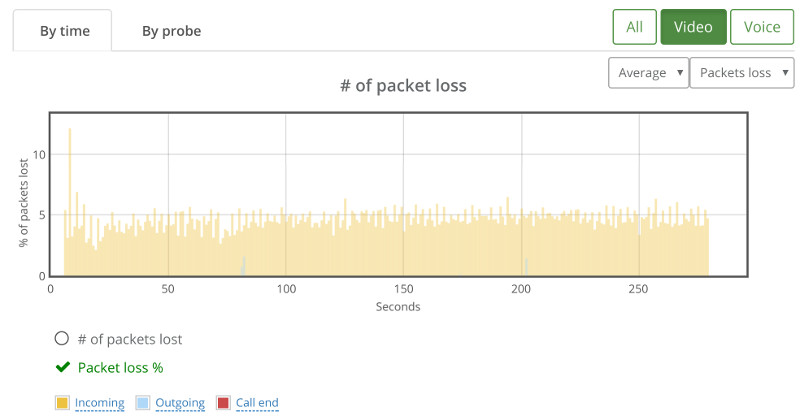
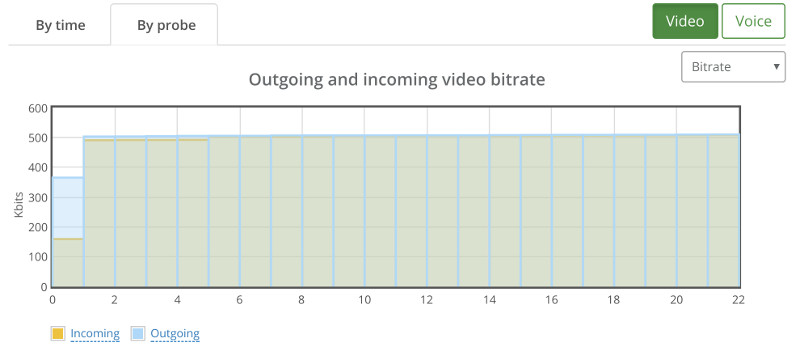
This is where we went for the “By probe” tab, looking at individual bitrates across the probes:
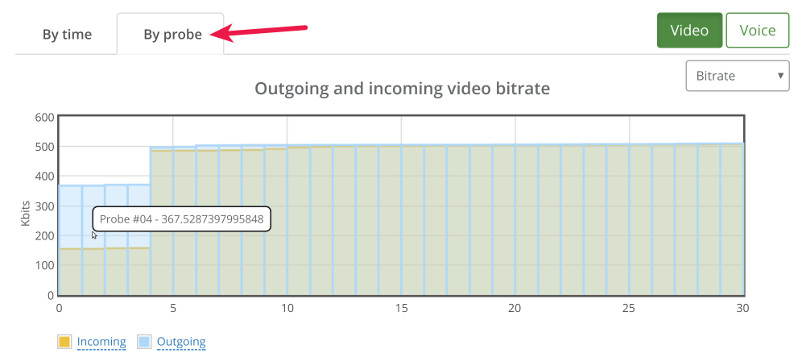
What we can see immediately is that 4 probes out of 30 didn’t get the full attention of the Kurento media server – they got to send and receive less than 500kbps.

If we switch to the packet loss by probe, we see this:
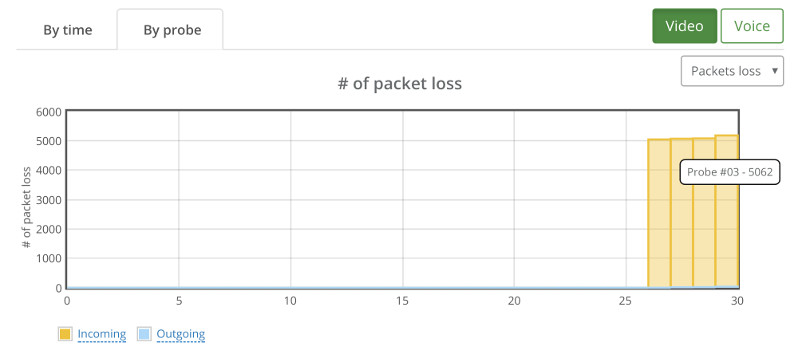
A couple of things that come to mind:

  1. Kurento degrades quality to specific sessions and not across the board. Out of 30 users, 22 got the expected results, 4 had lower bitrates and another 4 had packet losses
  2. There’s correlation here. When Probe #04 exhibits reduction in bitrate, Probe #3 reports incoming packet losses

From here, we can easily go down the path of drilling down to the probes that showed issues. I won’t do it now, as there’s still a lot to cover.

22 Probes (=11 sessions)

It stands to reason then that lowering the capacity to 22 probes should give us pristine results.

Here’s what we’ve seen instead:
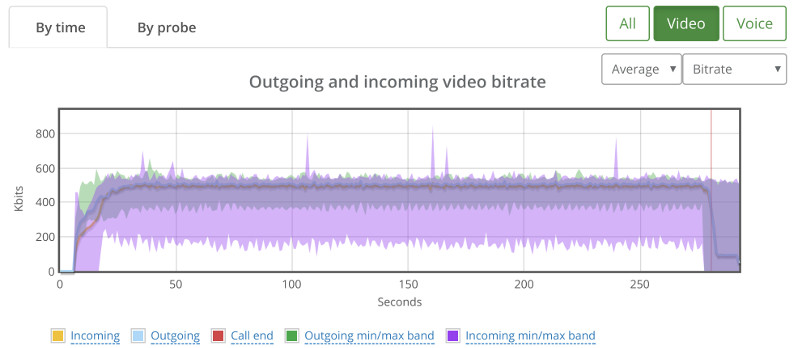
We still have that one session that goes bad.

20 or 18?

When we went down to 18 or 20 probes, things got better.

With 20 the issue is that we couldn’t really reproduce a good result at all times. Sometimes, the scenario worked, and other times, it looked like the issues we’ve seen with the 22 probes.

18 though seemed rather stable when tested a couple of times:
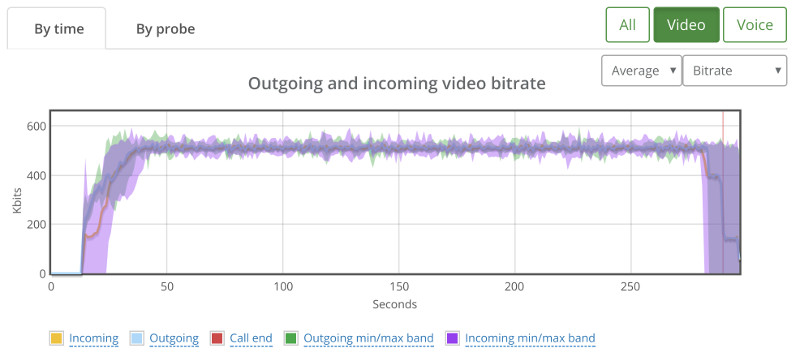
Depending on the service you’re offering, I’d pick 18. Or even go down to 16…

4-Way Group Video Calls

The above is a screen capture of the 4-way group video call scenario we’ve analyzed.

In this case, each probe (browser) sends out video at a resolution of 640×360 and receives a video resolution of 800×600.

The screenshot doesn’t show the images getting cropped, so we can assume the Kurento media server takes the following approach to its pipeline:
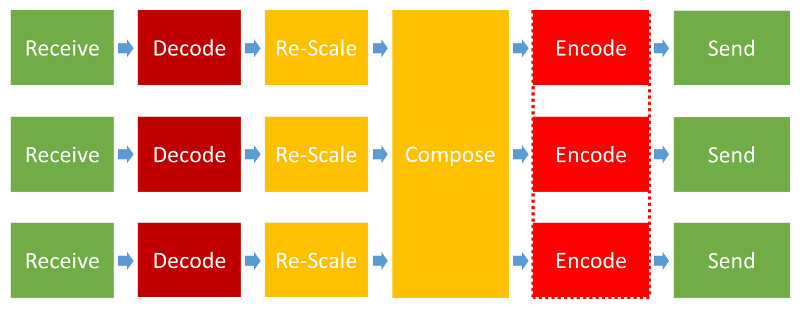
That’s lots of processing needed for each probe added, which means we can expect lower scaling for this scenario.

Baseline

Our baseline this time is going to need 4 probes.

Here’s high the high level video graph looks like:
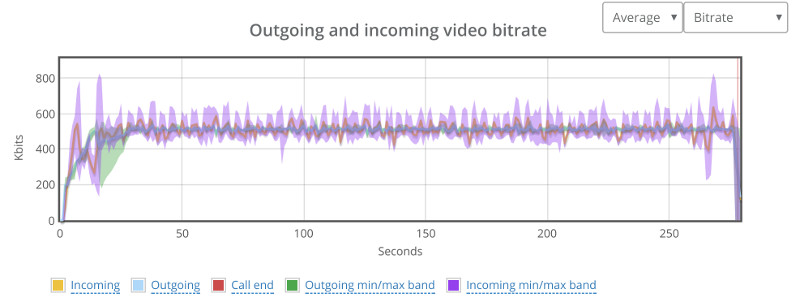
Not as stable as our 1:1 video calls, but it should do for what’s coming.

Note that each probe still has around 500kbps of video bitrate.

I’ll skip the drill down into the results of a specific probe metrics and take this as our baseline.

20 Probes (=5 sessions)

Since 1:1 video sessions didn’t go well above 20, we started there and went down.

Here’s how 20 probes look like:
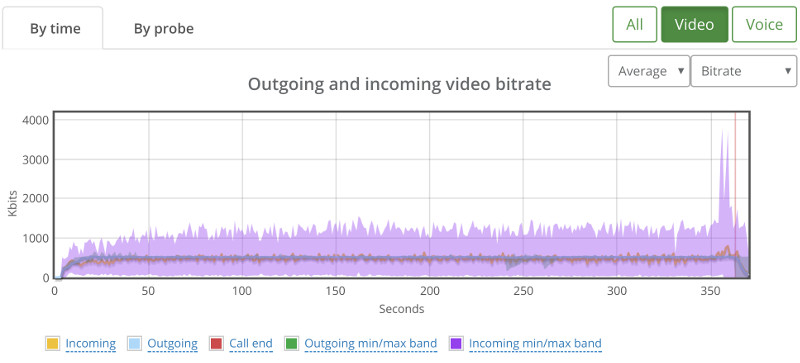
Erratic.

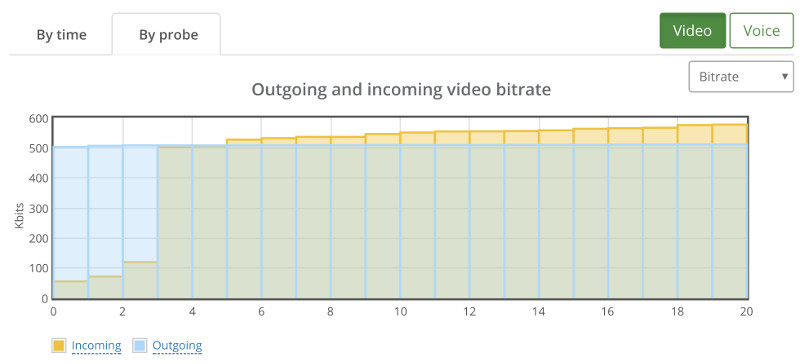
Checking packet losses and bitrates by probe yielded similar results to the bad 1:1 sessions. Here’s the by probe bitrate graph:
Going down to 16 probes (=4 sessions) wasn’t any better:
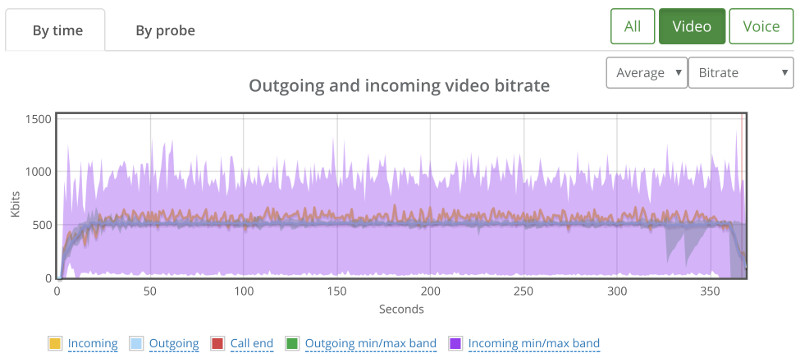
I’ve actually looked at the bitrates and packet losses by probe, and then decided to map them out into the sessions we had:
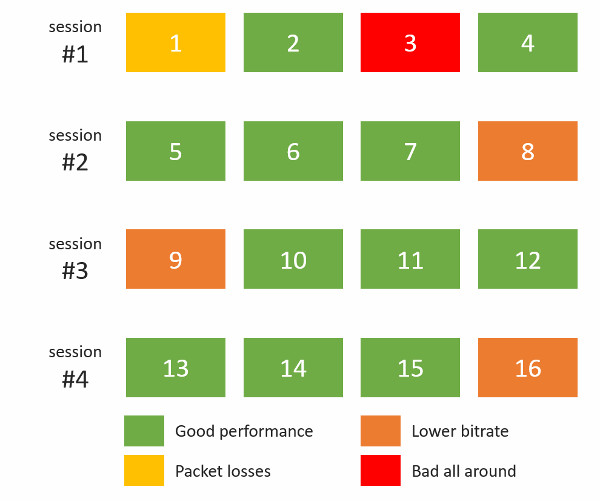
This paints a rather grim picture – all 4 sessions hosted on the Kurento server suffered in one way or another. Somehow, the bad behavior wasn’t limited to one session, but showed itself on all of them.

Down to 12 Probes (=3 sessions)

We ended up with 12 probes showing this high level bitrate graph:
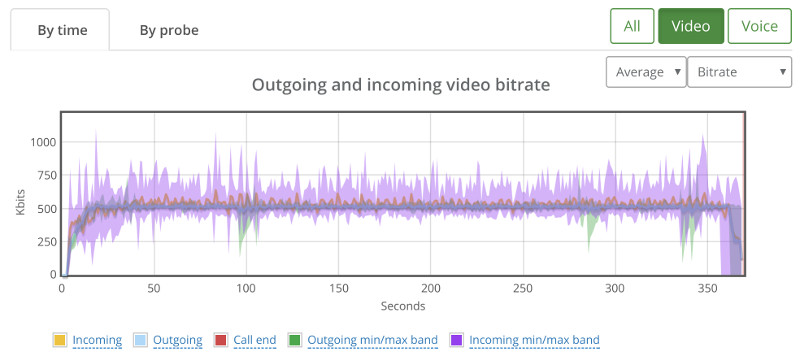
It showed some sporadic packet losses that were spread across 3 different probes. The following shows the high level by probe bitrate graph:
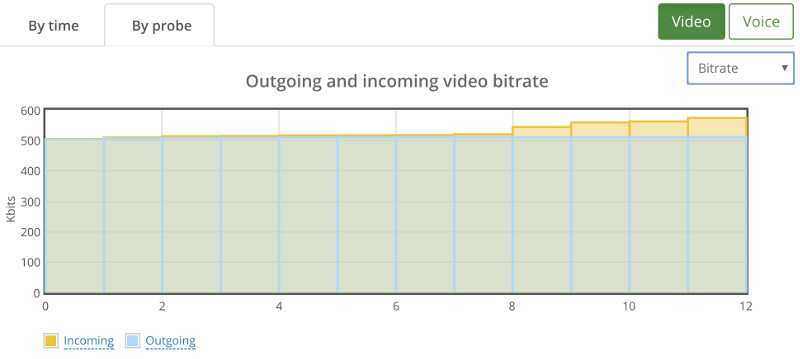
There’s some instability in the bitrates and the packet losses which will need some further investigation, but this is probably something we can work with and try and optimize our service to run well.

Live Broadcast
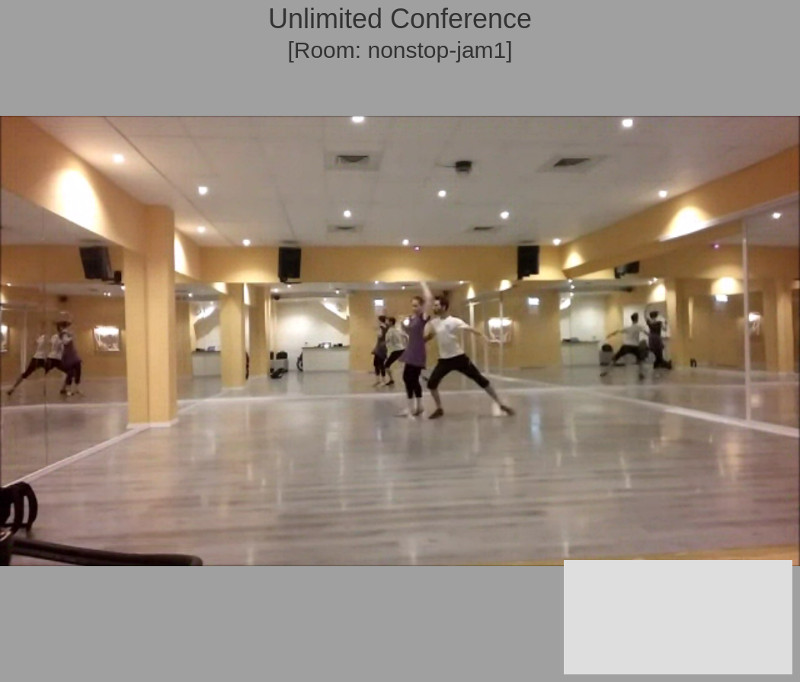
The above screenshot shows what a viewer sees on a live broadcast scenario that we’ve set up using Kurento.

We’ve got multiple testRTC probes joining the same broadcast, with the first one acting as the broadcaster and the rest are just viewers.

Baseline

Our baseline this time is going to need 2 probes. A broadcaster and a viewer.

From now on, we’ll be focusing on what the viewers experience – a lot more than what happens to the broadcaster.

We’re still in the domain of 500kbps for the video channel:
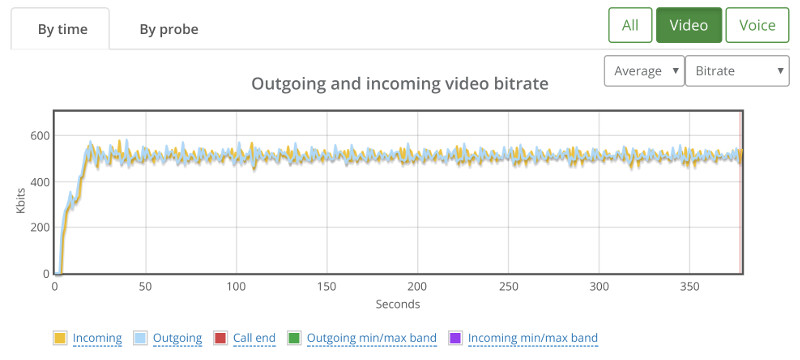
One thing to remember here – outgoing media happens only for our broadcaster probe and incoming media happens for all the other probes.

30 Probe (=29 viewers)

We started with 30 probes – assuming we will fail miserably based on our previous tests, and got positively surprised:

Solid bitrate for this test.

Climbing up

We’ve then started moving up with the numbers.

50, 60 and 80 probes went really well.

Got our appetite, and jumped towards 150 probes.

And ended up with this high level graph:
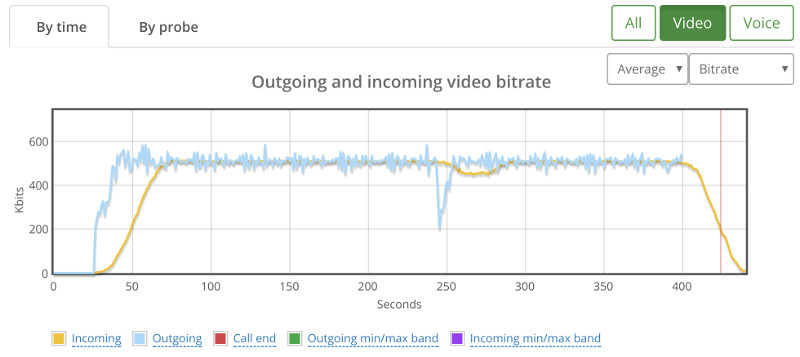
There wasn’t any packet loss to indicate why that drop with the broadcaster at around 240 seconds, so I switch to the “By probe” view.

This showed that things were starting to deteriorate somewhat:

We’re sorting the results just for this purpose – you can see there’s a slight decline in average bitrate across the probes here – something that is a lot less apparent for smaller test sizes. There was no packet loss.

We’ve tried going upwards to 200, but then 12 probes didn’t even connect properly:
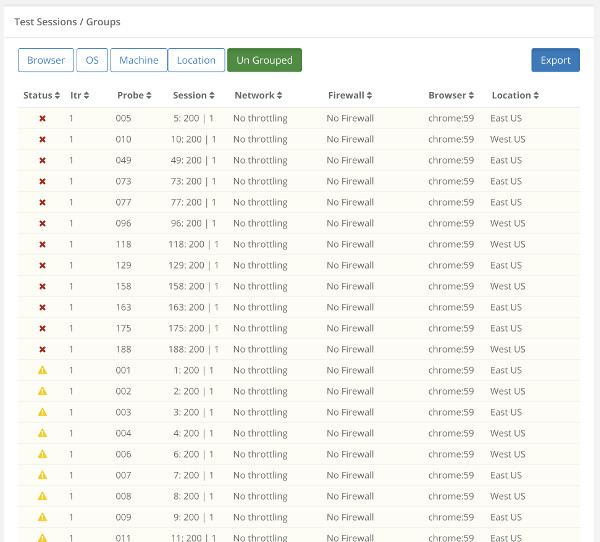
Going down to a 100 yielded some connection errors in some of the probes as well. Specifically, I saw this one:

This indicates we’ve got a wee bit of an issue here that needs to be solved before we can continue our stress tests any further. Most probably in the signaling layer of our server. It is either unstable when we place so many viewers at once against it, or just doesn’t really handle the load well enough.

Results Summary

The table below shows the various limits we’ve reached in our rounds of sizing tests:

Scenario Size
1:1 video calls 18 users in 9 parallel sessions
4-way group video calls 3 rooms of 4 users each
Live broadcast 1 broadcaster + 80-150 viewers

What did we learn?

  1. Stress testing for sizing purposes is fun. I actually enjoyed going through the results and running a couple of tests of my own (I didn’t write the scripts or run the initial tests – I delegated that to our support engineer)
  2. Different scenarios will dictate very different sizing. With more time, I’d start working out on finding the bottlenecks and optimizing them – I’m sure more can be squeezed out of a Kurento machine
  3. Once set up and written intelligently, it’s really easy to rerun the tests and change the number of probes used

Next Steps

Once we got to the sweet spot in each scenario, the next thing to do would probably to run it more than once.

We usually setup a testRTC monitor to run once every 15 minutes to an hour for a couple of days on such a scenario, just to make sure we’re seeing stable results more than once.

Other than that, this needs to be tested under different network conditions, varying load factors, etc.

Check out our best practices for stress testing WebRTC applications. It is relevant even if you are not using testRTC

Get the best practices guide

I’d like to thank WebRTC.ventures for the assistance in setting this one up. If you are looking for a capable vendor to custom build your WebRTC application – check them out.

2

3 Synchronization techniques to test WebRTC at scale

Testing WebRTC is hard enough when you need to automate a single test scenario with two people in it, so doing things at scale means lots more headache.

We’ve noticed that in the past several months where more developers have started using our service to understand the capacity they can load on a single server. And as we do with all of our customers, we assisted them in setting up the scripts properly – it is still early days for us, so we make it a point to learn from these interactions.

What we immediately noticed is, that while our existing mechanisms for synchronization can be used – they should be used slightly differently because at scale the problems are also different.

How do you synchronize with testRTC?

There are two main mechanisms in testRTC to synchronize tests, and we use them together.

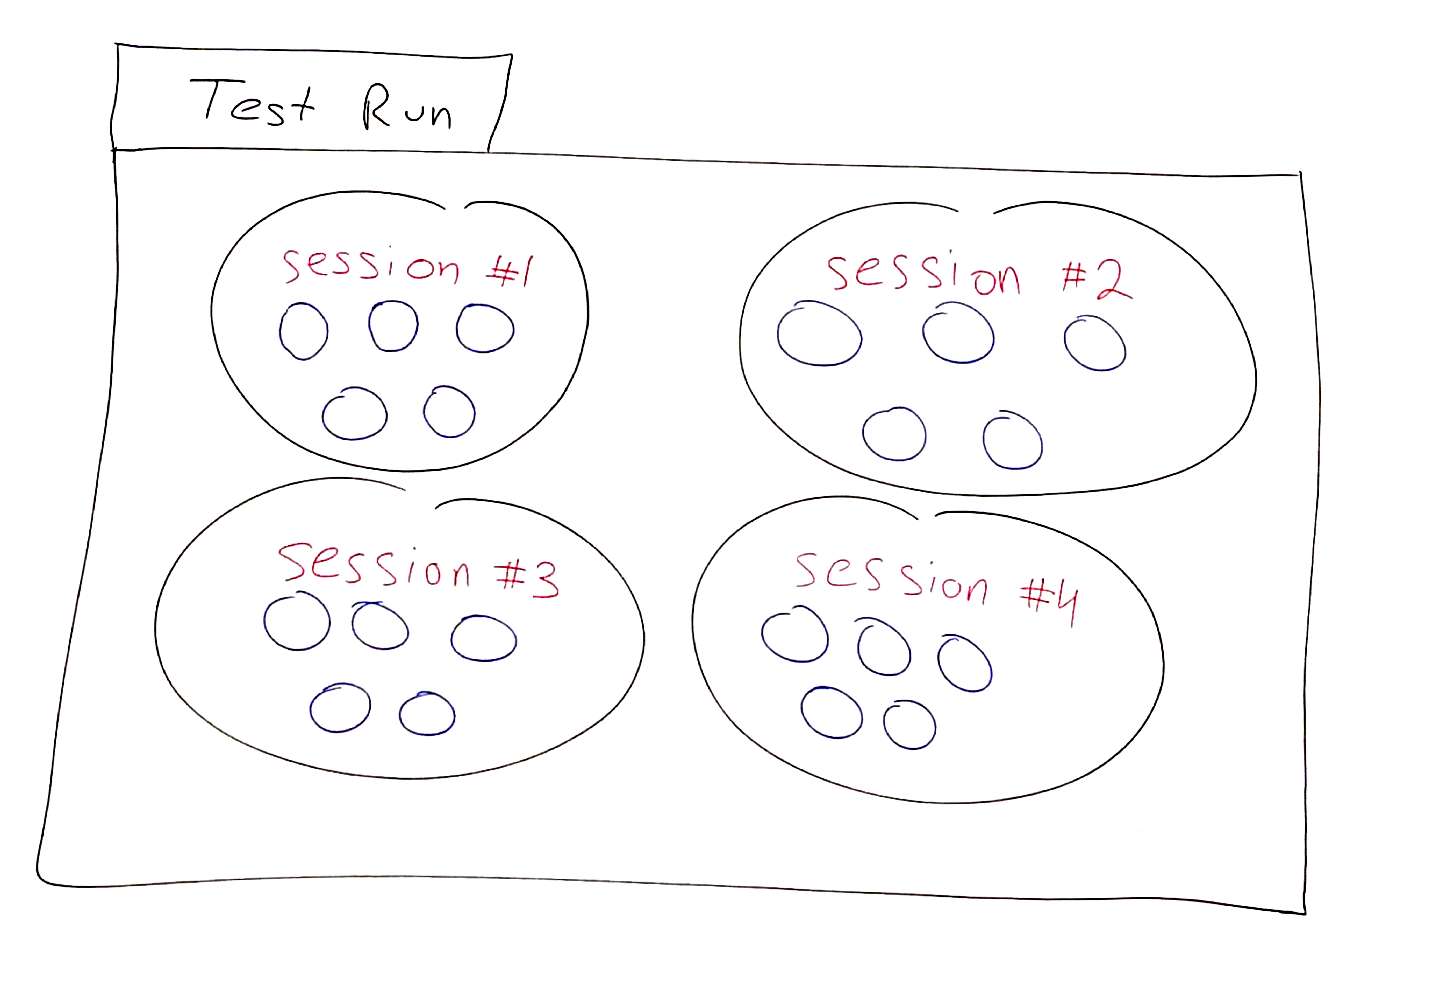
What we do is think of a test run as a collection of sessions. Each session has its own group of agents/browsers who make up that session. And inside each such session group – you can share values across the agents.

So if we want to try and do a test run for our WebRTC service similar to the above – 4 video conference calls of 5 browsers in each call, we configure it the following way in testRTC:

While this is all nice and peachy, let’s assume that in order to initiate a video conference, we need someone in each group of 5 browsers to be the first to do *something*. It can be setting up the conference, getting a random URL – whatever.

This is why we’ve added the session values mechanism. With it, one agent (=browser) inside the session, can share a specific value with all other agents in his session – and agents can wait to receive such a value and act upon it.

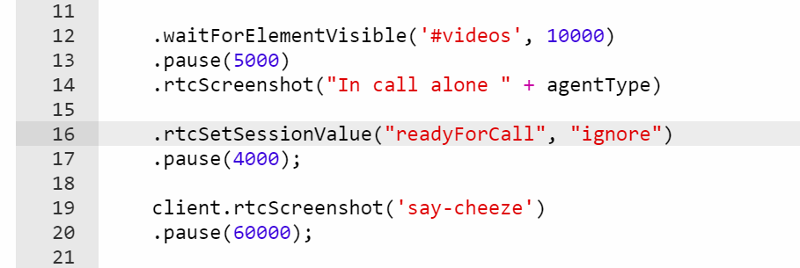
Here’s how it looks like for a testRTC agent to announce it logged in and is ready to accept an incoming call for example:

We decided arbitrarily to call our session key “readyForCall”, and we used an arbitrary value of “ignore” just because.

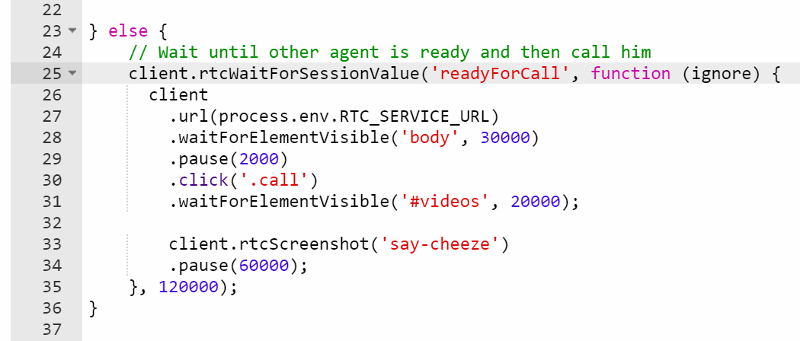
On the ‘receiving’ end here, we use the following code:

So now we have the second browser in the session waiting to get a value for “readyForCall”, and in this simple case, ignore the value and click the “.call” button in the UI.

This technique is something we use all the time in most of the scripts these days to get agents to synchronize their actions properly.

How do we scale a WebRTC test up?

The neat thing about these session values is that they are get signaled around only within the same session. So if we plan and write our test script properly, we can build a single simple session where browsers interact with each other, and then scale it up by increasing the size of the session to what we want and the size of the concurrent agents in the test run.

With our video conferencing service, we start with a 3-way session, using 3 agents. We designate agent #1 in the session as our “leader”, who must be the first to login and setup the session. Once done, he sends the URL as a session value to the other agents in the session.

The moment we want to scale that test up, we can grow the session size to 5, 10, 20, 100 or more. And when we want to check multiple video conferences in parallel, we can just grow the number of concurrent agents in the test run but leave the session size smaller.

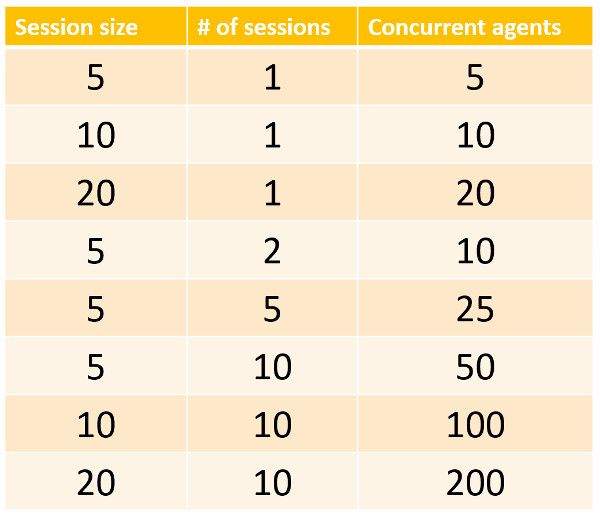
A typical configuration for several test runs of scale tests will look like this:

  1. Start with 5 agents in a single session
  2. Then run 10 agents in 2 sessions (5 agents per session)
  3. End with 200 agents in 10 sessions (20 agents per session)

What will usually go wrong as we scale our WebRTC scenario?

Loads of things. Mainly… load.

We’ve seen servers that break down due to poor network connection. Or maxed out CPU. Or I/O as they store logs (or media recordings) to the disk. And bad implementations and configurations. You name it.

There are though, a few issues that seem to plague most (all?) WebRTC based services out there. And the main one of them is that they hate a hoard logging in at roughly the same time.

That just kills them.

You take 20 browsers. Point them all to the same URL, in order to join the same session, and you get them to try it out all together in the span of less than a second. And things fall down in pieces.

I am not sure why, but I have my own doubts and ideas here (something to do with the way RTCPeerConnection is used to maintain these media streams and how the SFUs manage it internally in their own crazy state machine). Now, for the most part, customers don’t care. Because this usually won’t happen in real life. And if it does – the user will hit F5 to refresh his browser and the world will get back to normalcy for him. So it gets lower priority.

Which leads us again to synchronization issues. How can we almost un-synchronize browsers and have them NOT join together, or at least have them join “slower”?

We’ve devised a few techniques that we are using with our customers, so we wanted to share them here. I’ll call them our 3 synchronization techniques for testing WebRTC at scale.

Here they are.

#1 – Real-users-join-randomly

This is as obvious as it gets.

If we have 10 users that need to enter the same session, then in real-life they won’t be joining at the exact same time. Our browsers do. So what do you do? You randomize having them join.

For 3 browsers, we have them all join “at the same time”, we just spread it around a bit – just like in the illustration below, where you can see in the red lines where each browser decided to join:

Here’s how we usually achieve that in testRTC:

#2 – Pace-them-into-the-service technique

Random doesn’t always cut it for everyone. This becomes an issue when you have 100 or more browsers you want to load the server with. I am not sure why that is, as it has nothing to do with how testRTC operates (how do I know this? Using the same test on something like AppRTC with no pacing works perfectly well), but again – developers are usually too busy to look at these issues in most of the scenarios that we’ve seen.

The workaround is to have these browsers “walk in” to the room roughly one after the other, at a given interval.

Something like this:

Here, what we do is pacing the browsers to join in a 300 milliseconds interval from one another. The script to it will be similar to this:

This is a rather easy method we use a lot, but sometimes it doesn’t fit. This occurs when timing can get jumbled due to network and other backend shenanigans of services.

#3 – One-after-the-other technique

Which is why we use this one-after-the-other technique.

This one is slightly more difficult to implement, so we use it only when necessary. Which is when the delay we wish to create doesn’t sit at the beginning of the test, but rather after some asynchronous action needs to take place – like logging in, or waiting for one of the browsers to create the actual meeting place.

The idea here is that we let each browser join only after another one in the list as already joined. We create a kind of a dependency between them using the testRTC synchronization commands. This is what we are trying to achieve here:

So we don’t really care how much time each browser takes to finish his action – we just want to make sure they join in an orderly fashion.

Usually we do that from the last browser in the session down to the first. There are three reasons why:

  1. It looks a lot smarter – like we know what we’re doing – so my ego demands it
  2. It makes it easier to scale a session up, since we’re counting down the numbers down to zero
  3. We can stop in the middle easily, if we have different types of browsers in the same session

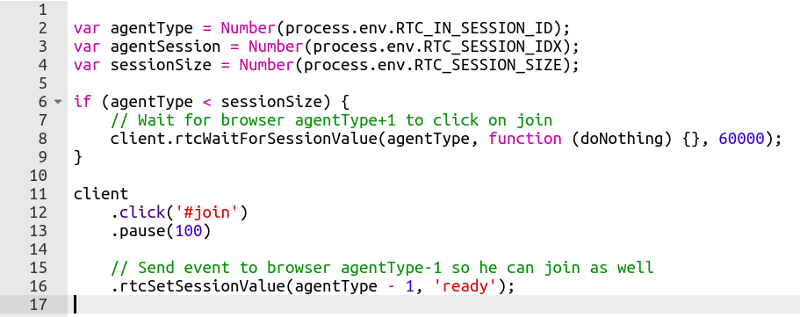
Here’s how the code for it looks like:

Here, what happens is this:

  • agentType holds the index number of the running browser inside the session
  • sessionSize holds the number of browsers in a single session
  • If we are not the last browser in the session, then we wait until the next browser tells us he is ready (line 8). When he does, we join (line 12) and then we tell the previous browser in line that we are ready (line 16)
  • If we are the last browser, we just join and tell the previous one that we’re ready

A bit more complex, so we save it for when it is really necessary.

What’s next?

Here’s what we’ve learned:

  1. We use session and session values for synchronization and scale purposes
    1. We split a test run into group of browsers, designated to their own sessions
    2. Inside a session, we can give different roles to different browsers
    3. This enables us to pick and choose the size of a session and the size of a test run easily
  2. In most cases, large sessions don’t like browsers joining all at once – it breaks most services out there (and somehow, developers are fine with it)
  3. There are different ways to get testRTC to mimic real life when needed. Different techniques support different scenarios

If you are planning on stress testing your WebRTC service – and you probably will be at some point in time, then come check us out. Here are a few of the questions we can answer for you:
  • How many users can I cram into a single session/room/conference without degrading quality?
  • How many users can a single media server I have support?
  • How many parallel sessions/rooms/conferences can a single media server I have support?
  • What happens when my service needs to scale horizontally? Is there any degradation for the users?

Partial list, but a good starting point. See you in our service!

6

Executing a WebRTC test that scales

There’s a growing trend from the companies that come to testRTC in recent months, and it has to do with the focus of what they are looking for.

Most are less interested in how testRTC can be used for functional testing – things like coverage of scenarios and finding edge cases and automating tests for them. What people are interested now when they want to run a WebRTC test scenario is how to scale it.

Customers typically try to take stress in WebRTC tests in two slightly different vectors: they either focus on testing how their WebRTC service can handle multiple sessions in parallel or they focus on testing how their WebRTC service can increase the number of users in a single session.

Let’s review what’s the meaning of each of these alternatives.

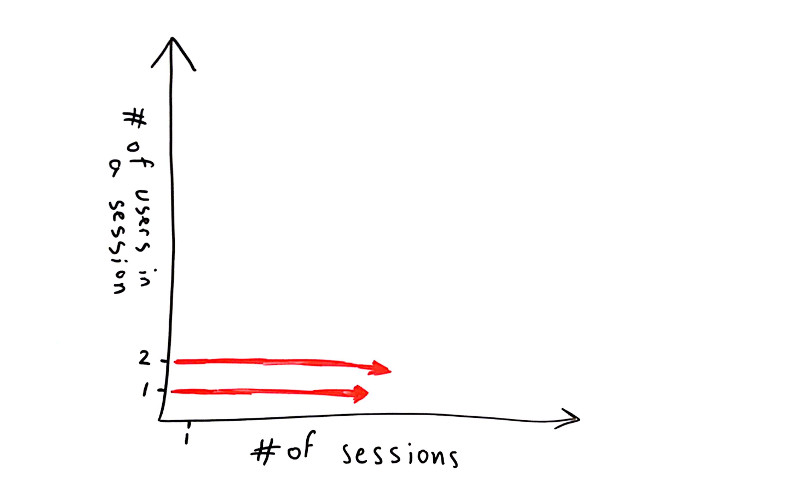
#1 – WebRTC test that scales to a large number of sessions

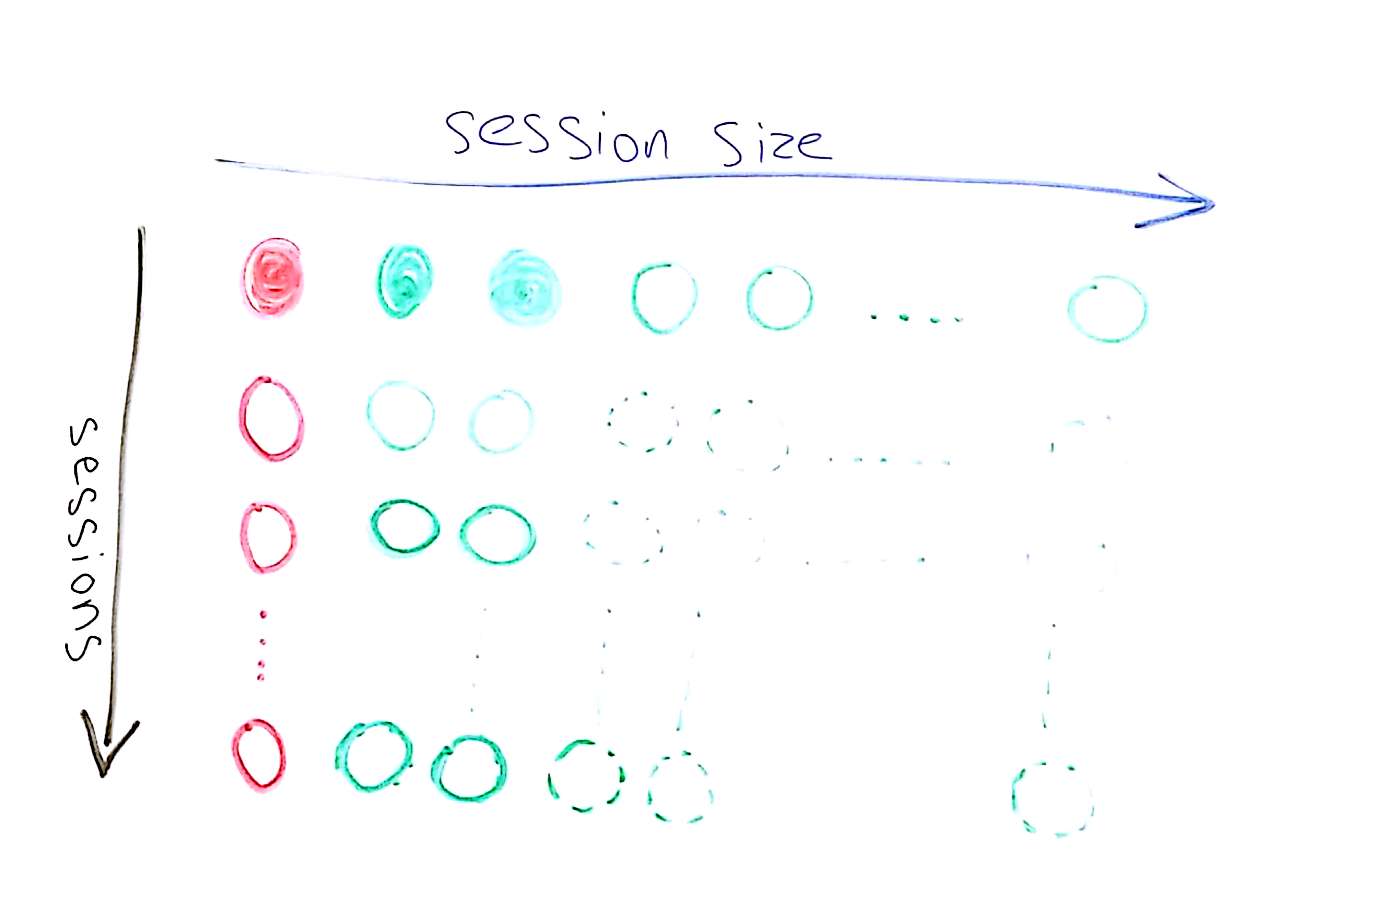
I decided to put things on a simple graph. The X axis denotes the number of sessions we’re going to focus on while the Y axis is all about the number of users in a single session.

In this case, where we want to test WebRTC for a large number of sessions, we will have this focus:

Scale a WebRTC test by the number of sessions

So we have a WebRTC service to test. It has a single user in a session (a contact center agent receiving calls from PSTN for example) or two users in a session (one person talking to another across browsers).

In such a case, vendors are usually concerned about stressing their servers – checking if they can fit their intended capacity.

When this is done, there are three different things that can be tested for scale:

  1. The signaling server
    • How well does it behave while increasing capacity? How is its connection to the databse? Does it slow down as connections accumulate? Does it leak memory?
    • Usually, stress testing a signaling server is better done with other tools. Ones that have a lower cost per connection than testRTC and don’t really require a full browser per connection
    • That said, oftentimes, you may as well want to throw in a few “real” users using testRTC on top of a tool that loads your signaling connections separately – just to make sure there’s nothing that kills your service when media is added into the mix on top of the signaling
    • You also need to think about the third component below – how do you test your TURN server?
  2. The media server
    • These crop into 1:1 tests when there’s a need to record the session or to enforce a given route. I’ve seen many of these recently, mainly in the healthcare and education markets
    • For single users, this usually means the gateway that connects the user to other networks is what we want to test, and there it will usually include a media server of sorts for media transcoding
    • In such a case, there’s no getting away from the fact that scale is in the low 10’s or 100’s of browsers and real ones are needed. It is also where we see a lot of interest in testRTC and its capabilities
  3. The TURN server
    • Anywhere between 5-20% of the calls will end up being relayed via a TURN server – and there’s nothing you can do about it
    • If you put up your own TURN servers – how confident are you in your setup and its ability to scale nicely as your service grows?
    • One way to find out is to place real browsers in front of your service, but doing so in a way that forces the browsers to negotiate via TURN. This can be acheived by changing the configuration of your client, filtering ICE candidates and doing SDP munging. A better way would be to enforce network rules on the machine running the browser and actually test your service in different network conditions
    • And yes. testRTC allows you to do just that

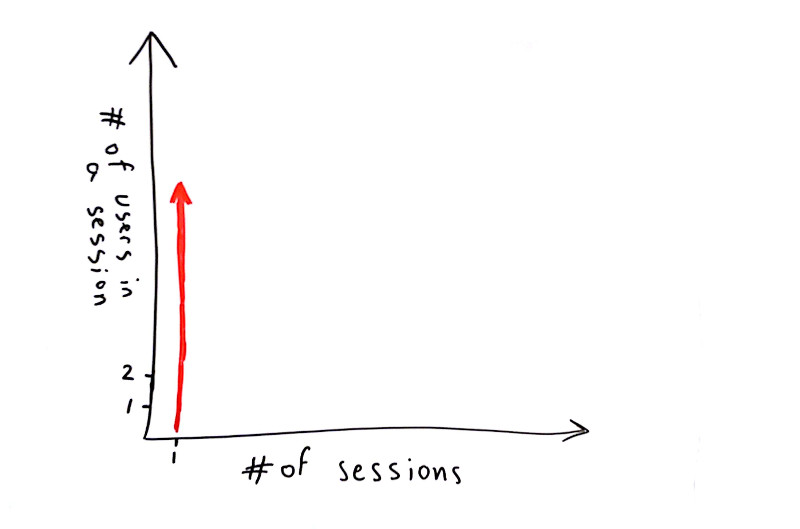
#2 – WebRTC test that accommodates a large group of users in a single session

The other type of focus use cases we see a lot from our customers are those that want to answer the question “how many users can I cram into a single session without considerably degrading the quality?”

Scale a WebRTC test by the number of users per sesson

Many look for doing such tests at around 10-20 concurrent browsers, either in MCU or SFU models (see this post on the differences between the multiparty WebRTC technologies).

What happens next is usually a single session where browsers are added one on top of the other to check for scale. Here, the main purpose of a test is validating the media server and not much else.

The scenario is rather simple:

  • Try 1:1. Record the results
  • Go for 4 users. Record the results
  • Expand to 10 users. Record the results
  • Rinse and repeat

Now go back to the recorded results and see if the media got degraded:

  • Was latency introduced?
  • Do we see more packet losses?
  • Does bitrates go down the more browsers we add?
  • Is the bitrate stable or fluctuating all over the chart?
  • Is the degradation linear or exponential?

These types of questions are indicators to problems in the WebRTC product’s infrastructure (be it network connections, CPU, storage or software).

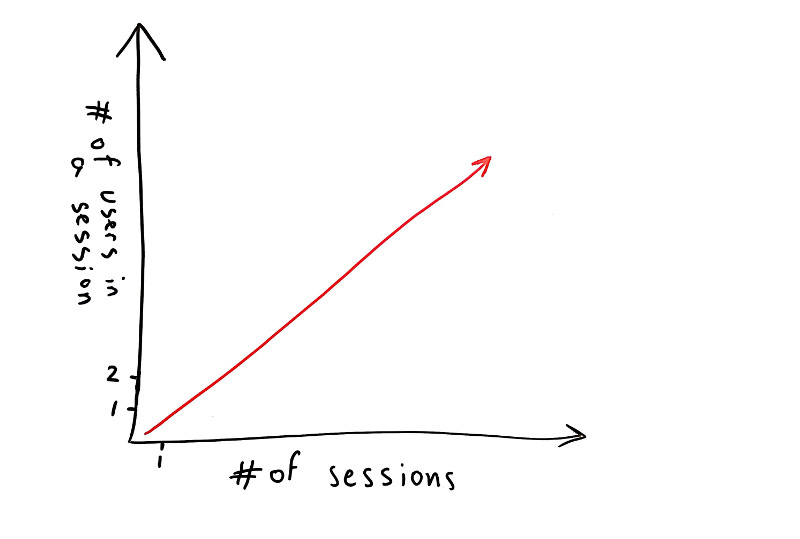
#3 – Test WebRTC at scale

And then you can try to accommodate for both these needs. And you should – scale the size of the sessions at the same time that you scale the number of sessions.

Scale a WebRTC test by the number of sessions and by the number of users in them

Here what we’re trying to do is everything at the same time.

We want to be able to place multiple users in the same session but spread our browsers across sessions.

How about running 100 browsers, split across 10 different sessions, where each session accommodates for 10 browsers? This is where our customers are headed next after they tested their WebRTC multiparty service for a single session capacity.

Why is WebRTC test scaling so hard?

When you scale test WebRTC infrastructure, you end up needing lots of bandwidth and processing power. Remember that each user is a full browser (why that is necessary see here). Running 2 or 4 of these may be simple, but running 20 or more becomes quite a challenge:

  • You can no longer place them all in a single machine, so you need to start distributing them – across machines, across data centers
  • You need to take care of both downlink and uplink network speeds – this isn’t easy to acheive at scale
  • You need to synchronize across your small army of browsers so they hit the server at roughly the right time for it all to work
  • Oh – and you need the WebRTC test environment to be stable, so that when issues occur, it will more often than not be due to an issue in the tested product and not in your test environment itself

testRTC, users and sessions

There are many ways to do multiple users in a single session:

  • All join the same URL or room, given the same level of access
  • A chair hosting a large conference, where control and access is assymetric
  • A broadcaster and a large number of viewers
  • A few people in a discussion with a large number of viewers

Each of these scales differently and requires a slightly different treatment.

What we did at testRTC was introduce the notion of #session into the mix. When you indicate #session, the test will automatically wrap itself around that notion – splitting the number of concurrent users you want into sessions at the size you state by #session.

Want to see it in action? Check our our latest tutorial videos on how to scale WebRTC tests in testRTC, by using the notion of a session:

WebRTC Test Automation and where it fits in your roadmap

I see mixed signals about the popularity and acceptance of test automation. It is doubly so when testing WebRTC.

Time to consider some serious WebRTC test automation.

In favor of automation

A tester automated his job for 6 years – most probably a hoax, but one that rings partially true. The moral of the story is simple – if you invest time in automating rudimentary tasks – you get your ROI back tenfold in the future.

Pin Up Casino Brasil: Onde os Sonhos se Tornam Realidade

Se você é um amante de jogos de cassino e está em busca de uma experiência única e emocionante, então você veio ao lugar certo. Apresentamos a você o Pin Up Casino Brasil, onde os sonhos se tornam realidade. Neste artigo, vamos explorar todas as razões pelas quais o Pin Up Casino é o destino perfeito para jogadores de todos os níveis de experiência.

Prepare-se para imergir em um mundo de entretenimento sem limites, onde a emoção e a diversão estão garantidas. Discutiremos a ampla variedade de jogos disponíveis no Pin Up Casino, desde as clássicas máquinas caça-níqueis até os jogos de mesa mais sofisticados. Além disso, vamos destacar as promoções e bônus exclusivos que tornam o Pin Up Casino ainda mais atrativo. Então, prepare-se para descobrir por que este cassino online está se tornando rapidamente o favorito dos jogadores brasileiros. Você está pronto para embarcar nesta jornada inesquecível? Vamos lá!

A origem e evolução do conceito de Pin Up Casino no Brasil

Pin Up Casino Brasil é o lugar onde os sonhos se tornam realidade para os amantes de jogos de cassino. Com uma ampla seleção de jogos emocionantes, bônus generosos e uma experiência de jogo de alta qualidade, o Pin Up Casino Brasil oferece tudo o que os jogadores precisam para se divertir e ganhar. Desde caça-níqueis clássicos até jogos de mesa populares, como roleta e blackjack, o cassino online tem algo para todos. Além disso, o Pin Up Casino Brasil oferece um processo de registro simples e seguro, permitindo que os jogadores comecem a jogar rapidamente e aproveitem todos os benefícios que o cassino tem a oferecer.

Com sua interface atraente e fácil de usar, o Pin Up Casino Brasil garante uma experiência de jogo suave e agradável para todos os jogadores. Além disso, o cassino online oferece suporte ao cliente 24 horas por dia, 7 dias por semana, para garantir que todas as dúvidas e preocupações sejam prontamente atendidas. Com uma variedade de métodos de pagamento seguros e rápidos, os jogadores podem depositar e sacar seus ganhos com facilidade. Não perca a oportunidade de se juntar à diversão no Pin Up Casino Brasil e começar a desfrutar de jogos emocionantes e recompensas incríveis. Faça seu registro hoje e mergulhe na experiência de cassino online definitiva!

A experiência única de jogar no Pin Up Casino Brasil

Pin Up Casino Brasil é o lugar onde os sonhos se tornam realidade para os amantes de cassino online. Com uma ampla seleção de jogos emocionantes, desde caça-níqueis até jogos de mesa clássicos, este cassino oferece uma experiência de jogo única e envolvente. Com gráficos de alta qualidade e efeitos sonoros imersivos, você será transportado para um mundo de entretenimento de primeira classe.

Além disso, no Pin Up Casino Brasil, você encontrará uma variedade de promoções e bônus generosos para aumentar suas chances de ganhar. Com um suporte ao cliente eficiente e seguro, você pode ter certeza de que sua experiência de jogo será suave e sem problemas. Não importa se você é um jogador iniciante ou experiente, o Pin Up Casino Brasil é o destino perfeito para quem busca diversão, emoção e a chance de realizar seus sonhos de vitória.

Os jogos emocionantes e variados oferecidos pelo Pin Up Casino Brasil

Pin Up Casino Brasil é o lugar onde os sonhos se tornam realidade para os amantes de jogos de cassino online. Com uma ampla seleção de jogos emocionantes, bônus generosos e uma experiência de jogo segura e confiável, o Pin Up Casino Brasil oferece aos jogadores a oportunidade de se divertir e ganhar grandes prêmios. Desde clássicos como roleta e blackjack até máquinas caça-níqueis modernas e emocionantes, há algo para todos os gostos e preferências.

Além disso, o Pin Up Casino Brasil oferece um ambiente de jogo totalmente seguro e justo, garantindo que os jogadores possam desfrutar de sua experiência sem preocupações. Com um atendimento ao cliente de primeira classe e métodos de pagamento convenientes, o Pin Up Casino Brasil torna o processo de jogar e ganhar fácil e sem complicações. Junte-se à comunidade do Pin Up Casino Brasil hoje e descubra por que é o destino preferido dos jogadores brasileiros em busca de diversão, emoção e grandes vitórias.

As vantagens exclusivas para os jogadores no Pin Up Casino Brasil

O Pin Up Casino Brasil é o lugar onde os sonhos se tornam realidade para os amantes de jogos de cassino. Com uma ampla seleção de jogos emocionantes e uma interface amigável, este cassino online oferece uma experiência de jogo excepcional. Os jogadores podem desfrutar de uma variedade de opções, desde caça-níqueis clássicos até jogos de mesa populares, como blackjack e roleta.

Além disso, o Pin Up Casino Brasil oferece promoções e bônus exclusivos, que aumentam as chances de ganhar e tornam a experiência ainda mais emocionante. Com métodos de pagamento seguros e suporte ao cliente 24 horas por dia, 7 dias por semana, os jogadores podem desfrutar de uma experiência de jogo sem preocupações. Não perca mais tempo, junte-se ao Pin Up Casino Brasil hoje mesmo e comece a transformar seus sonhos em realidade!

Em conclusão, o Pin Up Casino Brasil é o lugar onde os sonhos se tornam realidade. Com uma ampla gama de jogos de cassino emocionantes, bônus generosos e um ambiente seguro, os jogadores podem desfrutar de uma experiência de jogo excepcional. Além disso, o site oferece um suporte ao cliente dedicado e métodos de pagamento convenientes. Não perca a chance de se juntar à diversão e começar a ganhar hoje mesmo no Pin Up Casino Brasil!

That’s… about it.

We have customers who use us to automate areas of their testing, but not many. At least not as many as I’d expect there to be – WebRTC being new and all – and us looking at best practices and changing our bad ways and habits of the past when stating with green field projects.

Against automation

Why is Manual QA Still So Prevalent? – it seems like SauceLabs, who delve into general purpose browser automation, is also experiencing the same thing. Having companies focus on manual testing instead of moving to automation.

Best explanation I heard from someone? They can get a cheap tester to do the work for them by outsourcing it to a developing country and then it costs them less to do the same – just with humans.

For me, that’s taking Amazon’s Mechanical Turk a step too much. For a repetitive task that you’re going to do in each and every release (yours and of browser vendors), to have different nameless faces (or even named ones) do the same tasks over and over again?

Dog-fooding at testRTC

We’ve been around for almost 2 years now. So it is high time we start automating our own testing as well.

The first place where we will be automating our own testing is in making sure our test related feature set works:

  • Our special script commands and variables
  • Running common test scenarios that our customers use in WebRTC

Now, we have test scripts that run these tests, so we can automate them individually. Next step would be to run them sequentially with a “click of a button”. Or more accurately, an execution of a shell script. Which is where we’re taking this in our next release.

The rest will stay manual for now. Mostly because in each version we change our UI based on the feedback we receive. One of our top priorities is to make our product stupidly simple – so that our customers can focus on their own product and need to learn as little as possible (or nothing at all) to use testRTC.

Why our customers end up automating?

There are several huge benefits in automating at least parts of your testing. Here are the ones we see every day from the way our customers make use of WebRTC:

  • Doing the most basic sanity tests – answering the question “is it broken?” and getting an answer fast with no human intervention. This is usually coupled with continuous integration, where every night the latest build is tested against it
  • Scale tests – when a service needs to grow, be it to 10 users in the same session, 40 people across 20 1:1 sessions or 100 viewers of a webinar – it becomes hard to manually test. So they end up writing a simple script in our platform and running it on demand when the time comes to stress test their product
  • Network configurations – taking a script and running it in various network conditions – with and without forcing TURN, packet losses, etc. Some also add different data center locations for the browsers and play with the browser versions used. The idea is to get testing to the edge cases where a user’s configuration is what comes back to bite you
  • Debugging performance – similar to scale tests, but slightly different. Some require the ability to check the capacity of a given machine in their product. Usually the media server. There’s much to be said about that, but being able to run a large scale test, analyze the performance report testRTC produces, and then rinse and repeat means it is easier to find the bottlenecks in the system and fix them prior to deployment

Starting out with WebRTC, we’ve seen other things getting higher priority by customers. They all talk about scenarios and coverage of their test plans. Most don’t go there due to that initial high investment.

What we do see, and what effectively improves our customer’s product, is taking one scenario. Usually a simple one. Writing it in a way that allows for scaling it up. Once a customer runs it for a few days, he sees areas he needs to improve in his product, and how that simple script can expand to encompass more of his testing needs.

This is also why we try to be there with our customers every step of the way. From assisting in defining that test, to writing it and following through with analysis if need be.

Are you serious about your WebRTC product? Don’t waste your time and try us out.
1

How Different WebRTC Multiparty Video Conferencing Technologies Look Like on the Wire

MCU, SFU, Mesh – what do they really mean? We decided to take all these techniques to a spin to see what goes on on the network.

To that end, we used some simple test scripts in testRTC and handpicked a service that uses each of these techniques:

We used 4 browsers for each test. All running Chrome 48 (the current stable version). All from the same data center. All using the same 720p video stream as their camera source.

While the test lengths varied across tests, we will be interested to see the average bitrate expenditure of each to understand the differences.

Mesh

appear.in runs a mesh call. It means that each user will need to send its media to all other users in the session – as well as receive all the media streams from them.

This is how it looks like:

mesh video architecture

I’ve opened up an ad-hoc room there and got 4 of our browser agents into it. Waited about a minute and collected the results:

appear.in mesh video

Nothing much to see here. Incoming and outgoing video across the whole test is rather similar, if somewhat high.

Looking at one of the browser’s media channels tells the story:

appear.in mesh video

This agent has 3 outgoing and 3 incoming voice and video channels.

Average bitrate on the video channel is around 1.2 mbps, which means our agent runs about 3.6 megabytes uplink and downlink. Not trivial.

SFU

Talky uses Jitsi for its SFU implementation. It means that it doesn’t process video but rather routes it to everyone who needs it. Each browser sends its media to the SFU, which then forwards that media to all other participants.

This is how it looks like:

sfu video architecture

I took 4 browsers in testRTC and pointed them at a single Talky session. Here’s what the report showed:

Talky SFU video

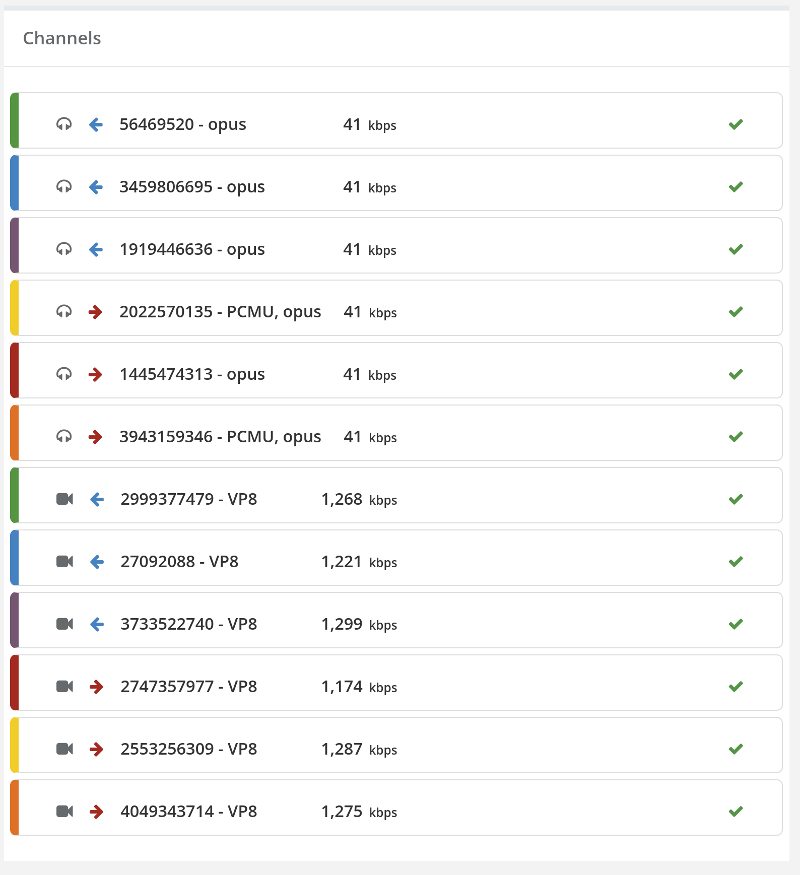
The main thing to not there is that in total, the browsers we used processed a lot more incoming media than outgoing one (at a rate of 3 to 1). This shouldn’t surprise us. Look at how one of these browsers reports its media channels:

Talky SFU video

1 outgoing audio and video channel and then 3 incoming audio and video channels. There’s another empty video channel – Talky is probably using that for incoming screen sharing.

Note how in this case the same machines with the same network performance did a lot better. The outgoing video channel gets to almost 2.5 mbps bitrate. Almost twice as much as the mesh was capable of using. To make it clear – mesh doesn’t scale well.

MCU

For an MCU I picked BlueJeans service. We’ve been playing with it a bit on a demo account so I took the time to take a quick capture of a session. Being architectured around an MCU means that each browser sends a single video stream. The MCU takes all these video streams and composes them into a single video stream that is then sent to each participant separately.

mcu video architecture

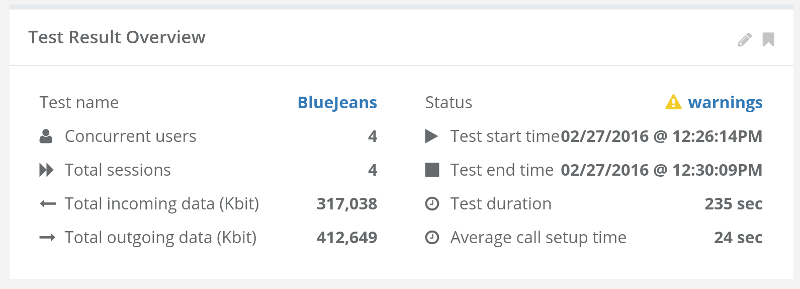
As with the other two experiments, I used 4 browsers with this MCU, receiving this report highlights:

BlueJeans MCU video

Total kilobits here is rather similar. It seems that in total, browsers received less than they sent out.
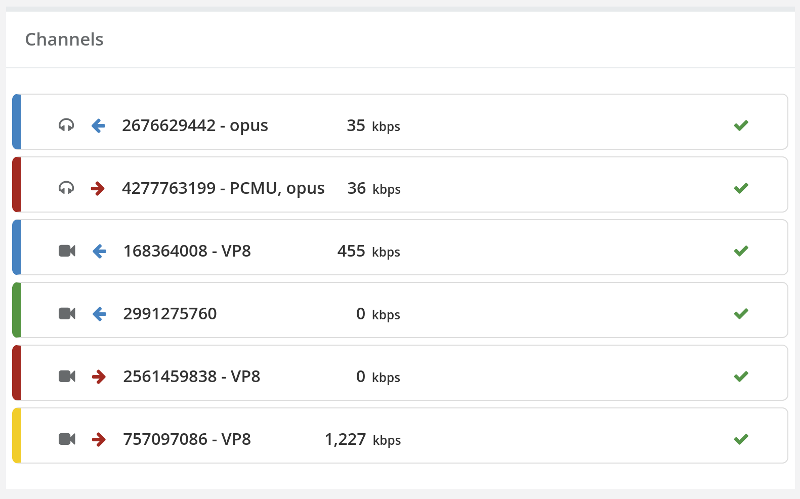
Drilling down into a single browser report, we see the following channels:

BlueJeans MCU video

Single incoming and a single outgoing audio and video channels. We have an additional incoming/outgoing video channel with no data on it – probably saved for screen sharing. While similar to how Talky does it, BlueJeans opens up an extra outgoing channel by default while Talky doesn’t.

Outgoing bitrate averages at 1.2 mbps – a lot lower than the 2.5 mbps in Talky. I assume that’s because BlueJeans limited the bitrate from the browser, which actually makes a lot of sense for 720p video stream. The incoming video is even lower at 455 kbps bitrate on average.

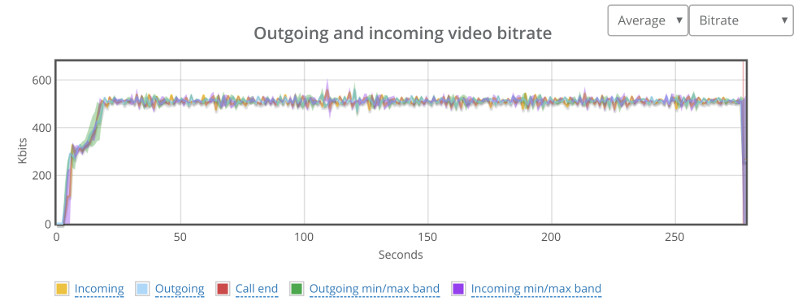
This didn’t make sense to me, so I dug a bit deeper into some of our video charts and found this:

BlueJeans MCU video

So BlueJeans successfully managers to get its outgoing video from the MCU towards the browser up to the same 1.2 mbps bitrate. Thinking about it, I shouldn’t be surprised. Talky and appear.in are ad-hoc services, while BlueJeans is a full service with business logic in it – getting all browsers into the session takes more time with it, especially with how we’ve written the script for it. We have a full minute here from the browser showing its local video until it really “connects” to the conference.

Another interesting tidbit is that Chrome gets its bitrate to 1.2 quite fast – something Google took care of in 2015. BlueJeans takes a slower route towards that 1.2mbps taking about half a minute to get there.

So What?

Video comes in different shapes and sizes.

WebRTC reduces a lot of the decisions we had to make and takes care of most browser related media issues, but it is quite flexible – different services use it differently to get to the same use case – here multiparty video chat.

If you are looking to understand your WebRTC service better and at the same time automate your testing and monitoring – try out testRTC.