Tag Archives for " network testing "

Understanding a call center agent’s network in a WFH world

As we settle into 2022, it seems like call center agents may continue in their WFH (work from home) mode even beyond the pandemic. This will be done either part time or full time, for some agents or for all of them.
The reasons for that are wide and varied, but that’s probably a topic for another time. This time, I’d like to discuss what we are going to do moving forward, to ensure that those reaching out to your call center get the best call quality possible, even when your agents are working from home.

The shift of the call center agent to WFH

Since the pandemic started, those who are able to work remotely have been directed to do so. That includes call center agents – the people who answer the phone when we want to complain, book, order, cancel or do a myriad of other activities in front of businesses.
The whole environment and architecture of the call center has changed due to the new world we live in today.

In the past, this used to be the call center:

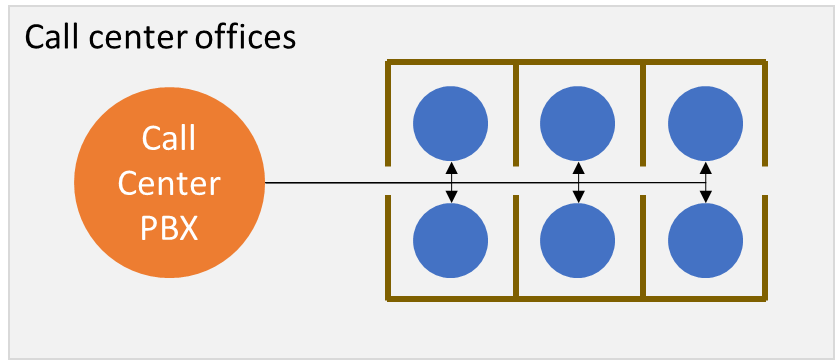
The call center PBX, the network connections to the agents, the agent’s environment (room), computer and phone have all been in our control and in our office facilities.

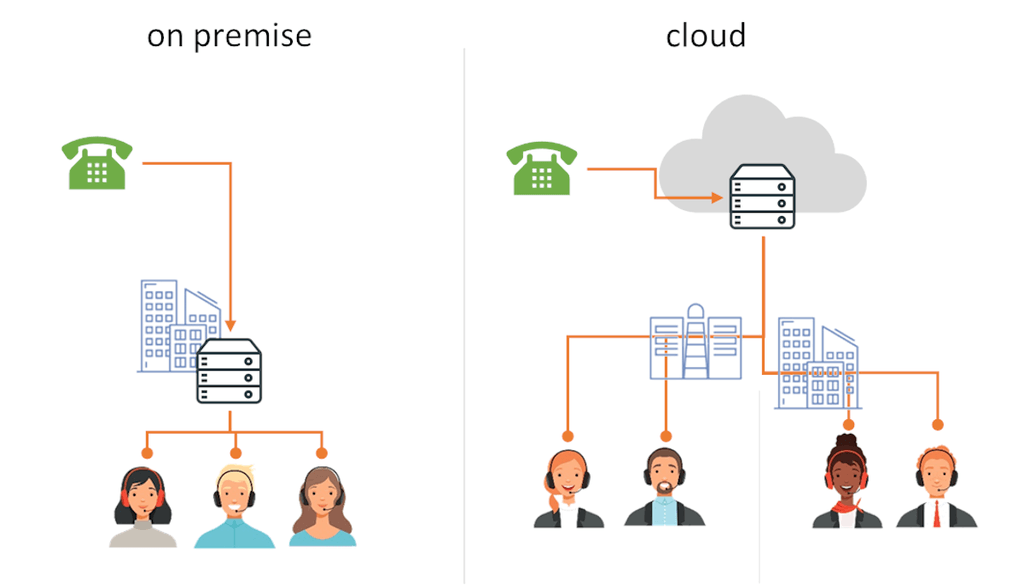
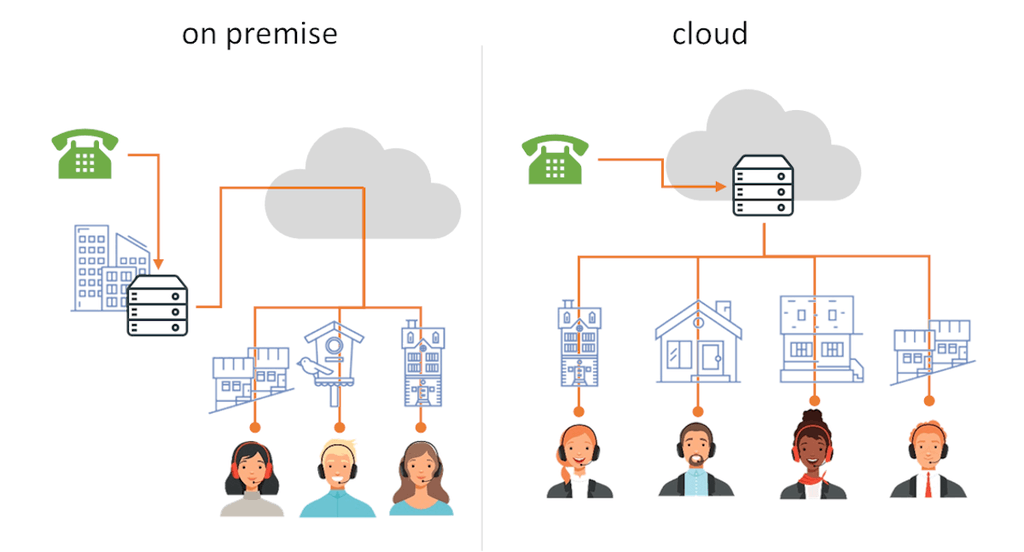
Now? It looks more like this for an on premise call center:

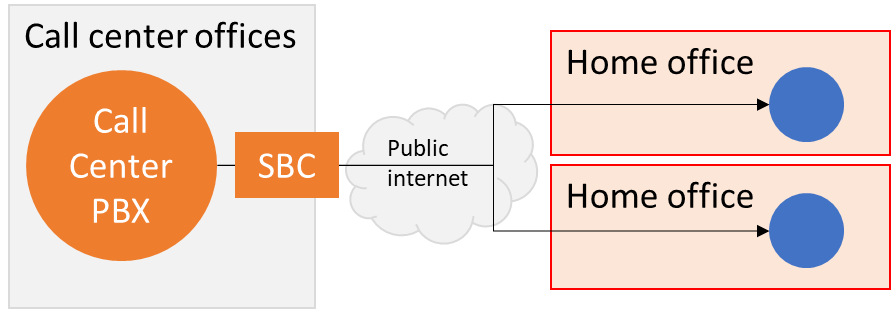
With an on premise call center and work from home agents, we’re likely to deploy an SBC (Session Border Controller) and/or a VPN to connect the agents back to the office. It adds more moving parts, and burdens the internet connection of the office, but it is the fastest patch that can be employed and it might be the only available solution if you can’t or don’t want to run your call center in the cloud.

Or this for a cloud call center:

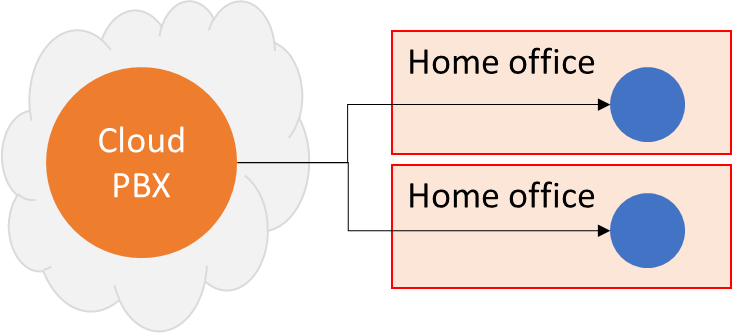
In a cloud call center, the agents connect directly to the cloud from their home office.
Just like the on premise call center, the cloud solution ends up with some new challenges. Mainly – the loss of control:

  • We don’t control the network quality of the agent
  • The environment of the agent is out of our control
  • It is likely that the device and peripherals of the agent are still in our control. But that’s not always the case either

And, even with our best intentions in asking the agents to be on ethernet, on a good network and in a quiet environment, they can struggle with doing it well enough.

Can you hear me now?

With work from home call center agents our main challenge becomes controlling their home environment and network.

At home, agents will have noise around them. Kids playing, family members watching television, the neighbors renovating (I had my share of this one during the pandemic), or traffic noises from the street. By using better headsets and noise suppression these can be improved and even solved.

The network is the bigger headache though. Many of your agents are likely to be non-technical in nature. How do they configure their home network? Which ISP are they using and with which communication bundle? How are they even connected to the network – via wifi or ethernet? How far are they from the wifi access point? Who else is using their home network and how? How is their network configured?
The answers to the questions above are going to affect the network quality and resulting audibility of their calls.
Since we can’t control their network, we at least want to understand it properly to be able to make intelligent decisions, such as routing calls to agents that have better networks and environments or to assist our agents in improving their network and environment.

Assessing a WFH call center agent’s environment

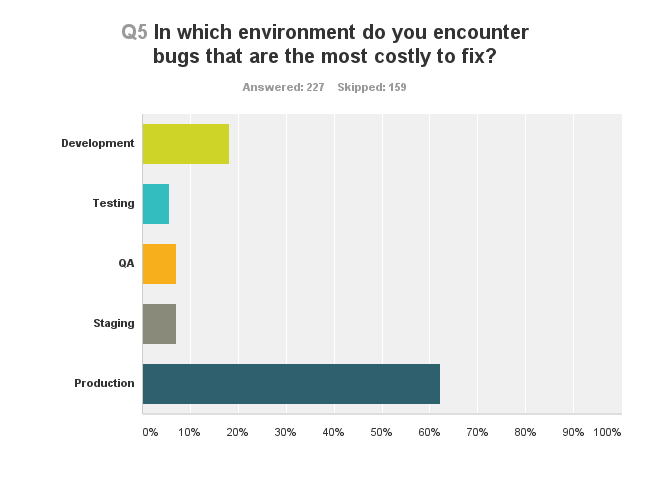
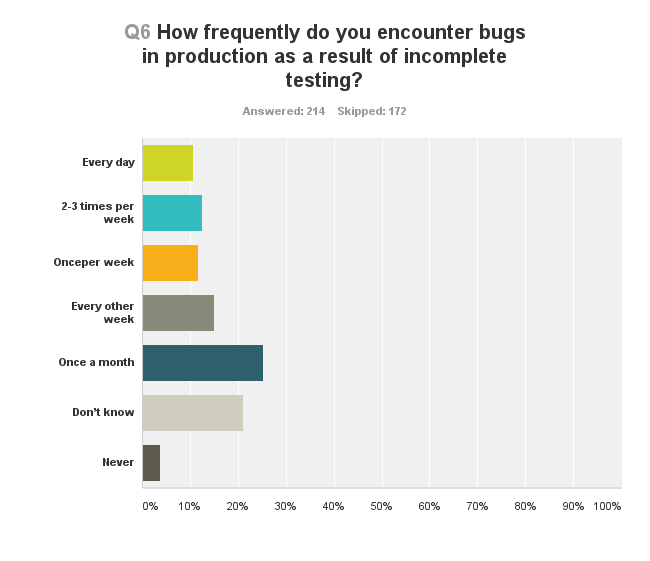
They say that knowing is half the battle. In order to solve a call quality problem you should start from understanding what is causing it, and that comes from understanding the network and environment of your agent.
There’s no specific, single solution or problem here, which is why the process usually takes a lot of back and forth interactions between the agent and the IT/support helping them out remotely.

What are the things that you’d like and need answers to?

  • What machine, operating system and browser is the agent using?
  • Are they using a headset? Is it a bluetooth one? Is it the one provided to them for this purpose?
  • Where is the agent located exactly? What ISP are they connected through?
  • Is the agent using a VPN? Are they behind a firewall? Has someone configured the agent’s DNS servers inappropriately? (you’ll be surprised)
  • Are their calls directed to the correct call center in a region nearby?
  • Can their calls flow over UDP or are they forced over TCP?
  • Are all of your applications needed by the agent available and reachable?
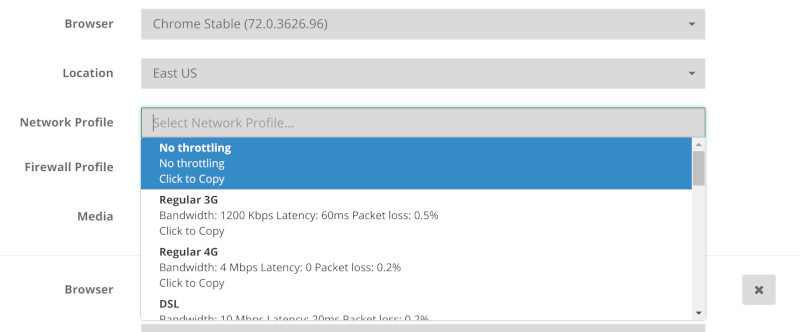
  • What does the agent’s network look like? Is it fiber? ADSL? Something else? Is their uplink accommodating enough for calling services?
  • How much VoIP traffic can their network handle?
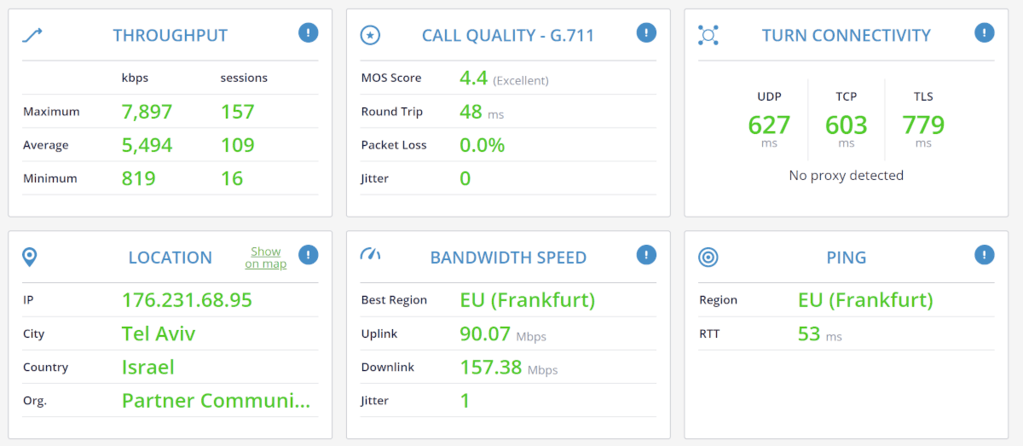
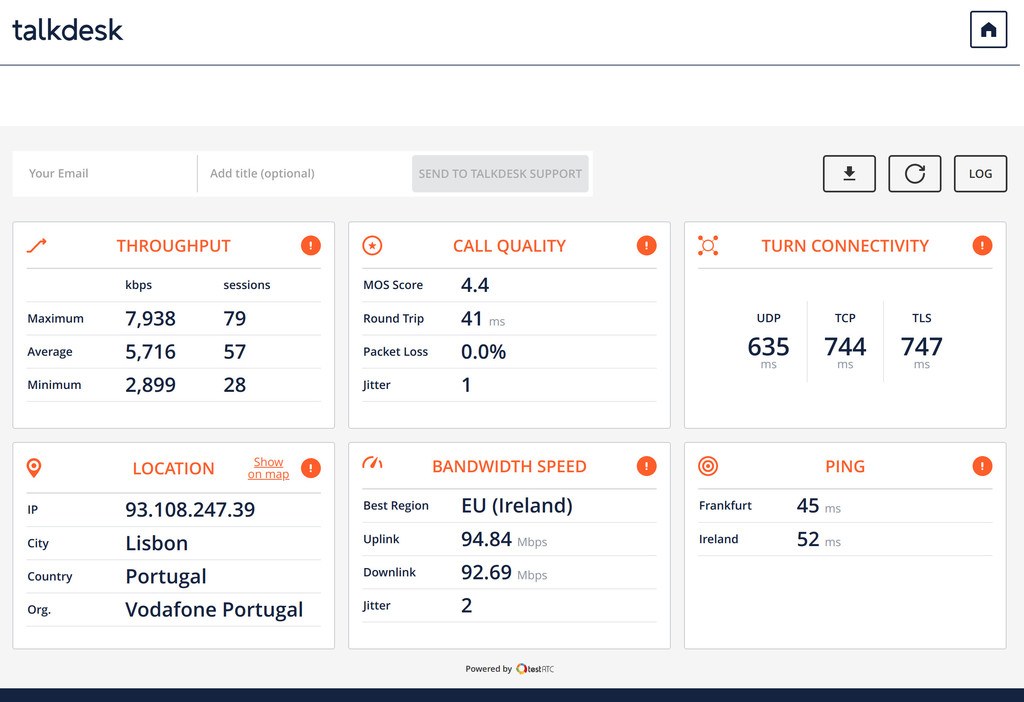
  • When the agent connects to the PBX, what call quality do we measure?
  • Is his network clean or noisy with packet losses and jitter?
  • What’s the latency like?

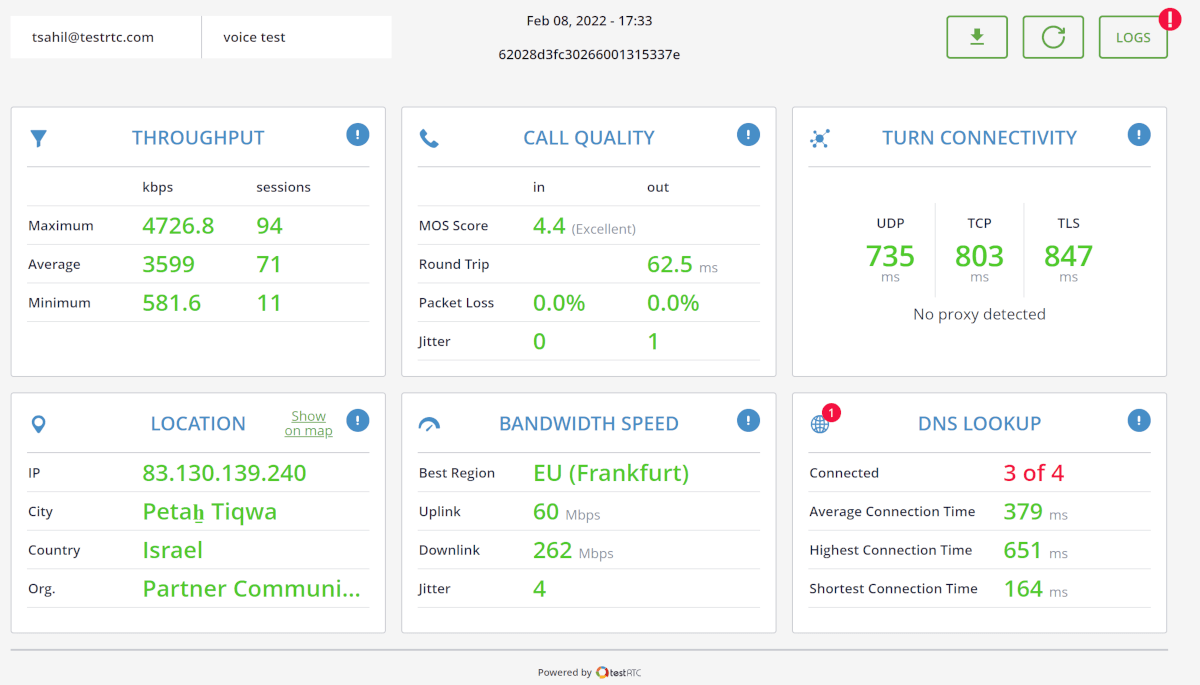
Getting answers to these questions quickly and accurately reduces the handling time of such issues. This is what our clients use our qualityRTC product for – to get the data they need as fast as possible to help them resolve issues sooner.

What’s your workflow?

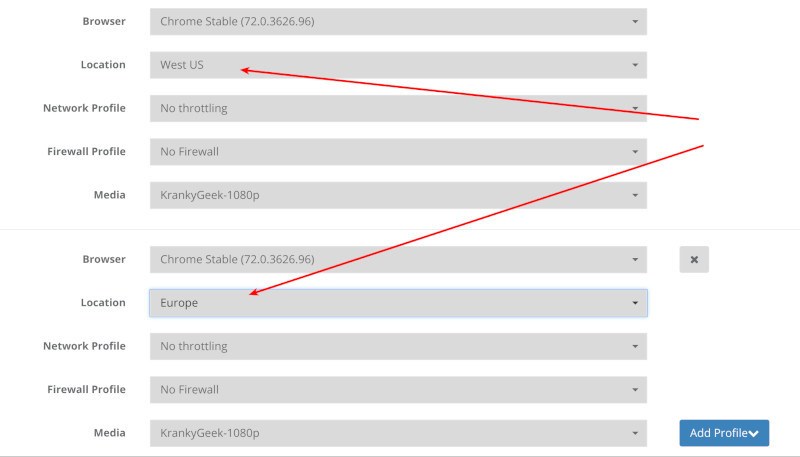
Each call center has its own nuances – different infrastructure to test and different locations.
You have your own workflow and support process to tackle issues. Do you empower agents with self service, or keep close tabs on when and how network tests are conducted?
Some would rather have agents test their network daily at the beginning of the shift, while others want that to take place only when issues arise.
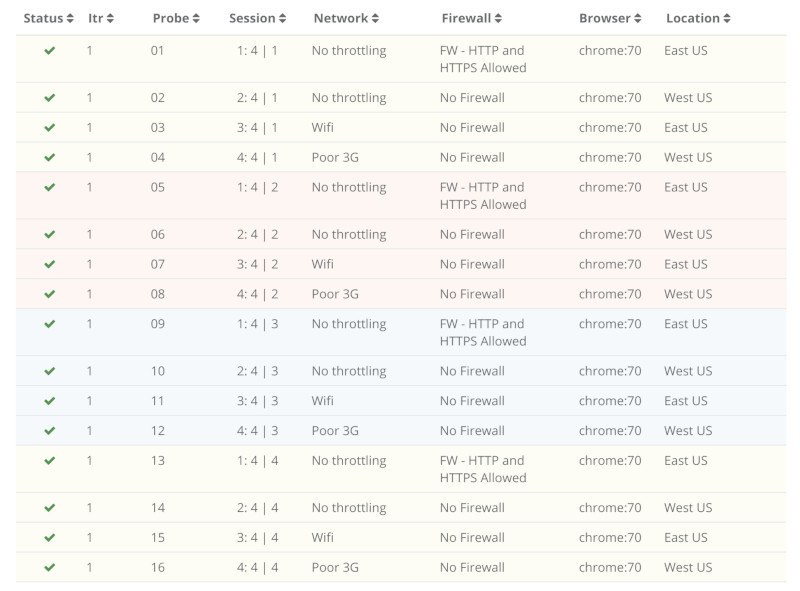
Large call centers usually need access to the data for BI purposes. Others want to map all their call center agents’ status once in a while – just to understand where they stand.

We’ve built qualityRTC with the help of the biggest call center providers out there, so we’ve got you covered no matter your workflow. qualityRTC is flexible to the level you’ll need to help you in reducing your support strains of WFH agents and get you focused on what really matters – your customers.

If you want to really up your game in WebRTC diagnostics – for either voice or video scenarios – with Twilio, some other CPaaS vendor or with your own infrastructure – let us know. We can help using our qualityRTC network testing solution.


1

WebRTC Video Diagnostics for your application (done properly)

WebRTC video diagnostics should be tackled with a holistic approach that offers an end-to-end solution for your users and your support team.

Let’s go through this rabbit hole of network testing – and what testRTC has to offer.

Dev Tools: Build vs Buy

Build vs. Buy

What I find fascinating about developer tools is the discussions you get into. Developers almost always underestimate the effort needed to do things and overestimate their skills. This is why 12 years later, the post by Jeff Atwood about copying Stackoverflow still resonates with me (read it – it is golden).

In our line of business at testRTC we get it a lot. Sentences like “we have something like this, but not as nice” or “we are planning on developing it ourselves”. Sometimes they make sense. Other times… not so much.

Over time though, the gap between an in-house tool to a 3rd party commercial alternative tends to grow. Why? Because in-house tools are bound to be neglected while 3rd party ones get care and attention on a regular basis (otherwise, who would adopt them?)

You see this also with WebRTC video API vendors (CPaaS): Most of them up until recently provided media server infrastructure with client side SDKs to connect to them. Anything else was a bonus. In the last year or two though, many of these API vendors are building more of the application layer and giving it to their customers in various ways: from ready-made iframe widgets, through UI libraries to group calling SDKs and fully built reference applications.

Twilio took it a step further with their RTC Diagnostics SDK last year and then this month the Video Diagnostics App. Both of these packages are actually reference code that Twilio offers for developers so they can write their own network testing / diagnostics / precall / preflight implementation a bit more easily.

This begs the question – what makes diagnostics such an issue that it needs an SDK and an app as references for developers to us?

Our WebRTC diagnostics and troubleshooting interaction pyramid

If we map out our users and their WebRTC configuration/network issues, we can place that in a kind of a pyramid diagram, where the basis of the pyramid are users that have no issues, and the more we go up the pyramid, the more care and attention the users need.

WebRTC diagnostics

Our purpose in life would be to “push” as many users as we can down the pyramid so that they would be able to solve their connectivity issues faster. That would reduce the energy and strain from the support organization and will also result in happier customers.

Pushing users down the pyramid requires better tooling used by both our end users AND our support team.

The components of WebRTC diagnostics

When you are thinking of assisting end users with their connectivity or quality issues over WebRTC, you’re mainly thinking about peripheral devices and networks.

There’s this dance that is going to happen. A back and forth play where you’re going to ask users to do something, they will do it, you’ll look at what they did – rinse and repeat. Until the problem is solved or the user goes away frustrated.

Objective of WebRTC diagnostics

What we want to do is to reduce the amount of back and forth interactions and if possible make it go away entirely.

Here are the things the user will be interested in knowing:

  1. Are my peripherals (microphone and camera) set up correctly?
  2. Can I connect to the service?
  3. Am I getting a good quality connection?

But then there are the things our support would like to understand as well:

  1. Can the microphone or camera the user has cause issues?
  2. What machine is he running on exactly, and with what middleware?
  3. Where is he coming from?
  4. How is the user’s network behaving in general?
  5. Does he have a stable connection with a “clean” network?
  6. Did anyone configure their firewall in any restrictive way?

As you can see, there’s a slight difference in the requirements of the end users while they tries to solve the problem versus what support would need to help them out.

Oh, and then there are the differences between just voice services and video services, where WebRTC video diagnostics are a bit trickier in nature.

Let’s review what components we’re going to need here.

1. A/V Setup/configuration

Setup

You want to let the users understand if their microphone and camera work. And for that, you need to add some settings screen – one that will encompass the use of these devices and enable users to pick and choose out of the selection of devices they have connected. It is not unheard of to have users with multiple microphones and/or cameras (at any given point in time, my machine here shows 3 cameras (don’t ask why) and 4 different microphone alternatives.

This specific configuration is also tricky – you need to be able to handle it in two or three different places within your application: at the very least, on the first time someone uses your service and then again inside a session, if users want to switch between devices mid-session.

For the most part, I’d suggest you take care of this setup on your own – you know best how your UI/UX should be and what experience you’re after for your users.

2. Precall/preflight connectivity check(s)

Connectivity Checks

Some like it, others don’t. The idea here is to have the user go through an actual short session in front of the media server, to see if they can get connected and understand the quality of the connection. This obviously takes time (30+ seconds to get a meaningful reading usually).

It is quite useful in the sense of preparation:

  • When the session is important enough to have people join a wee bit earlier;
  • Or when the user can be forced to go through the hoops of waiting for this

Bear in mind that such a connectivity check should better happen in front of the media server or at the very least the data center that the user will get connected to in his actual session.

Also note that for WebRTC video diagnostics, the tests here are a bit different and more rigorous, especially since we need to test for much higher bitrates (and usually for slightly longer periods of time).

3. Automated data collection

Automated Data collection

We’re getting to the part that is important to the support team more than it is to the end user.

Here what we’re after is to collect anything and everything that might be remotely useful to our needs. Things like:

  • The type of network the user is on
  • How is he connected to the service?
  • What are the names of the devices they have?
  • Where is the user located geographically?
  • Do we know what specific microphone and camera they are using?
  • What operating system and browsers do they use?

Lots and lots of questions that can come in handy to figure out certain types of breakages and behaviors.

We can ask the user, but:

  1. They might not know, or have hard time finding that information (and we don’t want to burden them at this point any further)
  2. They might be lying to us, usually because they aren’t certain (and sometimes because they just lie)

Which means automating that collection of information somehow, which means being able to glean that information with as little work and effort as possible on the user’s side.

4. 360 network testing

Network testing

Let’s assume the user can’t connect to your service or even that they experience poor quality due to some bandwidth limitations or high packet loss. Is that because of your infrastructure or their home/office network?

Hard to say. Especially if all you have to go with is the metrics on your server or the webrtc-internals dump file from the user’s device. Why? Because the story you will find there will be about what happens in front of your service alone.

What you really need is a 360 view of your user’s network. And for that, you need a more rigorous approach. Something that would intentionally test for network connectivity on various protocols, try to understand the bandwidth available, connect elsewhere for “comparison” – the works.

The hard thing here is that to properly conduct such tests and collect the data you will need to install and configure your own specialized servers for some of the tasks. These aren’t going to be the ones your WebRTC application infrastructure uses for the day to day operations – just ones that are used for troubleshooting such user issues.

You can do without this, but then, your results and the information you will have won’t be as complete, which means figuring out the trickiest user issues will be… trickier… and will take more time… and will cause more frustrations for said user.

5. Workflow

Workflow

Then there’s the workflow.

A user comes in. complains.

What now?

Do you wing it each time? Whenever a user complains – do the people in support know what to do? Do they have the process well documented? Do you guide or hint to users how they can solve the issues themselves?

Thinking of that workflow, assuming you have templated emails and responses readily available, how do you deal with the user’s responses? How do you make sense of the data they send back? What if the user goes off your script?

And while we’re at it, are you collecting the complaints and analysis and storing it for later analysis? Something you can use to understand what types of typical issues and complaints exist and how you can improve your infrastructure and your workflow?

This part is often neglected.

Our qualityRTC solution for WebRTC diagnostics

We’ve got a solution for the WebRTC audio or WebRTC video diagnostics challenge. One that takes care of the network testing in ways that build your self service and hands on support for users – in a way that fits virtually any workflow.

If you want to really up your game in WebRTC diagnostics – for either voice or video scenarios – with Twilio, some other CPaaS vendor or with your own infrastructure – let us know. We can help using our qualityRTC network testing solution.

4

Testing call center quality when onboarding WFH remote agents

As call centers are shifting from office work to work from home with the help of cloud and WebRTC, network quality and testing are becoming more important than ever. qualityRTC is here to help.

“testRTC’s Network Testing service reduces the turnaround time for us in understanding and addressing potential network issues with clients”

João Gaspar, Global Director, Customer Service at Talkdesk

How did we get here?

Call centers were in a slow migration, from on-premise deployments transitioning towards the cloud. It was the SMBs, a few larger call centers and that’s about it. We’ve started seeing upmarket movement of cloud call center providers towards larger contact centers, talking about 1,000s of agents and more per call center.

This migration came to be because of several things occurring at once:

  1. A general shift of everything to the cloud
  2. The success of SaaS startups of all kinds and the rise of unicorns (a few of them in the communication and call center space)
  3. WebRTC as a browser technology
  4. The need for more business agility and flexibility, along with the movement of remote work
  5. Cost
  6. Transition time to a new software stack

In March 2020 what we’ve seen is a rapid transition to remote work for all imaginable jobs. All of them. Everywhere. In most countries.

Source: The Economist

The reds and cyans on the map above from The Economist are quarantined countries. And that’s from over two weeks ago. This is worse today.

Here’s the funny thing:

  • We’re not all stuck at home
  • Switched to online deliveries of everything. From computing hardware, to gym gear, to groceries and food deliveries
  • We need call centers more than ever before
  • But call centers are physical locations, where employees can no longer reside. At least not if the service is deemed non-essential

What are we to do?

Rapidly shift call centers to work from home.

Call center deployments today

And there are two main architectures to get that done, and which one a call center will pick depends on where they started – on premise or in the cloud:

Cloud based call centers are more suitable for the WFH era, but they have their challenges as well. And in both cases, there’s work to be done.

Shifting to cloud call center WFH

Here’s how a shift to WFH looks like, and how we get there, depending on where we started (cloud or on premise):

Cloud based call centers would simply switch towards having their calls diverted to the agents’ homes. On premise call centers can go two ways:

  1. Migrate to the cloud, in record time, with half the customizations they have in their on premise deployment. But you can’t get picky these days
  2. Connect the on premise call center via an SBC (Session Border Controller) to the home office

Connecting agents via VPN to WFH:

WFH call center agents biggest challenge

Once you deal with the architectural technical snags, you are left with one big challenge: getting 100s or 1,000s of agents to work from home instead of in the office.

And the challenge is that this is an environment you can’t control.

A month ago? You were in charge of a single network – the office one. You had to make sure it was connected properly to the cloud or the SIP trunk that connected you to the carrier to get your calls going. Maybe you had several offices, each one housing lots of agents.

Today? You need to handle connectivity and media quality issues of more than a single office – more like hundreds or thousands of agents. Each with his own network and his own issues:

  • Bad firewall configurations
  • Misuse of VPN software (trying to watch the latest TV shows abroad)
  • Poor service provider internet access
  • Wrong location in the house, causing poor wifi reception
  • and the list of surprising issues goes on…

Analysing and understanding the network conditions of each home network of each agent becomes a first priority in scaling up your call center back to capacity.

Are you wasting time figuring out the network quality of your remote agents working from home?

If each agent takes 30 minutes to deal with to get to the root cause of the issues blocking him from running properly, then getting a contact center of 100 agents will take 50 work hours for your IT. For 1,000 agents – 500 hours. This is definitely NOT scalable.

qualityRTC for WFH agents network testing

We’ve designed and built qualityRTC to assist cloud call center vendors handle onboarding and troubleshooting issues of the call center clients they have. We have a webinar on how Talkdesk uses our service just for that purpose.

What we found out this past month is that qualityRTC shines in call center WFH initiatives – both for the vendors but also directly for the call centers themselves. We’ve seen an increase of x100 use of our demo, which led us to place it behind a password, in an effort to protect the service capacity for our clients.

Here’s how results look on our service:

The above is a screenshot taken on my home network. You can check it out online here.

qualityRTC offers several huge benefits:

  • It conducts multiple network tests to give you a 360 view of your agent’s home network. This is far superior to the default call test solutions available in some of the call center services
  • qualityRTC is simple to use for the home agent. Collecting the statistics takes only a few minutes and require a single click
  • There is no installation required, and the integration to your backend is simple (it is even simpler if you are a Twilio or TokBox customer already). Oh – and we can customize it for your needs and brand
  • There’s a workflow there, so that your IT/support get the results immediately as they take place. You don’t need to ask the agent to send you anything or to validate he did what you wanted

Here’s a quick walkthrough of our service:

Want to take us for a spin? Contact us for a demo

qualityRTC network testing FAQ

Do I need to install anything?

No. You don’t need to install anything.

Your agents can run the test directly from the browser.

We don’t need you to install anything in your backend for this to work. We will integrate with it from our end.

What network tests does qualityRTC conduct?

We conduct multiple tests. For WFH, the relevant ones are: a call test through your infrastructure, firewall connectivity tests, location test, bandwidth speed test and ping test.

By having all these tests conducted and collected from a single tool, to your infrastructure, and later visualized for both the agent and your IT/support, we make it a lot simpler for you to understand the situation and act based on solid data.

How is qualityRTC different from a call test?

A call test is just that. A call test.

It tells you some things but won’t give you a good view if things go wrong (like not being able to connect a call at all). What qualityRTC does is conduct as many tests as possible to get an understanding of the agent’s home network so that you can get a better understanding of the issues and solve them.

If I use SIP for my WFH agents, can qualityRTC help me?

Yes. A lot of the network problems are going to be similar in nature. Some of the tests we conduct aren’t even done using WebRTC.

Our service is based on WebRTC, but that doesn’t mean you can’t use it to validate a call center that offers its remote agents service via SIP.

How much time does it take to setup qualityRTC?

If you are using Twilio or TokBox we can set you up with an account in a day. A branded site in 2-3 more days.

If you are using something else, we can start off with something that will work well and fine tune to your exact needs within 1-2 weeks.

How much does this network testing tool cost?

Reach us out for pricing. It depends on your size, infrastructure and need.

From a point of view of price structure, there’s an initial setup and customization fee and a monthly subscription fee – you’ll be able to stop at any point in time.

What if my agents are distributed across the globe?

qualityRTC will work for you just as well. The service connects to your infrastructure wherever it is, conducting bandwidth speed tests as close as possible to your data centers. This will give you the most accurate picture, without regards to where on the globe or in what exact location your agents are.

Is qualityRTC limited to voice only calls?

No. We also support video calls and video services.

And once we’re back to normalcy, there is also a specific throughput test that can give some indication as to the capacity of your call center’s network (when NOT working from home).

Does it make sense to use qualityRTC for UCaaS and not only contact centers?

Yes it is.

Our main focus for the product is to check network readiness for communication services. It just so happens that our tool is a life saver today for many call centers that are shifting to work from home mode due to the pandemic and the quarantines around the globe.

Call Center WFH Solutions

If you need help in shifting your call center towards work from home agents, contact us – we can help. Both in stress testing your SBC capacity as well as in analyzing your agent’s home network characteristics.

3 How Talkdesk support solves customer network issues faster with testRTC

“The adoption of testRTC Network Testing at Talkdesk was really high and positive”

Earlier this month, I sat down with João Gaspar, Global Director, Customer Service at Talkdesk to understand more how they are using the new testRTC Network Testing product. This is the first time they’ve introduced a product that is designed for support teams, so this was an interesting conversation for me.

Talkdesk is the fastest growing cloud contact center solution today. They have over 1,800 customers across more than 50 countries. João oversees the global support team at Talkdesk with the responsibility to ensure clients are happy by offering proactive and transparent support.

All of Talkdesk customers make use of WebRTC as part of their call center capabilities. When call center agents open the Talkdesk application, they can receive incoming calls or dial outgoing calls directly from their browser, making use of WebRTC.

WebRTC challenges for cloud contact centers

The main challenge with cloud communication in contact centers is finding the reason for user complaints about call quality. Troubleshooting such scenarios to get to the root cause is very hard, and in almost all cases, Talkdesk has found out that it is not because of its communication infrastructure but rather due to issues between the customer’s agent and his firewall/proxy.

Issues vary from available bandwidth and quality in their internet connection, problems with their headphones, the machine they are using and a slew of other areas.

Talkdesk’s perspective and proactive focus to support means they’re engaging with clients not only when there are issues but through the entire cycle. For larger, enterprise deals,Talkdesk makes network assessments and provides recommendations to the client’s network team during the POC itself, not waiting for quality issues to crop later on in the process.

To that end, Talkdesk used a set of multiple tools, some of them running only on Internet Explorer and others testing network conditions but not necessarily focused on VoIP or Talkdesk’s communication infrastructure. It wasn’t a user friendly approach neither to Talkdesk’s support teams nor to the client’s agents and network team.

Talkdesk wanted a tool that provides quick analysis in a simple and accurate manner.

Adopting testRTC’s Network Testing product

Talkdesk decommissioned its existing analysis tools, preferring to use testRTC’s Network Testing product instead. WFor the client, with a click of a button, the clienthe is now able to  provides detailed analysis results to the Talkdesk support team within a minute. This enables faster response times and less frustration to Talkdesk and Talkdesk’s customer.

Today, all of the Talkdesk teams on the field, including support, networks and sales teams, make use of the testRTC Network Testing service. When a Talkdesk representative at a client location or remotely needs to understand the client’s network behavior, they send a link to a client, asking them to click the start button. testRTC Network Testing then conducts a set of network checks, immediately making the results to Talkdesk’s support.

testRTC’s backend dashboard for Talkdesk

The adoption of this product in Talkdesk was really high and positive. This is due to the simplicity and ease of use of it. For the teams on the field, this enables to easily engage with potential clients who haven’t signed a contract yet while investing very little resources.

The big win: turnaround time

testRTC’s Network Testing service doesn’t solve the client’s problems. There is no silver bullet there. Talkdesk support still needs to analyze the results, figure out the issues and work with the client on them.

testRTC’s Network Testing service enables Talkdesk to quickly understand if there are any blocking issues for clients and start engaging with clients sooner in the process. This dramatically reduces the turnaround time when issues are found, increasing transparency and keeping clients happier throughout the process.

Talkdesk Network Test service in action

On selecting testRTC

When Talkdesk searched for an alternative to their existing solution, they came to testRTC. They knew testRTC’s CEO through webinars and WebRTC related posts he published independently and via testRTC, and wanted to see if they can engage with testRTC on such a solution.

“testRTC’s Network Testing service reduces the turnaround time for us in understanding and addressing potential network issues with clients”

testRTC made a strategic decision to create a new service offering for WebRTC support teams, working closely with Talkdesk on defining the requirements and developing the service.

Throughout the engagement, Talkdesk found testRTC to be very responsive and pragmatic, making the adjustments required by Talkdesk during and after the initial design and development stages.

What brought confidence to Talkdesk is the stance that testRTC took in the engagement, making it clear that for testRTC this is a partnership and not a one-off service. For Talkdesk, this was one of the most important aspects.

How to test network behavior in testRTC?

Earlier this week, we hosted our first webinar in 2019, something we hope to do a lot more (once a month if we can keep it up). This time, we focused on network behavior of SFU media servers.

One of the things we’ve seen with our customers is that different SFUs differ a lot in how they behave. You might not see that much when the network is just fine, but when things get tough, that’s when this will be noticed. This is why we decided to dedicate our first webinar this year to this topic.

There was another reason, and that’s the fact that testRTC is built to cater exactly to these situations, where controlling and configuring network conditions is something you want to do. We’ve built into testRTC 4 main capabilities to give you that:

#1 – Location of the probes

With testRTC, you can decide where you want the probes in your test to launch from.

You can use multiple locations for the same test, and we’re spread wider than what you see in the default UI (we give more locations and better granularity for enterprise customers, based on their needs).

Here’s how it looks like when you test and launch a plan:

In the above scenario, I decided to use probes coming from West US and Europe locations.

Here’s how I’ve spread a 16-browsers test in the webinar yesterday:

This allows you to test your service from different locations and see how well you’ve got your infrastructure laid out across the world to meet the needs of your customers.

It also brings us to the next two capabilities, since I also configured different networks and firewalls there:

#2 – Configuration of the probe’s network

Need to check over Wifi? 3G? 4G? Add some packet loss to the network indicating you want a bad 4G network connection? How about ADSL?

We’ve got that pre-configured and ready in a drop down for you.

I showed how this plays out when using various services online.

#3 – Configuration of the probe’s firewall

You can also force all media to be relayed via TURN servers by blocking UDP traffic or even block everything that isn’t port 443.

This immediately gives you 3 things:

  1. Know if you’ve got TURN configured properly
  2. The ability to stress test your TURN servers
  3. See what happens when media gets routed over TCP (it is ugly)

#4 – Dynamically controlling the probe’s network conditions

Sometimes what you want is to dynamically change network conditions. The team at Jitsi dabbled with that when they looked at Zoom (I’ve written about it on BlogGeek.me).

We do that using a script command in testRTC called .rtcSetNetworkProfile() which I’ve used during the webinar – what I did was this:

  • Have multiple users join the same room
  • They all stay in the room for 120 seconds
  • The first user gets throttled down to 400kbps on his network after 30 seconds
  • That lasts for 20 seconds, and then he goes back to “normal”

It looks something like this when see from one of the other user’s graphs:

The red line represents the outgoing bitrate, which is just fine – it runs in front of the SFU and there’s no disturbance there on the network. The blue line drops down to almost zero. And takes some time to recuperate.

The webinar and demo

Most of the webinar was a long demo session. You can view it all here:

You can open up your own testRTC account and play with our service a bit under evaluation.

Our next webinar – monitoring

Here’s a kicker – I’ve started working on our next webinar about a month ago. It was to do with monitoring and the things we can do there. I even have 3 monitors running for that purpose only for a month now:

That first one with the reds in it? That’s AppRTC… and it failed. At the time that we did our webinar on network testing. And I planned to use it to show some things. So I reverted to showing results of test runs from a day earlier.

Anyways, monitoring is what our next webinar is about.

I am going to show you how to set it up and how to connect it to third party services. In this case, it will be Zapier and Google Sheet where more analysis will take place.

How Houseparty uses testRTC as an integral part of its WebRTC testing

Houseparty selected testRTC for its WebRTC infrastructure regression testing through continuous integration.

Houseparty is a mobile group video chat application, where groups of up to eight friends gather to chat in virtual rooms. With over half a billion video chats conducted using WebRTC, Houseparty is massive in its scale. What makes Houseparty interesting, is that the majority of its users base are 24 old or younger audiences, spending upwards of 50 minutes a day inside the app.

Being a social platform, Houseparty has to innovate on a daily basis. This calls for frequent updates of its mobile applications and infrastructure. An update to the Houseparty backend infrastructure happens on a daily basis and the mobile apps are updated every two weeks on average.

In Search of a Regression Testing Tool

The developers at Houseparty wanted to get a kind of an early warning system in place. One that would tell the team if the changes being made are breaking the service for its users. And breakage here means a reduction in media quality or the inability to work in certain network conditions. What Houseparty’s developers were looking for was higher confidence in their version rollouts.

Houseparty already had stress testing capabilities in place, along with the ability to test their mobile applications. What they were missing was regression testing for the infrastructure. When a decision had to be made, Houseparty preferred to use testRTC’s testing service instead of building their own testing environment, saving months of effort of experienced WebRTC developers with the understanding that the end result would be inferior in terms of its feature set and capabilities.

By selecting testRTC, Houseparty’s developers  were able to improve their confidence level when upgrading the service for their millions of users.

“testRTC offered us the fastest and cheapest way to get the type of regression testing we needed, increasing the confidence we had when rolling out new releases of the Houseparty application”

Simplicity is Key

One of the key reasons for selecting testRTC was the simplicity of the service. From writing tests, through selecting the machines’ configuration and defining test success criteria down to integrating with the API.

The ability to pick different network configurations was really important to Houseparty. Using both the preconfigured settings as well as dynamically modifying network conditions enabled Houseparty to quickly and efficiently understand how the behavior of their application is affected.

Furthermore, by using test expectations in testRTC, a mechanism that lets developers set success and failure criteria for a test, based on metrics collected, Houseparty developers are alerted when results needs to be further analysed. This enables Houseparty’s developers to spend more time on their application and less in drilling down to results, trying to understand their meaning.

When drilling down to results is needed, then the graphs displayed assist the developers in debugging the problems and resolving them faster.

Outgoing and incoming video bitrate for an 8 people room with simulcast enabled

Mobile Only and WebRTC

While running predominantly as a mobile application, Houseparty’s video processing makes use of WebRTC. Houseparty is making a distinction between its application testing and infrastructure testing. It had in its arsenal existing tools that are being used to test its mobile clients. What it was looking for was a way to test their video infrastructure – their media servers and TURN servers – making sure they work as expected.

To that end, Houseparty is using a simple HTML page that can be used to create calls on its staging environment for the application. testRTC is then used to access that page and automate the testing process, simulating different network conditions while testing Houseparty’s video infrastructure.

Continuous Integration as a First Priority

Houseparty made the decision early on to use testRTC as part of their continuous integration environment. Using testRTC’s APIs, the developers at Houseparty were able to quickly integrate the testing scripts they’ve written in testRTC to their Jenkins automation server.

This allows Houseparty to run the testRTC regression tests every night. Integrating testRTC with Jenkins means that when tests complete, their results are reported back to Jenkins and from there they get sent to Slack, where developers get notified on potential failures.

Running testRTC tests nightly from Jenkins with integrated reporting and notifications

Moving Forward with testRTC

For Houseparty, the work is not done yet. testRTC is used on a daily basis, running a battery of tests designed to check their infrastructure. There are additional tests that are planned to be added to this test suite.

Peer-to-peer testing and direct TURN server testing will be added in the near future, increasing the coverage of regression testing done over testRTC.

Automated WebRTC Testing using testRTC

Yesterday, we hosted a webinar on testRTC. This time, we were really focused on showing some live demos of our service.

I wanted this one to be useful, so I sat down earlier this week, working on a general story outline with the idea of showing live how you can write a test script from scratch, building more and more capabilities and functionality into it as I went along.

It was real fun.

If you missed it, I’d like to invite you to watch the replay:

watch @ crowdcast

For the purpose of this webinar, I took Jitsi Meet (https://meet.jit.si/) and created the following scripts for it:

  1. Simple one-on-one test
    • Then I cleaned it up a bit from nagging warnings
    • And added a few basic expectations
  2. 4-way video test
    • For this one I’ve added some synchronization across the probes, and made sure Jitsi is the one generating the random rooms
    • I changed the script to be aware of sessions (parallel meeting rooms in the same test)
    • Then I played with the test reconfiguring it to run 40 probes, 8 in each meeting room
  3. One-on-one test with network limits
    • Switched back to a 1:1 session, this time with the flexibility we achieved in (2)
    • Increased the test length to 3 minutes
    • Injected 5% packet loss to the test in the second minute of the test

I also went over some of the results from the Kurento post we’ve published yesterday and went through the screen sharing script we’ve written recently about that uses appear.in as an example

One of the things I was asked is to share the scripts used throughout the session.

So I cleaned up the scripts a bit and placed them on our Google Drive. I am sharing them here in two forms:

  1. The GDoc file of the script – open it to read, copy+paste it to wherever
  2. The JSON file of the script – you can import this one directly into your testRTC account (you’ll need to reconfigure the probe profiles before you run it):

Here they are:

  1. Simple one-on-one test: GDocJSON
  2. 4-way video test: GDocJSON
  3. One-on-one test with network limits: GDocJSON

We’re here for any questions you may have.

Shocking – most apps are dealing with production bugs

I am not sure about you, but I get bored easily when people tell me a bug costs more in production than it does earlier on in the development lifecycle. It sounds correct, but usually it comes with product managers and sales people throwing out $$$ amounts trying to make a point of it.

Being in a company offering testing and monitoring puts me in an awkward when I am supposed to actually use such tactics with customers. And I hate it. So I try to stick to fact. Real hard facts. This is why I found ClusterHQ’s recent survey about application testing so interesting. I do know this information comes in part from a company selling testing products. I am also aware that this is a survey that is rather small and not coming from the academia (a place where real products don’t get made). But it still resonates with me.

I liked the questions ClusterHQ asked, and wanted to share here two of these:

Cost of bugs in production

I guess there are no surprises here, besides maybe the people who think finding bugs in development is expensive.

There are two issues that make production bugs really expensive:

  1. If customers find them, then it means you have someone complaining already. This can lead to churn – customers leaving your service. If it something critical that affects a large number of your customers, then you’re screwed already
  2. To fix a bug in production takes time. You usually want to recreate it in on of your internal environments, then fix it, then test the whole damn application again to see that nothing else broke and then upgrade production again. This time eats resources – development, testing and management

It always happens. There is no way to really get away from bugs in production – the question though, is the frequency in which they occur. Which brings us to the next question in this survey.

How often are bugs found in production

The frequency in which bugs are found in production. At these high rates, I wonder how things ever get solved.

With agile development, you can argue that these are non-issues. You are going to fix things on a daily or weekly basis, so anything found in production get squashed away rather fast and without too much of a hassle.

I am no expert in agile, but from looking at how WebRTC products are built, I think there are three areas where this approach is going to come back and bite you:

#1 – WebRTC relies on the browser

If your WebRTC product runs in a browser, then you relinquish some of your control to the browser vendors. And they are known to release their versions quite frequently (once every 6-8 weeks in an automated upgrade process). When it comes to WebRTC, they do tend to make changes that affect behavior and these may end up breaking your service.

How do you make sure you are not caught surprised by this? Do you test with the beta browser versions that are available? Do you make it a point to test this continuously or do you limit yourself to testing only when you release a new version?

#2 – More often than not, you rely on 3rd party frameworks (open source or commercial)

You use Kurento? Some other open source framework? Maybe a commercial product that acts as a media server or a gateway? A signaling framework you found on github? Or maybe it is a CPaaS vendors you opted for who is taking care of all communications for you.

Guess what – these things also need testing. Especially since you are using them in your own special way. I’ve been there, so I know it is hard to test every possible use case and every different way an API can be called. So thinks fall between the cracks.

When dealing with such issues and finding them in YOUR production – how long will it take that framework or product to be fixed so you can roll it out to your customers? Will it be at your development speeds or someone else’s?

#3 – Stress and Scale is devilishly hard to get right

Whenever someone starts using our service to test at scale, things break down. It can be minor things, like the fact that most services aren’t designed or built to get 10 people into the same session at the exact same moment (something that is hard to test so we rely on users just refreshing their browser). But it goes to serious issues, like degradation in bit rates and increase in packet losses the more people you throw on the service.

Finding these issues is one thing. Fixing it… that’s another one. Fixing large scale bugs is tough. It is tough because you need a way to reproduce them AND you need to find the culprit causing them.

If you don’t have a good way to reproduce large scale tests, then how are you supposed to be able to fix them?

What’s next?

If you end up using testRTC or not I leave for you to decide. We do have a product that takes care of many of the challenges when you test WebRTC products. So I invite you to try us out.

If you don’t – just do me a favor and take testing your product more seriously. When we work through evaluations, we almost often find bugs in production, and usually more than one. And that’s just from a single basic script we start with. It is time to look at WebRTC as more than a hobby.

Have you found serious bugs in production that you could have found and fixed if you tested WebRTC during development?

Check out the enhancements we’ve made to testRTC

It has been a while since we released a version, so it is with great pleasure that I am writing this announcement.

Yes. Our latest release is now out in the wild. We’ve upgraded our service on Sunday, so it is about time we take you for a quick roundup of the changes we’ve made.

#1 – Support for projects and users

This one is long overdue. Up until today, if you signed up for testRTC, you had to share your credentials with whoever was on your team to work with him on the tests. This was impossible to work with, assuming you wanted QA, R&D and DevOps to share the account and work cooperatively with the tests and monitors that got logged inside testRTC.

So we did what we should have – we now support two modes of operation:

  1. A user can be linked to multiple projects
    • So if your company is running multiple projects, you can now run them separately, having people focused on their own environment and tests
    • This is great for those who run segregated services for their own customers
    • It also means that now, a user can switch between projects with a single set of credentials in the system
  2. A project can belong to multiple users
    • Need someone to work on writing the scripts and executing them? You got it
    • Have a developer working on a bug that got reported with a link to testRTC? Sure thing
    • The IT guy who just received a downtime alarm from the WebRTC monitor we run? That’s another user
    • Each user has his own place in the project, and each is distinguished by his own credentials

testRTC project selection

If you require multiple projects, or want to add more users to your account just contact our support.

#2 – Longer, bigger tests

While theoretically, testRTC can run any test at any length and size, things aren’t always that easy.

There are usually two limitations to these requirements:

  1. The time they take to prepare, execute, run and collect results
  2. The time it takes to analyze the results

We worked hard in this release on both elements and got to a point where we’re quite happy with the results.

If you need long tests, we can handle those. One of the main concerns with long tests is what to do if you made a mistake while configuring them? Now you can cancel such tests in the middle if necessary.

Canceling a test run

If you need to scale tests to a large number of browsers – we can do that too.

We are making sure we bubble up the essentials from the browsers, so you don’t have to work hard and rummage through hundreds of browser logs to find out what went wrong. To that end, the tables that show browser results have been reworked and are now sorted in a way that will show failures first.

#3 – Advanced WebRTC analysis

We’ve noticed in the past few months that some of our customers are rather hard core. They are technology savvy and know their way in WebRTC. For them, the graphs we offer of bitrates, latencies, packet losses, … – are just not enough.

Chrome’s webrtc-internals and getstats() offer a wealth of additional information that we offered up until now only in a JSON file download. Well… now we also visualize it upon request right from the report itself:

Advanced WebRTC graphs

These graphs are reachable by clicking the webrtc_internals_dump.txt link under the Logs tab of a test result. Or by clicking the Advanced WebRTC Analytics button located just below the channels list:

Access advanced WebRTC graphs

I’d like to thank Fippo for the work he did (webrtc-dump-importer) – we adopted it for this feature.

#4 – Simulation of call drops and dynamic network changes

This is something we’ve been asked more than once. We have the capability of modeling the network of our probes, so that the browser runs with a specific configuration of a firewall or via a specific type of simulated network. We’re modifying and tweaking the profiles we have for these from time to time, but now we’ve added a script command so that you can change this configuring in runtime.

What can you do with it? Run two minutes of a test with 2 Mbps, then close virtually everything for 20-30 seconds, then open up  the network again – and see what happens. It is a way to test WebRTC in your application in dynamic network conditions – ones that may require ICE restarts.

Dynamically changing network profile in testRTC

In the test above, we dynamically changed the network profile in mid-call to starve WebRTC and see how it affects the test.

How do you use this new capability? Use our new command rtcSetNetworkProfile(). Read all about it in our knowledge base: rtcSetNetworkProfile()

#5 – Additional test expectations

We had the basics covered when it came to expectations. You could check the number and types of channels, validate that there’s some bits going on in there, validate packet loss. And that’s about it.

To this list of capabilities that existed in rtcSetTestExpectations() we’ve now added the ability to add expectations related to jitter, video resolutions, frame rate, and call setup time. We’ve also taken the time to handle expectations on empty channels a lot better.

There’s really nothing new here, besides an enhancement of what rtcSetTestExpectations() can do.

#6 – Additional information in Webhook responses

testRTC can notify your backend whenever a test or a monitor run ends on the status of that run – success or failure. This is done by configuring a webhook that is called at the end of the test run. We’ve had customers use it to collect the results to their own internal monitoring systems such as Splunk and Elastic Search.

What we had on offer in the actual payload that was passed with the webhook was rather thin, and while we’re still trying to keep it simple, we did add the leading error in that response in cases of failure:

testRTC webhook test failure response

#7 – API enabled to all customers

Yes. We had APIs in the past, but somehow, there was friction involved, with customers needing to ask for their API key in order to use the API for their continuous integration plans. It worked well, but the number of customers asking for API keys – both customers and prospects under evaluation – has risen to a point where it was ridiculous to continue doing this manually. Especially when our intent is for customers to use our APIs.

So we took this one step forward. From now on, every account has an API key by default. That API key is accessible from the account’s dashboard when you login, so there’s no need to ask for it any longer.

testRTC API key

For those of you who have been using it – note that we’ve also reset your key to a new value.

Your turn

This has been quite a big release for us, and I am sure to miss an enhancement or two (or more).

Now back to you. How would you want to test WebRTC in your product?

6

Executing a WebRTC test that scales

There’s a growing trend from the companies that come to testRTC in recent months, and it has to do with the focus of what they are looking for.

Most are less interested in how testRTC can be used for functional testing – things like coverage of scenarios and finding edge cases and automating tests for them. What people are interested now when they want to run a WebRTC test scenario is how to scale it.

Customers typically try to take stress in WebRTC tests in two slightly different vectors: they either focus on testing how their WebRTC service can handle multiple sessions in parallel or they focus on testing how their WebRTC service can increase the number of users in a single session.

Let’s review what’s the meaning of each of these alternatives.

#1 – WebRTC test that scales to a large number of sessions

I decided to put things on a simple graph. The X axis denotes the number of sessions we’re going to focus on while the Y axis is all about the number of users in a single session.

In this case, where we want to test WebRTC for a large number of sessions, we will have this focus:

Scale a WebRTC test by the number of sessions

So we have a WebRTC service to test. It has a single user in a session (a contact center agent receiving calls from PSTN for example) or two users in a session (one person talking to another across browsers).

In such a case, vendors are usually concerned about stressing their servers – checking if they can fit their intended capacity.

When this is done, there are three different things that can be tested for scale:

  1. The signaling server
    • How well does it behave while increasing capacity? How is its connection to the databse? Does it slow down as connections accumulate? Does it leak memory?
    • Usually, stress testing a signaling server is better done with other tools. Ones that have a lower cost per connection than testRTC and don’t really require a full browser per connection
    • That said, oftentimes, you may as well want to throw in a few “real” users using testRTC on top of a tool that loads your signaling connections separately – just to make sure there’s nothing that kills your service when media is added into the mix on top of the signaling
    • You also need to think about the third component below – how do you test your TURN server?
  2. The media server
    • These crop into 1:1 tests when there’s a need to record the session or to enforce a given route. I’ve seen many of these recently, mainly in the healthcare and education markets
    • For single users, this usually means the gateway that connects the user to other networks is what we want to test, and there it will usually include a media server of sorts for media transcoding
    • In such a case, there’s no getting away from the fact that scale is in the low 10’s or 100’s of browsers and real ones are needed. It is also where we see a lot of interest in testRTC and its capabilities
  3. The TURN server
    • Anywhere between 5-20% of the calls will end up being relayed via a TURN server – and there’s nothing you can do about it
    • If you put up your own TURN servers – how confident are you in your setup and its ability to scale nicely as your service grows?
    • One way to find out is to place real browsers in front of your service, but doing so in a way that forces the browsers to negotiate via TURN. This can be acheived by changing the configuration of your client, filtering ICE candidates and doing SDP munging. A better way would be to enforce network rules on the machine running the browser and actually test your service in different network conditions
    • And yes. testRTC allows you to do just that

#2 – WebRTC test that accommodates a large group of users in a single session

The other type of focus use cases we see a lot from our customers are those that want to answer the question “how many users can I cram into a single session without considerably degrading the quality?”

Scale a WebRTC test by the number of users per sesson

Many look for doing such tests at around 10-20 concurrent browsers, either in MCU or SFU models (see this post on the differences between the multiparty WebRTC technologies).

What happens next is usually a single session where browsers are added one on top of the other to check for scale. Here, the main purpose of a test is validating the media server and not much else.

The scenario is rather simple:

  • Try 1:1. Record the results
  • Go for 4 users. Record the results
  • Expand to 10 users. Record the results
  • Rinse and repeat

Now go back to the recorded results and see if the media got degraded:

  • Was latency introduced?
  • Do we see more packet losses?
  • Does bitrates go down the more browsers we add?
  • Is the bitrate stable or fluctuating all over the chart?
  • Is the degradation linear or exponential?

These types of questions are indicators to problems in the WebRTC product’s infrastructure (be it network connections, CPU, storage or software).

#3 – Test WebRTC at scale

And then you can try to accommodate for both these needs. And you should – scale the size of the sessions at the same time that you scale the number of sessions.

Scale a WebRTC test by the number of sessions and by the number of users in them

Here what we’re trying to do is everything at the same time.

We want to be able to place multiple users in the same session but spread our browsers across sessions.

How about running 100 browsers, split across 10 different sessions, where each session accommodates for 10 browsers? This is where our customers are headed next after they tested their WebRTC multiparty service for a single session capacity.

Why is WebRTC test scaling so hard?

When you scale test WebRTC infrastructure, you end up needing lots of bandwidth and processing power. Remember that each user is a full browser (why that is necessary see here). Running 2 or 4 of these may be simple, but running 20 or more becomes quite a challenge:

  • You can no longer place them all in a single machine, so you need to start distributing them – across machines, across data centers
  • You need to take care of both downlink and uplink network speeds – this isn’t easy to acheive at scale
  • You need to synchronize across your small army of browsers so they hit the server at roughly the right time for it all to work
  • Oh – and you need the WebRTC test environment to be stable, so that when issues occur, it will more often than not be due to an issue in the tested product and not in your test environment itself

testRTC, users and sessions

There are many ways to do multiple users in a single session:

  • All join the same URL or room, given the same level of access
  • A chair hosting a large conference, where control and access is assymetric
  • A broadcaster and a large number of viewers
  • A few people in a discussion with a large number of viewers

Each of these scales differently and requires a slightly different treatment.

What we did at testRTC was introduce the notion of #session into the mix. When you indicate #session, the test will automatically wrap itself around that notion – splitting the number of concurrent users you want into sessions at the size you state by #session.

Want to see it in action? Check our our latest tutorial videos on how to scale WebRTC tests in testRTC, by using the notion of a session: