Tag Archives for " signaling "

Monitoring WebRTC apps just got a lot more powerful

As we head into 2019, I noticed that we haven’t published much around here. We doubled down on helping our customers (and doing some case studies with them) and on polishing our service.

In the recent round of updates, we added 3 very powerful capabilities to testRTC that can be used in both monitoring and testing, but make a lot of sense for our monitoring customers. How do I know that? Because the requests for these features came from our customers.

Here’s what got added in this round:

1. HAR files support

HAR stands for HTTP Archive. It is a file format that browsers and certain viewer apps support. When your web application gets loaded by a browser, all network activity gets logged by the browser and can be collected by a HAR file that can later be retrieved and viewed.

Our focus has always been WebRTC, so collecting network traffic information that isn’t directly WebRTC wasn’t on our minds. This changed once customers approached us asking for assistance with sporadic failures that were hard to reproduce and hard to debug.

In one case, a customer knew there’s a 502 failure due to the failure screenshot we generate, but it wasn’t that easy to know which of his servers and services was the one causing it. Since the failure is sporadic and isn’t consistent, he couldn’t get to the bottom of it. By using the HAR files we can collect in his monitor, the moment this happens again, he will have all the network traces for that 502, making it easier to catch.

Here’s how to enable it on your tests/monitors:

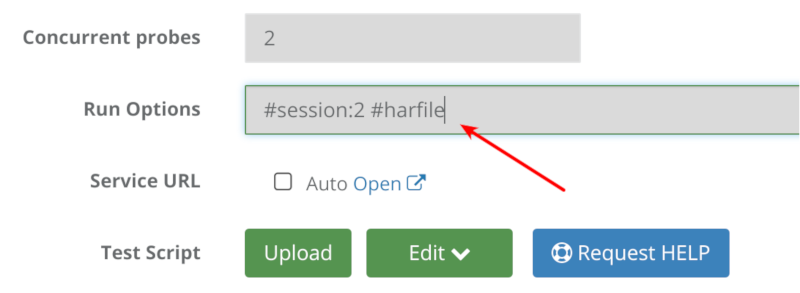
Go to the test editor, and add to the run options the term #har-file


Once there and the test/monitor runs next, it will create a new file that can be found under the Logs tab of the test results for each probe:

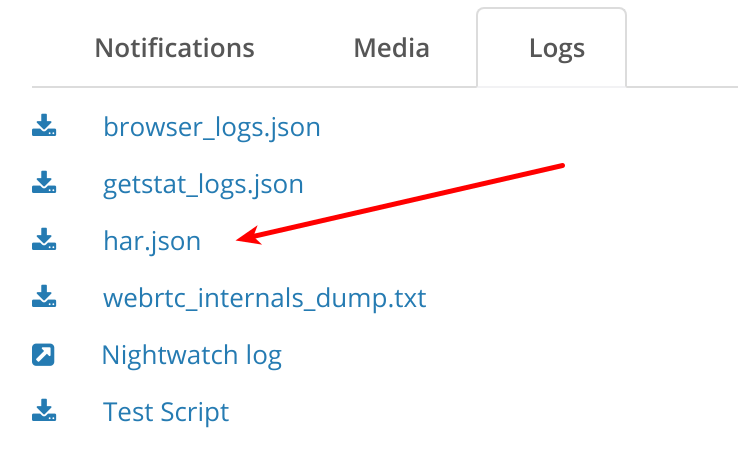
We don’t handle visualization for HAR files for the moment, but you can download the file and place it on a visual tool.

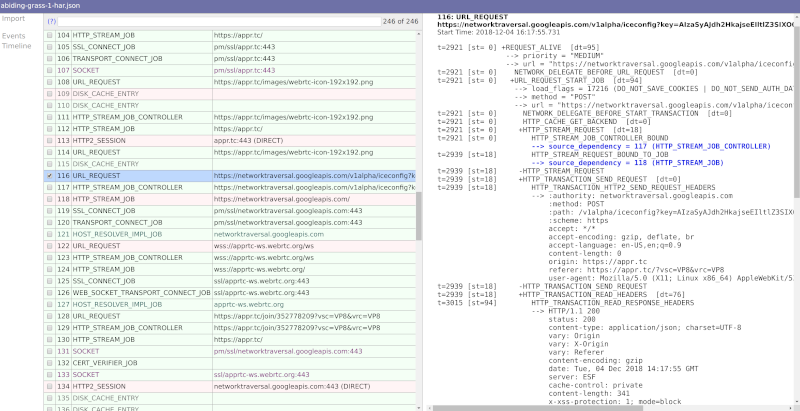
I use netlog-viewer.

Here’s what I got for appr.tc:

2. Retry mechanism

There are times when tests just fail with no good reason. This is doubly true for automating web UI, where minor time differences may cause problems or when user behavior is just different than an automated machine. A good example is a person who couldn’t login – usually, he will simply retry.

When running a monitor, you don’t want these nagging failures to bog you down. What you are most interested in isn’t bug squashing (at least not everyone) it is uptime and quality of service. Towards that goal, we’ve added another run option – #try

If you add this run option to your monitor, with a number next to it, that monitor will retry the test a few more times before reporting a failure. #try:3 for example, will retry twice the same script before reporting a failure.

What you’ll get in your monitor might be something similar to this:

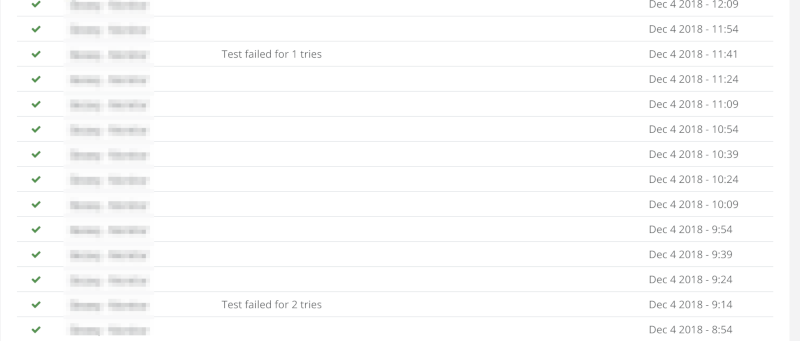
The test reports a success, and the reason indicates a few times where it got retried.

3. Scoring of monitor runs

We’ve started to add a scoring system to our tests. This feature is still open only to select customers (want to join in on the fun? Contact us)

This scoring system places a test based on its media metrics collected on a scale of 0-10. We decided not to go for the traditional MOS scoring of 1-5 because of various reasons:

  1. MOS scoring is usually done for voice, and we want to score video
  2. We score the whole tests and not only a single channel
  3. MOS is rather subjective, and while we are too, we didn’t want to get into the conversation of “is 3.2 a good result or a bad result?”

The idea behind our scores is not to look at the value as good or bad (we can’t tell either) but rather look at the difference between the value across probes or across runs.

Two examples of where it is useful:

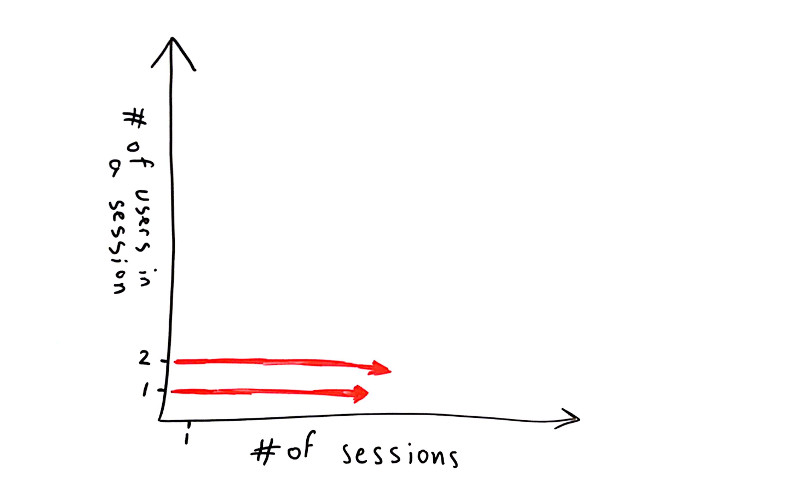
  1. You want to run a large stress test. Baseline it with 1-2 probes. See the score value. Now run with 100 or 1000 probes. Check the score value. Did it drop?
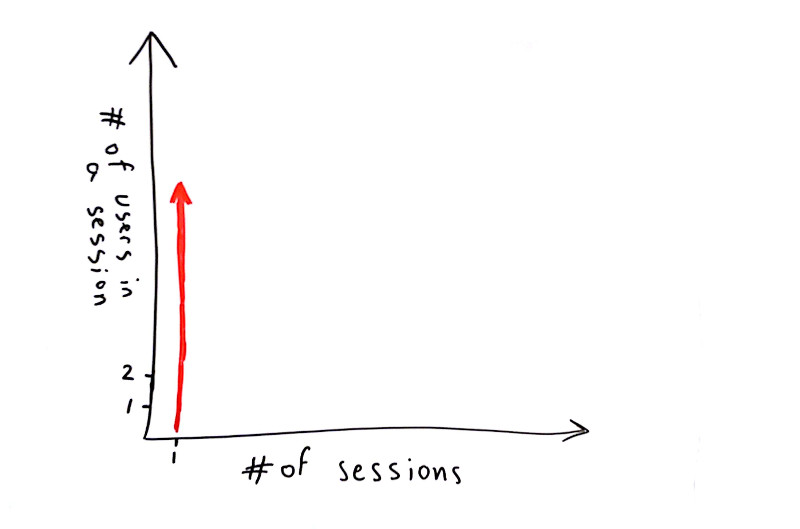
  2. You are running a monitor. Did today’s runs fair better than yesterday’s runs? Worse? The same?

What we did in this release was add the score value to the webhook. This means you can now run your monitors and collect the media quality scores we create and then trendline them in your own monitoring service – splunk, elastic search, datadog, whatever.

Here’s how the webhook looks like now:

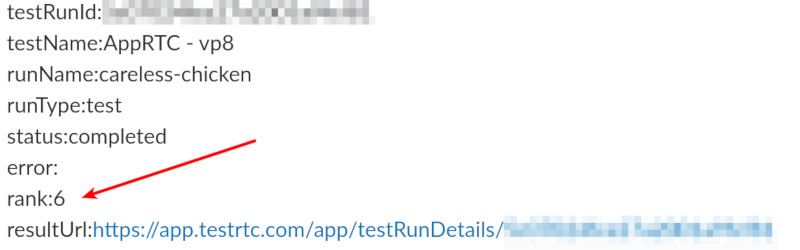
The rank field in the webhook indicates the media score of this session. In this case, it is an AppRTC test that was forced to run on simulated 3G and poor 4G networks for the users.

As with any release, a lot more got squeezed into the release. These are just the ones I wanted to share here this time.

If you are interested in a monitoring service that provides predictable synthetics WebRTC clients to run against your service, checking for uptime and quality – check us out.

6

Executing a WebRTC test that scales

There’s a growing trend from the companies that come to testRTC in recent months, and it has to do with the focus of what they are looking for.

Most are less interested in how testRTC can be used for functional testing – things like coverage of scenarios and finding edge cases and automating tests for them. What people are interested now when they want to run a WebRTC test scenario is how to scale it.

Customers typically try to take stress in WebRTC tests in two slightly different vectors: they either focus on testing how their WebRTC service can handle multiple sessions in parallel or they focus on testing how their WebRTC service can increase the number of users in a single session.

Let’s review what’s the meaning of each of these alternatives.

#1 – WebRTC test that scales to a large number of sessions

I decided to put things on a simple graph. The X axis denotes the number of sessions we’re going to focus on while the Y axis is all about the number of users in a single session.

In this case, where we want to test WebRTC for a large number of sessions, we will have this focus:

Scale a WebRTC test by the number of sessions

So we have a WebRTC service to test. It has a single user in a session (a contact center agent receiving calls from PSTN for example) or two users in a session (one person talking to another across browsers).

In such a case, vendors are usually concerned about stressing their servers – checking if they can fit their intended capacity.

When this is done, there are three different things that can be tested for scale:

  1. The signaling server
    • How well does it behave while increasing capacity? How is its connection to the databse? Does it slow down as connections accumulate? Does it leak memory?
    • Usually, stress testing a signaling server is better done with other tools. Ones that have a lower cost per connection than testRTC and don’t really require a full browser per connection
    • That said, oftentimes, you may as well want to throw in a few “real” users using testRTC on top of a tool that loads your signaling connections separately – just to make sure there’s nothing that kills your service when media is added into the mix on top of the signaling
    • You also need to think about the third component below – how do you test your TURN server?
  2. The media server
    • These crop into 1:1 tests when there’s a need to record the session or to enforce a given route. I’ve seen many of these recently, mainly in the healthcare and education markets
    • For single users, this usually means the gateway that connects the user to other networks is what we want to test, and there it will usually include a media server of sorts for media transcoding
    • In such a case, there’s no getting away from the fact that scale is in the low 10’s or 100’s of browsers and real ones are needed. It is also where we see a lot of interest in testRTC and its capabilities
  3. The TURN server
    • Anywhere between 5-20% of the calls will end up being relayed via a TURN server – and there’s nothing you can do about it
    • If you put up your own TURN servers – how confident are you in your setup and its ability to scale nicely as your service grows?
    • One way to find out is to place real browsers in front of your service, but doing so in a way that forces the browsers to negotiate via TURN. This can be acheived by changing the configuration of your client, filtering ICE candidates and doing SDP munging. A better way would be to enforce network rules on the machine running the browser and actually test your service in different network conditions
    • And yes. testRTC allows you to do just that

#2 – WebRTC test that accommodates a large group of users in a single session

The other type of focus use cases we see a lot from our customers are those that want to answer the question “how many users can I cram into a single session without considerably degrading the quality?”

Scale a WebRTC test by the number of users per sesson

Many look for doing such tests at around 10-20 concurrent browsers, either in MCU or SFU models (see this post on the differences between the multiparty WebRTC technologies).

What happens next is usually a single session where browsers are added one on top of the other to check for scale. Here, the main purpose of a test is validating the media server and not much else.

The scenario is rather simple:

  • Try 1:1. Record the results
  • Go for 4 users. Record the results
  • Expand to 10 users. Record the results
  • Rinse and repeat

Now go back to the recorded results and see if the media got degraded:

  • Was latency introduced?
  • Do we see more packet losses?
  • Does bitrates go down the more browsers we add?
  • Is the bitrate stable or fluctuating all over the chart?
  • Is the degradation linear or exponential?

These types of questions are indicators to problems in the WebRTC product’s infrastructure (be it network connections, CPU, storage or software).

#3 – Test WebRTC at scale

And then you can try to accommodate for both these needs. And you should – scale the size of the sessions at the same time that you scale the number of sessions.

Scale a WebRTC test by the number of sessions and by the number of users in them

Here what we’re trying to do is everything at the same time.

We want to be able to place multiple users in the same session but spread our browsers across sessions.

How about running 100 browsers, split across 10 different sessions, where each session accommodates for 10 browsers? This is where our customers are headed next after they tested their WebRTC multiparty service for a single session capacity.

Why is WebRTC test scaling so hard?

When you scale test WebRTC infrastructure, you end up needing lots of bandwidth and processing power. Remember that each user is a full browser (why that is necessary see here). Running 2 or 4 of these may be simple, but running 20 or more becomes quite a challenge:

  • You can no longer place them all in a single machine, so you need to start distributing them – across machines, across data centers
  • You need to take care of both downlink and uplink network speeds – this isn’t easy to acheive at scale
  • You need to synchronize across your small army of browsers so they hit the server at roughly the right time for it all to work
  • Oh – and you need the WebRTC test environment to be stable, so that when issues occur, it will more often than not be due to an issue in the tested product and not in your test environment itself

testRTC, users and sessions

There are many ways to do multiple users in a single session:

  • All join the same URL or room, given the same level of access
  • A chair hosting a large conference, where control and access is assymetric
  • A broadcaster and a large number of viewers
  • A few people in a discussion with a large number of viewers

Each of these scales differently and requires a slightly different treatment.

What we did at testRTC was introduce the notion of #session into the mix. When you indicate #session, the test will automatically wrap itself around that notion – splitting the number of concurrent users you want into sessions at the size you state by #session.

Want to see it in action? Check our our latest tutorial videos on how to scale WebRTC tests in testRTC, by using the notion of a session:

2

Why we are Using Real Browsers to Test WebRTC Services?

The most important decision we made was one that took place before testRTC became a company. It was the decision to use a web browser as the agent/probe for our service instead of building something on top of WebRTC directly or god forbid GStreamer.

Here are a few things we can do because we use real browsers in WebRTC testing:

#1 – Time to Market

Chrome just released version 49.

How long will it take for you to test its behavior against your WebRTC service if you are simulating traffic instead of using this browser directly?

For us, the moment a browser gets released is almost the moment we can enable it for our customers.

To top it off, we enable access to our customers to the upcoming  browser versions as well – beta and unstable. This helps those who need to test their service check and get some confidence in their service when running them against future versions of browsers.

Even large players in the WebRTC industry can be hit by browser updates – TokBox did some time ago, so being able to test and validate such issues earlier on is imperative.

#2 – Pace of Change

VP9? H.264? ORTC APIs? Deprecation of previous APIs? Replacement of the echo canceler?  Addition of local recording APIs? Media forwarding?

Every day in WebRTC brings with it yet another change.

Browsers get updated in 6-8 weeks cycles, and the browser vendors aren’t shy about removing features or adding new ones.

Maintaining such short release cycles is hellishly tough. For an established vendors (testing or otherwise), it is close to impossible – they are used to 6-12 months release cycles at best. For startups it is just too much of a hassle to run at these speeds – what you are trying to achieve at this point is leverage others and focus on the things you need to do.

So if the browser is there, it gets frequently updated, and it is how the end users end up running the service, why can’t we use it ourselves to leverage both automated and manual testing?

It was stupidly easy for me to test VP9 with testRTC even before it was officially released in the browser. All I had to do was pick the unstable version of the browser testRTC supports and… run the test script we already had.

The same is true for all other changes browsers make in WebRTC or elsewhere – they become available to us ad our customers immediately. And in most cases, with no development at all on our part.

#3 – Closest to Reality

You decided to use someone who simulates traffic and follows the WebRTC spec for your testing.

Great.

But does it act like a browser?

Chrome and Firefox act different through the API calls and look different on the wire. Hell – the same browser in two different versions acts differently.

Then why the hell use a third party who read the WebRTC spec and interpreted it slightly different than the browser used at the end of the day? Count the days. In each passing day, that third party is probably getting farther away from the browsers your customers are using (until someone takes the time and invests in updating it).

#4 – Signaling Protocols

When we started this adventure we are on with testRTC, we needed to decide what signaling to put on top of WebRTC.

Should it be SIP over WebSocket? Covering the traditional VoIP market.

Maybe we should to for XMPP. Over BOSH. Or Comet. Or WebSocket. Or not at all.

Should we add an API on top that the customer integrates with in order to simulate the traffic and connect to his own signaling?

All these alternatives had serious limitations:

  • Picking a specific signaling protocol would have limited our market drastically
  • Introducing an integration API for any signaling meant longer customer acquisition cycles and reducing our target market (yet again)

A browser on the other hand… that meant that whatever the customer decided to do – we immediately support. The browser is going to drive the interaction anyway. Which is why we ended up using browsers as the main focus of our WebRTC testing and monitoring service.

#5- Functional Testing and Business Processes

WebRTC isn’t tested in vacuum. When you used to use VoIP – things were relatively easy. You have the phone system. It is a service. You know what it does and how it works. You can test it and any of its devices and building blocks – it is all standardized anyway.

WebRTC isn’t like that. It made VoIP into a feature. You have a dating site. In that site people interact in multiple ways. They may also be doing voice and video calls. But how they reach out to each other, and what business processes there are along the way – all these aren’t related to VoIP at all.

Having a browser meant we can add these types of tests to our service. And we have customers who check the logic of their site and backend while also checking the media quality and the WebRTC traffic. It means there’s more testing you can do and more functionality of your own service you can cover with a single tool.

Thinking of Testing Your WebRTC Service?

Make sure a considerable part of the testing you do happens with the help of browsers.

Simulators and traffic generators are nice, but they just don’t cut it for this tech.