Tag Archives for " talky "

6

Executing a WebRTC test that scales

There’s a growing trend from the companies that come to testRTC in recent months, and it has to do with the focus of what they are looking for.

Most are less interested in how testRTC can be used for functional testing – things like coverage of scenarios and finding edge cases and automating tests for them. What people are interested now when they want to run a WebRTC test scenario is how to scale it.

Customers typically try to take stress in WebRTC tests in two slightly different vectors: they either focus on testing how their WebRTC service can handle multiple sessions in parallel or they focus on testing how their WebRTC service can increase the number of users in a single session.

Let’s review what’s the meaning of each of these alternatives.

#1 – WebRTC test that scales to a large number of sessions

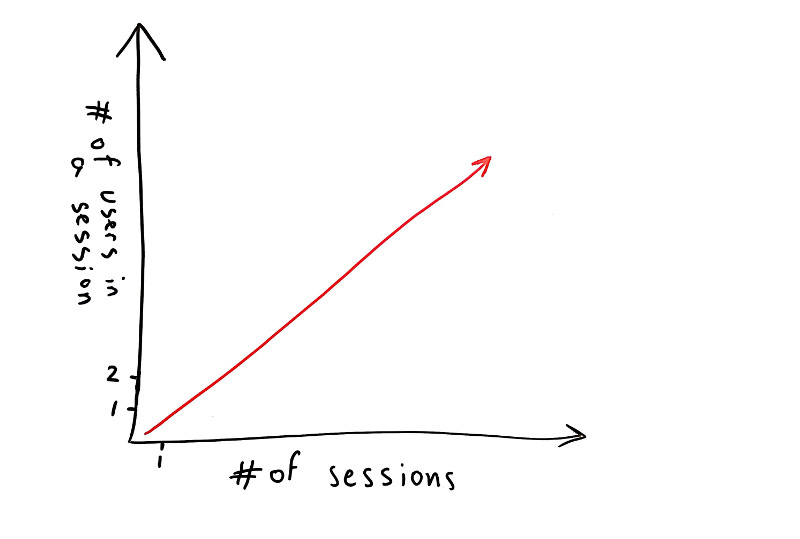
I decided to put things on a simple graph. The X axis denotes the number of sessions we’re going to focus on while the Y axis is all about the number of users in a single session.

In this case, where we want to test WebRTC for a large number of sessions, we will have this focus:

Scale a WebRTC test by the number of sessions

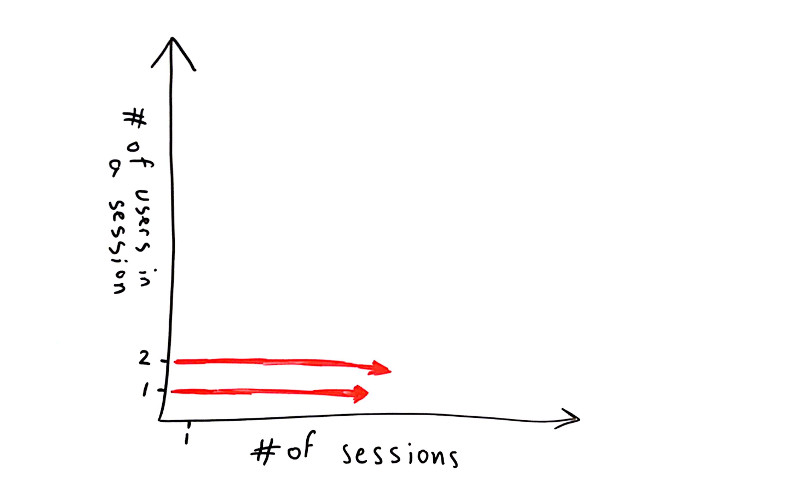
So we have a WebRTC service to test. It has a single user in a session (a contact center agent receiving calls from PSTN for example) or two users in a session (one person talking to another across browsers).

In such a case, vendors are usually concerned about stressing their servers – checking if they can fit their intended capacity.

When this is done, there are three different things that can be tested for scale:

  1. The signaling server
    • How well does it behave while increasing capacity? How is its connection to the databse? Does it slow down as connections accumulate? Does it leak memory?
    • Usually, stress testing a signaling server is better done with other tools. Ones that have a lower cost per connection than testRTC and don’t really require a full browser per connection
    • That said, oftentimes, you may as well want to throw in a few “real” users using testRTC on top of a tool that loads your signaling connections separately – just to make sure there’s nothing that kills your service when media is added into the mix on top of the signaling
    • You also need to think about the third component below – how do you test your TURN server?
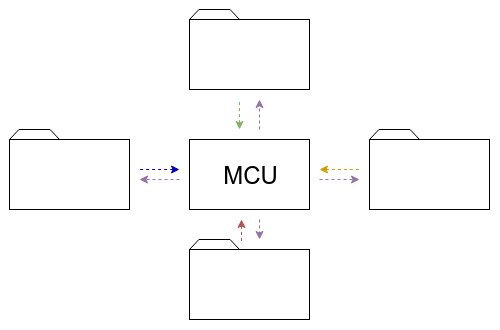
  2. The media server
    • These crop into 1:1 tests when there’s a need to record the session or to enforce a given route. I’ve seen many of these recently, mainly in the healthcare and education markets
    • For single users, this usually means the gateway that connects the user to other networks is what we want to test, and there it will usually include a media server of sorts for media transcoding
    • In such a case, there’s no getting away from the fact that scale is in the low 10’s or 100’s of browsers and real ones are needed. It is also where we see a lot of interest in testRTC and its capabilities
  3. The TURN server
    • Anywhere between 5-20% of the calls will end up being relayed via a TURN server – and there’s nothing you can do about it
    • If you put up your own TURN servers – how confident are you in your setup and its ability to scale nicely as your service grows?
    • One way to find out is to place real browsers in front of your service, but doing so in a way that forces the browsers to negotiate via TURN. This can be acheived by changing the configuration of your client, filtering ICE candidates and doing SDP munging. A better way would be to enforce network rules on the machine running the browser and actually test your service in different network conditions
    • And yes. testRTC allows you to do just that

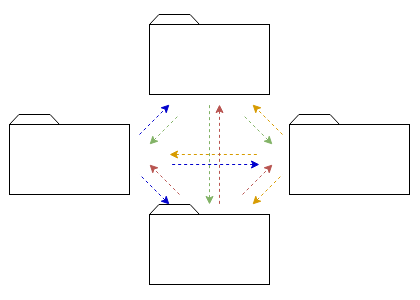
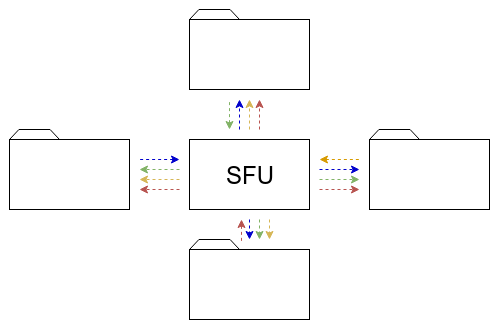
#2 – WebRTC test that accommodates a large group of users in a single session

The other type of focus use cases we see a lot from our customers are those that want to answer the question “how many users can I cram into a single session without considerably degrading the quality?”

Scale a WebRTC test by the number of users per sesson

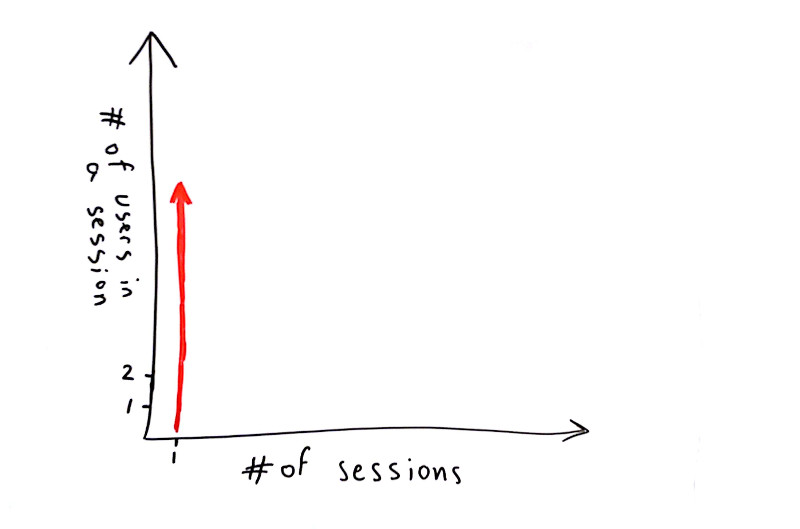
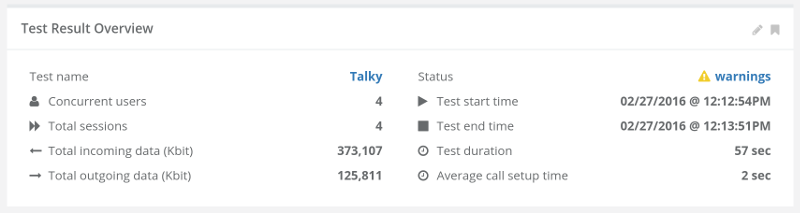
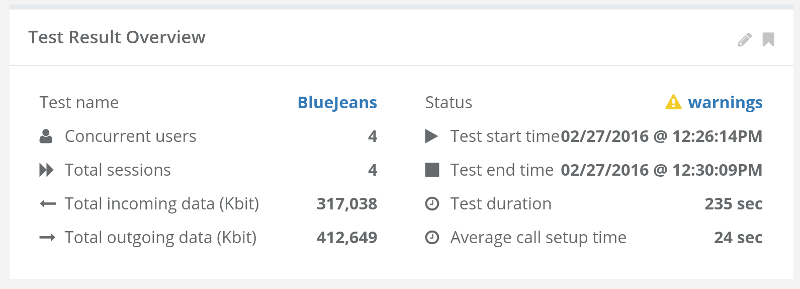
Many look for doing such tests at around 10-20 concurrent browsers, either in MCU or SFU models (see this post on the differences between the multiparty WebRTC technologies).

What happens next is usually a single session where browsers are added one on top of the other to check for scale. Here, the main purpose of a test is validating the media server and not much else.

The scenario is rather simple:

  • Try 1:1. Record the results
  • Go for 4 users. Record the results
  • Expand to 10 users. Record the results
  • Rinse and repeat

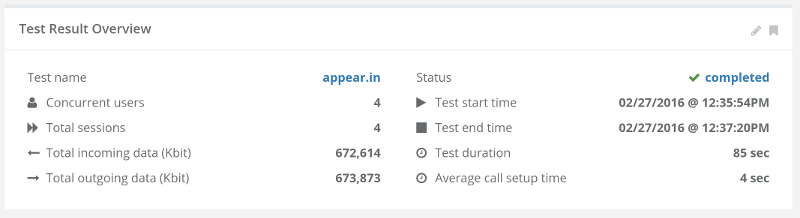
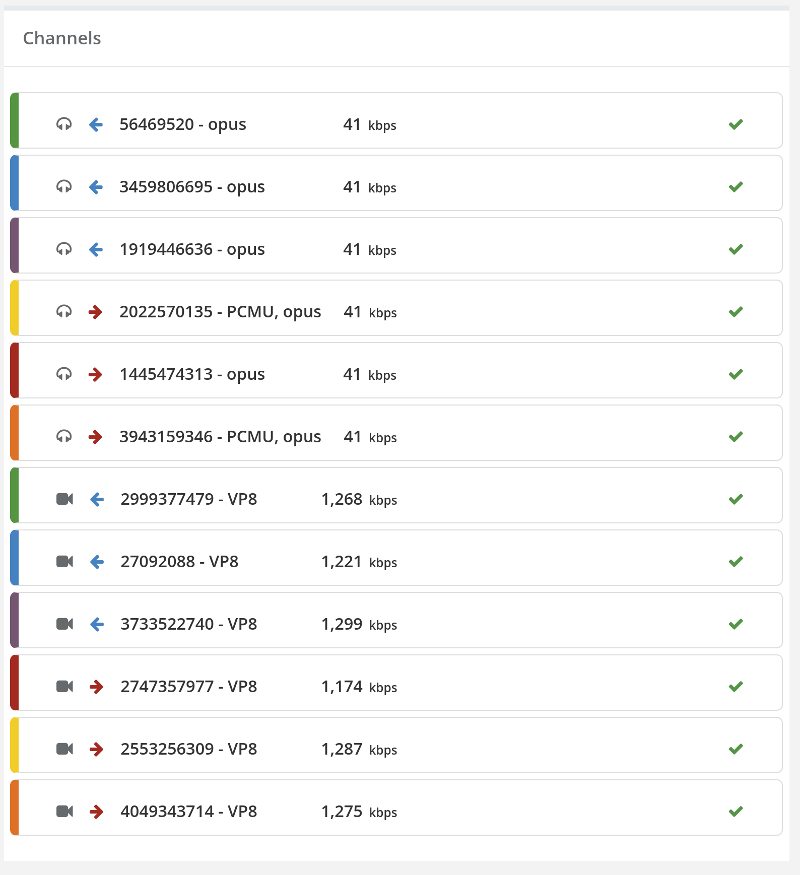
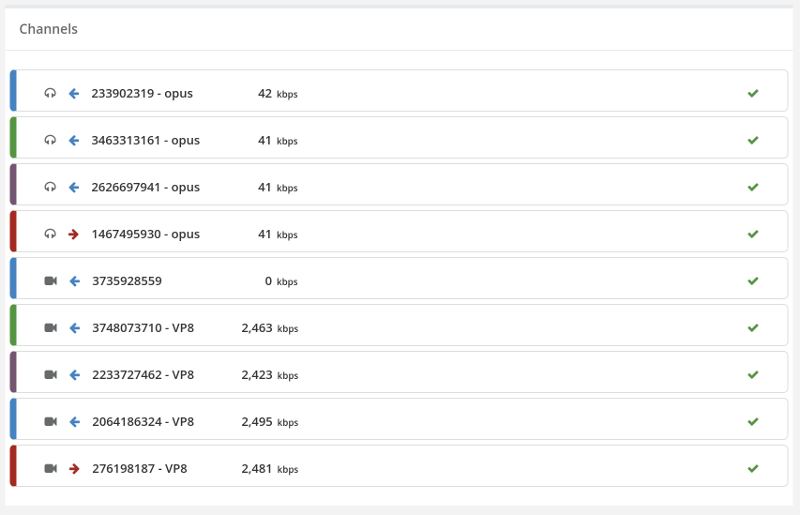
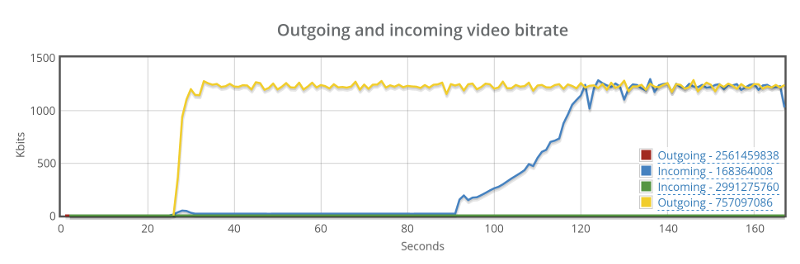
Now go back to the recorded results and see if the media got degraded:

  • Was latency introduced?
  • Do we see more packet losses?
  • Does bitrates go down the more browsers we add?
  • Is the bitrate stable or fluctuating all over the chart?
  • Is the degradation linear or exponential?

These types of questions are indicators to problems in the WebRTC product’s infrastructure (be it network connections, CPU, storage or software).

#3 – Test WebRTC at scale

And then you can try to accommodate for both these needs. And you should – scale the size of the sessions at the same time that you scale the number of sessions.

Scale a WebRTC test by the number of sessions and by the number of users in them

Here what we’re trying to do is everything at the same time.

We want to be able to place multiple users in the same session but spread our browsers across sessions.

How about running 100 browsers, split across 10 different sessions, where each session accommodates for 10 browsers? This is where our customers are headed next after they tested their WebRTC multiparty service for a single session capacity.

Why is WebRTC test scaling so hard?

When you scale test WebRTC infrastructure, you end up needing lots of bandwidth and processing power. Remember that each user is a full browser (why that is necessary see here). Running 2 or 4 of these may be simple, but running 20 or more becomes quite a challenge:

  • You can no longer place them all in a single machine, so you need to start distributing them – across machines, across data centers
  • You need to take care of both downlink and uplink network speeds – this isn’t easy to acheive at scale
  • You need to synchronize across your small army of browsers so they hit the server at roughly the right time for it all to work
  • Oh – and you need the WebRTC test environment to be stable, so that when issues occur, it will more often than not be due to an issue in the tested product and not in your test environment itself

testRTC, users and sessions

There are many ways to do multiple users in a single session:

  • All join the same URL or room, given the same level of access
  • A chair hosting a large conference, where control and access is assymetric
  • A broadcaster and a large number of viewers
  • A few people in a discussion with a large number of viewers

Each of these scales differently and requires a slightly different treatment.

What we did at testRTC was introduce the notion of #session into the mix. When you indicate #session, the test will automatically wrap itself around that notion – splitting the number of concurrent users you want into sessions at the size you state by #session.

Want to see it in action? Check our our latest tutorial videos on how to scale WebRTC tests in testRTC, by using the notion of a session:

1

How Different WebRTC Multiparty Video Conferencing Technologies Look Like on the Wire

MCU, SFU, Mesh – what do they really mean? We decided to take all these techniques to a spin to see what goes on on the network.

To that end, we used some simple test scripts in testRTC and handpicked a service that uses each of these techniques:

We used 4 browsers for each test. All running Chrome 48 (the current stable version). All from the same data center. All using the same 720p video stream as their camera source.

While the test lengths varied across tests, we will be interested to see the average bitrate expenditure of each to understand the differences.

Mesh

appear.in runs a mesh call. It means that each user will need to send its media to all other users in the session – as well as receive all the media streams from them.

This is how it looks like:

mesh video architecture

I’ve opened up an ad-hoc room there and got 4 of our browser agents into it. Waited about a minute and collected the results:

appear.in mesh video

Nothing much to see here. Incoming and outgoing video across the whole test is rather similar, if somewhat high.

Looking at one of the browser’s media channels tells the story:

appear.in mesh video

This agent has 3 outgoing and 3 incoming voice and video channels.

Average bitrate on the video channel is around 1.2 mbps, which means our agent runs about 3.6 megabytes uplink and downlink. Not trivial.

SFU

Talky uses Jitsi for its SFU implementation. It means that it doesn’t process video but rather routes it to everyone who needs it. Each browser sends its media to the SFU, which then forwards that media to all other participants.

This is how it looks like:

sfu video architecture

I took 4 browsers in testRTC and pointed them at a single Talky session. Here’s what the report showed:

Talky SFU video

The main thing to not there is that in total, the browsers we used processed a lot more incoming media than outgoing one (at a rate of 3 to 1). This shouldn’t surprise us. Look at how one of these browsers reports its media channels:

Talky SFU video

1 outgoing audio and video channel and then 3 incoming audio and video channels. There’s another empty video channel – Talky is probably using that for incoming screen sharing.

Note how in this case the same machines with the same network performance did a lot better. The outgoing video channel gets to almost 2.5 mbps bitrate. Almost twice as much as the mesh was capable of using. To make it clear – mesh doesn’t scale well.

MCU

For an MCU I picked BlueJeans service. We’ve been playing with it a bit on a demo account so I took the time to take a quick capture of a session. Being architectured around an MCU means that each browser sends a single video stream. The MCU takes all these video streams and composes them into a single video stream that is then sent to each participant separately.

mcu video architecture

As with the other two experiments, I used 4 browsers with this MCU, receiving this report highlights:

BlueJeans MCU video

Total kilobits here is rather similar. It seems that in total, browsers received less than they sent out.

Drilling down into a single browser report, we see the following channels:

BlueJeans MCU video

Single incoming and a single outgoing audio and video channels. We have an additional incoming/outgoing video channel with no data on it – probably saved for screen sharing. While similar to how Talky does it, BlueJeans opens up an extra outgoing channel by default while Talky doesn’t.

Outgoing bitrate averages at 1.2 mbps – a lot lower than the 2.5 mbps in Talky. I assume that’s because BlueJeans limited the bitrate from the browser, which actually makes a lot of sense for 720p video stream. The incoming video is even lower at 455 kbps bitrate on average.

This didn’t make sense to me, so I dug a bit deeper into some of our video charts and found this:

BlueJeans MCU video

So BlueJeans successfully managers to get its outgoing video from the MCU towards the browser up to the same 1.2 mbps bitrate. Thinking about it, I shouldn’t be surprised. Talky and appear.in are ad-hoc services, while BlueJeans is a full service with business logic in it – getting all browsers into the session takes more time with it, especially with how we’ve written the script for it. We have a full minute here from the browser showing its local video until it really “connects” to the conference.

Another interesting tidbit is that Chrome gets its bitrate to 1.2 quite fast – something Google took care of in 2015. BlueJeans takes a slower route towards that 1.2mbps taking about half a minute to get there.

So What?

Video comes in different shapes and sizes.

WebRTC reduces a lot of the decisions we had to make and takes care of most browser related media issues, but it is quite flexible – different services use it differently to get to the same use case – here multiparty video chat.

If you are looking to understand your WebRTC service better and at the same time automate your testing and monitoring – try out testRTC.

2

The day Talky and Jitsi failed – and why end-to-end monitoring is critical

It was a bad day for me. 14 January 2016.

I had a demo to show to a customer of testRTC. Up until that point, the demos we’ve shown potential customers were focused on Jitsi or Talky (depending on who did the demo).

There were a couple of reasons for picking these services for our demos:

  1. They are freely available, so using them required no approval from anyone
  2. They require no login to use, so the script on top of them was a simple one to explain and showcase
  3. They support video, making them visual – a good thing in a demo
  4. They support more than two participants, which shows how we can scale nicely
  5. In the case of Jitsi, you can visually see if the session is relayed or not – making it easy to show how our network configuration affects WebRTC media routing

We used to use them a lot. For me, they were always stable.

Until 14th of January last month, when both mysteriously failed on me. The failure was a subtle one. The site works. You can join sessions. You can see your camera capture. It tells you it is waiting for other participants to join. But it does that also when someone joins – that other participant? He sees the same message exactly.

You have two or more people in the same session, all waiting for each other, when they are already all effectively “in the meeting”.

Our scheduled demos for the day failed. We couldn’t show a decent thing to customers – relying on a third party was a small mistake – we switch to show demo on other services – but it cost us time in these meetings. Since then, we’ve gone AppRTC for our baseline.

I don’t know why Jitsi and Talky failed on the same day. They both make use of the Jitsi Videobridge, but I don’t believe it was related to the videobridge or even to the same issue – just a matter of coincidence.

While these things happen to all of us, we need to strive for continuous improvement – both in the time it takes us to find an issue as well as fixing it.