Tag Archives for " testing "

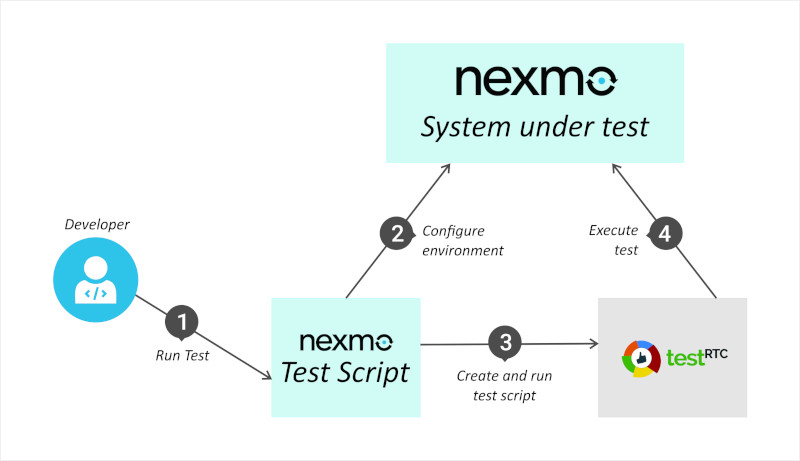
How to test network behavior in testRTC?

Earlier this week, we hosted our first webinar in 2019, something we hope to do a lot more (once a month if we can keep it up). This time, we focused on network behavior of SFU media servers.

One of the things we’ve seen with our customers is that different SFUs differ a lot in how they behave. You might not see that much when the network is just fine, but when things get tough, that’s when this will be noticed. This is why we decided to dedicate our first webinar this year to this topic.

There was another reason, and that’s the fact that testRTC is built to cater exactly to these situations, where controlling and configuring network conditions is something you want to do. We’ve built into testRTC 4 main capabilities to give you that:

#1 – Location of the probes

With testRTC, you can decide where you want the probes in your test to launch from.

You can use multiple locations for the same test, and we’re spread wider than what you see in the default UI (we give more locations and better granularity for enterprise customers, based on their needs).

Here’s how it looks like when you test and launch a plan:

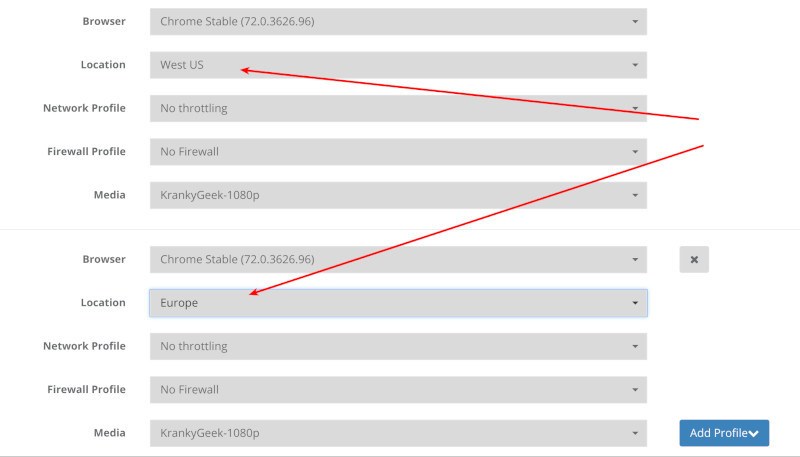
In the above scenario, I decided to use probes coming from West US and Europe locations.

Here’s how I’ve spread a 16-browsers test in the webinar yesterday:

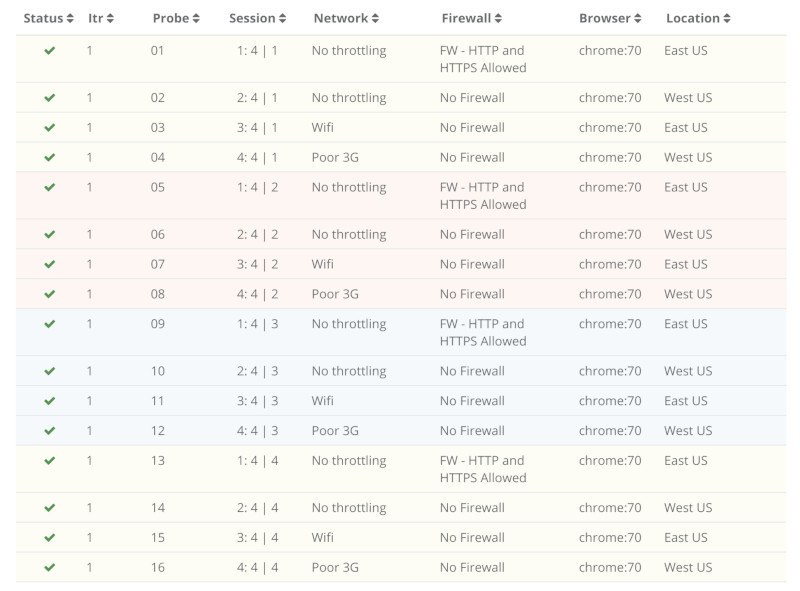
This allows you to test your service from different locations and see how well you’ve got your infrastructure laid out across the world to meet the needs of your customers.

It also brings us to the next two capabilities, since I also configured different networks and firewalls there:

#2 – Configuration of the probe’s network

Need to check over Wifi? 3G? 4G? Add some packet loss to the network indicating you want a bad 4G network connection? How about ADSL?

We’ve got that pre-configured and ready in a drop down for you.

I showed how this plays out when using various services online.

#3 – Configuration of the probe’s firewall

You can also force all media to be relayed via TURN servers by blocking UDP traffic or even block everything that isn’t port 443.

This immediately gives you 3 things:

  1. Know if you’ve got TURN configured properly
  2. The ability to stress test your TURN servers
  3. See what happens when media gets routed over TCP (it is ugly)

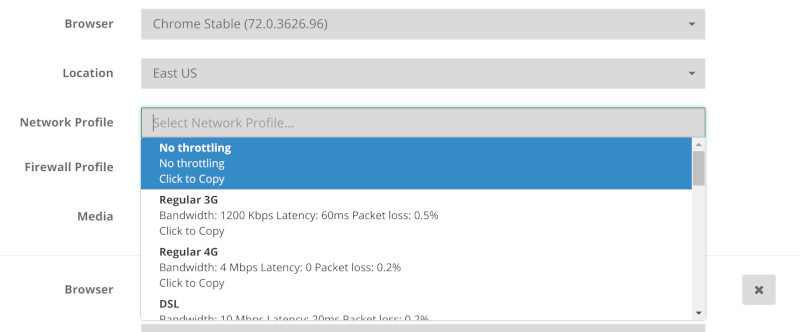
#4 – Dynamically controlling the probe’s network conditions

Sometimes what you want is to dynamically change network conditions. The team at Jitsi dabbled with that when they looked at Zoom (I’ve written about it on BlogGeek.me).

We do that using a script command in testRTC called .rtcSetNetworkProfile() which I’ve used during the webinar – what I did was this:

  • Have multiple users join the same room
  • They all stay in the room for 120 seconds
  • The first user gets throttled down to 400kbps on his network after 30 seconds
  • That lasts for 20 seconds, and then he goes back to “normal”

It looks something like this when see from one of the other user’s graphs:

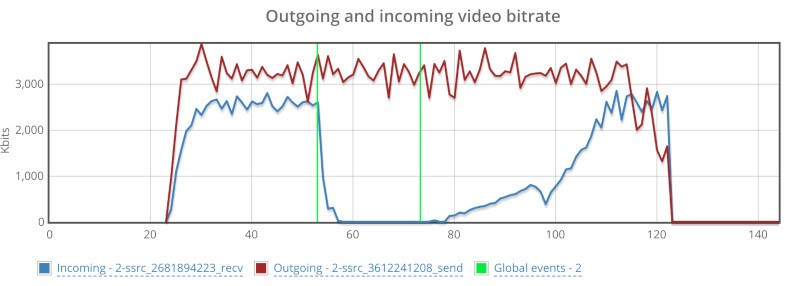
The red line represents the outgoing bitrate, which is just fine – it runs in front of the SFU and there’s no disturbance there on the network. The blue line drops down to almost zero. And takes some time to recuperate.

The webinar and demo

Most of the webinar was a long demo session. You can view it all here:

You can open up your own testRTC account and play with our service a bit under evaluation.

Our next webinar – monitoring

Here’s a kicker – I’ve started working on our next webinar about a month ago. It was to do with monitoring and the things we can do there. I even have 3 monitors running for that purpose only for a month now:

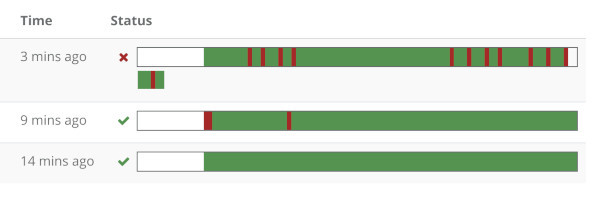
That first one with the reds in it? That’s AppRTC… and it failed. At the time that we did our webinar on network testing. And I planned to use it to show some things. So I reverted to showing results of test runs from a day earlier.

Anyways, monitoring is what our next webinar is about.

I am going to show you how to set it up and how to connect it to third party services. In this case, it will be Zapier and Google Sheet where more analysis will take place.

How Nexmo Integrated testRTC into their Test Automation for the Nexmo Voice API

Nexmo found in testRTC a solution to solve its end-to-end media testing challenges for their Nexmo Voice API product, connecting PSTN to WebRTC and vice versa.

Nexmo is one of the top CPaaS vendors out there providing cloud communication APIs to developers, enabling enterprises to add communication capabilities into their products and applications.

One of Nexmo’s capabilities involves connecting voice calls between regular phone numbers (PSTN) to browsers (using WebRTC) and vice versa. This capability is part of the Nexmo Voice API.

Testing @ Nexmo

Catering to so many customers with ongoing deployments to production means that Nexmo needs to take testing seriously. One of the things Nexmo did early on was introduce automated testing, using the pytest framework. Part of this automated testing includes a set of regression tests –  a huge amount of tests that provide very high test coverage. Regression tests get executed whenever the Nexmo team has a new version to release, but these tests can also be launched “on demand” by any engineer, they can also be triggered by the Jenkins CI pipeline upon a merge to a particular branch.

At Nexmo, development teams are in charge of the quality of their code, so there is no separate QA team.

In many cases, launching these regression tests first creates a new environment, where the Nexmo infrastructure is launched dynamically on cloud servers. This enables developers to run multiple test sessions in parallel, each in front of their own sandboxed environment, running a different version of the service.

When WebRTC was added to Nexmo Voice API, there was a need to extend the testing environment to include support for browsers and for WebRTC technology.

On Selecting testRTC

“When it comes to debugging, when something has gone wrong, testRTC is the first place we’d go look. There’s a lot of information there”

Jamie Chapman, Voice API Engineer at Nexmo

Nexmo needed WebRTC end-to-end tests as part of their regression test suite for the Nexmo Voice API platform. These end-to-end tests were around two main scenarios:

  1. Dialing a call from PSTN and answering it inside a browser using WebRTC
  2. Calling a PSTN number directly from a browser using WebRTC

In both cases, their client side SDKs get loaded by a web page and tested as part of the scenario.

Nexmo ended up using testRTC as their tool of choice because it got the job done and it was possible to integrate it into their existing testing framework:

  • The python script used to define and execute a test scenario used testRTC’s API to dynamically create a test and run it on the testRTC platform
  • Environment variables specific to the dynamically created test environment got injected into the test
  • testRTC’s test result was then returned back to the python script to be recorded as part of the test execution result

This approach allowed Nexmo to integrate testRTC right into their current testing environment and test scripts.

Catering for Teams

The Voice API engineering team is a large oneAll these users have access to testRTC and they are able to launch regression tests that end up running testRTC scripts as well as using the testRTC dashboard to debug issues that are found.

The ability to have multiple users, each with their own credentials, running tests on demand when needed enabled increased productivity without dealing with coordination issues across the team members. The test results themselves get hosted on a single repository, accessible to the whole team, so all developers  can easily share faulty test results with the team .

Debugging WebRTC Issues

Nexmo has got regression testing for WebRTC off the ground by using testRTC. It does so by integrating with the testRTC APIs, scheduling and launching tests on demand from Nexmo’s own test environment. The tests today are geared towards providing end-to-end validation of media and connectivity between the PSTN network and WebRTC. Validation that testRTC takes care of by default.

When things break, developers check the results collected by testRTC. As Jamie Chapman, Voice API engineer at Nexmo said: “When it comes to debugging, when something has gone wrong, testRTC is the first place we’d go look. There’s a lot of information there”.

testRTC takes screenshots during the test run, as well as upon failure. It collects browser logs and webrtc-internals dump files, visualizing it all and making it available for debugging purposes. This makes testRTC a valuable tool in the development process at Nexmo.

On the Horizon

Nexmo is currently making use of the basic scripting capabilities of testRTC. It has invested in the API integration, but there is more that can be done.

Nexmo are planning to increase their use of testRTC in several ways in the near future:

How Clique Migrated Smoothly to the Newest AWS EC2 C5 Instance

In a need to focus resources on core activities, Clique Communications turned to testRTC for stress testing and sizing.

Clique API provides web-based voice and text application programming interfaces. In their eight years of existence, they have grown to support over 20 million users across 150 countries. This amounts to over 500 million minutes per month. Clique’s cloud services deliver multi-party voice that can be embedded by enterprises  into their own business processes.

What are their current goals?

  • Grow the business
  • Add features to improve customer service and experience
  • Offer value-added services

Adding WebRTC

Clique started working with WebRTC some 18 months ago with customers starting to use it at the end of 2017.

Today, Clique supports all major browsers – Chrome, Firefox, Safari, and Edge; enabling its customers to offer uninterrupted interactions with their users. When a user joins a conference, he/she can do so over PSTN, directly from the browser or from within a native application that utilizes Clique SDKs.

Making Use of testRTC

As with any other software product, Clique had to test and validate its solution. To that end, Clique had already been using  tools for handling call volumes and regression, testing the application and the SDKs. The challenge was the issue of scalability and quality of service, which is essential  when it comes to WebRTC support. Clique had a decision to make – either invest in building their own set of testing tools on top of open source frameworks such as Selenium, or opt for a commercial alternative. They decided to go with the latter and use testRTC. They also preferred using a third party tool for testing as they didn’t want to burden their engineering team.

Switching from AWS EC2 C4 to C5

Clique had previously used a standard instance on Amazon from the AWS EC2 C4 series but when the AWS EC2 C5 series came out, they wanted to take advantage of it – not only was it more economical but it also had better performance. Furthermore, knowing Amazon would release newer sets of servers that would need to be tested again, Clique required this process to be repeatable.

The Action Plan

Since Clique is an embeddable service, they decided it was most strategic to have a third party develop an application using the Clique client SDK and APIs, and use that application as a test framework that could scale and grow the performance of the platform. It was a wonderful opportunity to optimize their own resources and save on the instances that they deploy on Amazon. An added bonus was having a third party that could then be used by Clique’s customers and partners who are building applications hey can use as part of their development process.

Clique wrote  their own test scripts in testRTC. The main test scenario for Clique was having a moderator who creates the conference and then generates a URL for other participants in the conference to join. Once they figured out how to do that with testRTC, the rest was a piece of cake.

Using testRTC to assist in sizing the instances on the AWS has ancillary benefits beyond Clique’s core objectives. Clique tested the full life-cycle of its solution. From developing yet another application with its SDKs, integrating its APIs, to continuous integration & devops, Clique discovered  bugs that were then fixed, optimized performance and gave Clique confidence to run services at scale in next generation architectures.

“testRTC provided Clique with a reliable and repeatable mechanism to measure our CPaaS performance… allowing Clique to save money, remain confident in our architectural choices and more importantly showcase our platform to customers with the integrity of an independent test system.”

Moving Forward – Continued use of testRTC

There are a lot of moving pieces in Clique’s solution:  infrastructure in the backend, media servers , the WebRTC gateways. Features such as recording can fit into various components within the architecture, and Clique is always looking for ways to optimize and simplify.

testRTC helps Clique evaluate if the assumptions made in their architecture are valid by determining bottlenecks and identifying places of consolidation.

In the future, Clique will be looking at testRTC’s monitoring capability as well as using testRTC to instantiate browsers in different locations.

2

Advanced Testing: Manipulating getUserMedia and Available Devices

Philipp Hancke is not new here on our blog. He has assisted us when we wrote the series on webrtc-internals. He is also not squeamish about writing his own testing environment and sharing the love. This time, he wanted to share a piece of code that takes device availability test automation in WebRTC to a new level.

Obviously… we said yes.

We don’t have that implemented in testRTC yet, but if you are interested – just give us a shout out and we’ll prioritize it.

Both Chrome and Firefox have quite powerful mechanisms for automating getUserMedia with fake devices and skipping the permission prompt.

In Chrome this is controlled by the use-fake-device-for-media-stream and use-fake-ui-for-media-stream command line flags while Firefox offers a preferences media.navigator.streams.fake. See the webdriver.js helper in this repository for the gory details of how to use this with selenium.

However there are some scenarios which are not testable by this:

  • getUserMedia returning an error
  • restricting the list of available devices

While most of these are typically handled by unit tests sometimes it is nice to test the complete user experience for a couple of use-cases

  • test the behaviour of a client with only a microphone
  • test the behaviour of a client with only a camera
  • test the behaviour of a client with neither camera or microphone
  • combine those tests with screen sharing which in some cases replaces the video track on appear.in
  • test audio-only clients interoperating with audio-video ones. The test matrix becomes pretty big at some point.

Those tests are particularly important because as developers we tend to do some manual testing on our own machines which tend to be equipped with both devices. Automated tests running on a continuous integration server help a lot to prevent regressions.

Manipulating APIs with an extension

In order to manipulate both APIs I wrote a chrome extension (which magically works in Firefox and Edge because both support webextensions) that makes them controllable.

An extension can inject javascript into the page on page load as a content script. This has been used in the webrtc-externals extension described on webrtchacks to wrap the whole RTCPeerConnection API.

In our case, the content script replaces the getUserMedia and enumerateDevices functions with wrappers that can be modified at runtime. For example, the enumerateDevices wrapper calls the original function and then uses Javascript to modify the result before returning it to the caller:

    navigator.mediaDevices.enumerateDevices = function() {
        return origEnumerateDevices()
            .then((devices) => {
                if (sessionStorage.__filterVideoDevices) {
                    devices = devices.filter((device) => device.kind !== 'videoinput');
                }
                if (sessionStorage.__filterAudioDevices) {
                    devices = devices.filter((device) => device.kind !== 'audioinput');
                }
                if (sessionStorage.__filterDeviceLabels
                    || sessionStorage.__getUserMediaAudioError === "NotAllowedError"
                    || sessionStorage.__getUserMediaVideoError === "NotAllowedError") {
                    devices = devices.map((device) => {
                        var deviceWithoutLabel = {
                            deviceId: device.deviceId,
                            kind: device.kind,
                            label: '',
                            groupId: device.groupId,
                        }
                        return deviceWithoutLabel;
                    });
                }
                return devices;
            });
    };

The full extension can be found on github. The behaviour is dynamic and can be controlled via sessionStorage flags. With Selenium, one would typically navigate to a page in the same domain, execute a small script to set the session storage flags as desired and then navigate to the page that is to be tested.

We will walk through two examples now:

Use-case: Have getUserMedia return an error and change it at runtime

Let’s say we want to test the case that a user has denied permission. For appear.in this leads to a dialog that attempts to help them with the browser UX to change that.

The full test can be found here. As most selenium tests, it consists of a series of simple and straightforward steps:

  • build a selenium webdriver instance that allows permissions and loads the extension
  • go to the appear.in homepage
  • set the List of fake devices in Chrome WebRTC testing  flag to cause a NotAllowedError (i.e. the user has denied permission) as well as an appear.in specific localStorage property that says the visitor is returning — this ensures we go into the flow we want to test and not into the “getUserMedia primer” that is shown to first-time users.
  • join an appear.in room by loading the URL directly.
  • the next step would typically be asserting the presence of certain DOM elements guiding the user to change the denied permission. This is omitted here as those elements change rather frequently and replaced with a three second sleep which allows for a visual inspection. It should look like this:
  • the List of fake devices in Chrome WebRTC testing  flag is deleted
  • this eventually leads to the user entering the room and video showing up. We do some magic here in order to avoid having to ask the user to refresh the page.

Watch a video of this test running below:


Incidentally, that dialog had a “enter anyway” button which, due to the lack of testing, was not visible for quite some time without anyone noticing because the visual regression tests could not access this stage. Now that is possible.

Restricting the list of available devices

The fake devices in both Chrome and Firefox return a stream with exactly those properties that you ask for and they always succeed (in Chrome there is a way to make them always fail too). In the real world you need to deal with users who don’t have a microphone or a camera attached to their machine. A call to getUserMedia would fail with a NotFoundError (note the recent change in Chrome 64 or simply use adapter.js and write spec-compliant code today).

The common way to avoid this is to enumerate the list of devices to figure out what is available using enumerateDevices by pasting this into the javascript console:

navigator.mediaDevices.enumerateDevices().then(devices => {
 const hasMicrophone = devices.some(device => device.kind === “audioinput”);
 console.log(‘has microphone’, hasMicrophone);
});


When you run this together with the fake device flag you’ll notice that it provides two fake microphones and one fake camera device:

When the extension is loaded (which for manual testing can be done on chrome://extensions; see above for the selenium ways to do it) one can manipulate that list:

sessionStorage.__filterAudioDevices = true;

Paste the enumerateDevices into the console again and the audio devices no longer show up:

At appear.in we used this to replace a couple of audio-only and video-only tests that used feature flags in the application code with more realistic behaviour. The extension allows a much cleaner separation between the frontend logic and the test logic.

Summary

Using a tiny web extension we could easily extend the already powerful WebRTC testing capabilities of the browsers and cover more advanced test scenarios. Using this approach it would even be possible to simulate events like the user unplugging the microphone during the call.

5

Cross Platform WebRTC Browser Testing: Chrome, Firefox, Edge & Safari

This is a guest post by Philipp Hancke. He was kind enough to share the work he’s done already in automating his own WebRTC Safari tests.

Now that Apple added WebRTC to its Safari browser, it is time to ask –

How do you test WebRTC four browsers on different operating systems? Using Selenium Grid it is surprisingly easy, learn how.

Webkit recently joined the WebRTC ship which means we now have 5 major browsers to test:

  • Chrome, any operating system
  • Firefox, any operating system
  • Microsoft Edge, Windows 10
  • Safari (Technology Preview), OSX

Until a few days ago it was feasible to run tests all WebRTC supported browsers only on a single operating system (Getting Chrome, Firefox and Edge tested on Windows 10). With Safari, that has changed. Sounds like a big problem, no?

This kind of testing is typically done using Selenium which is used to remotely control the browser. And if it is remotely controlled it can be done with selenium’s grid functionality. Which is surprisingly easy.

Say we want to test Edge and Safari from a Windows machine. First step is to download the selenium standalone jar file. I am still sticking to version 3.3.1. Next, set up a selenium grid hub on one machine by running:

java -jar selenium-server-standalone-3.3.1.jar -role hub

This will start a hub which is where you connect your selenium nodes as well as test clients to. It will also tell you the URL that you need to connect your nodes to.

Next, start a node on your OSX machine by running:

java -jar selenium-server-standalone-3.3.1.jar -role node -hub http://where-your-hub-tells-you-it-is-running -browser “browserName=safari”

This will start a node that will run your Safari instance.

Now, in the code running selenium you need to instruct it to do two things:

  • Use Safari Technology Preview as shown in this PR
  • Make it use the hub as shown here

Next run your test code. If it works out of the box, great. If it does not you will probably spend a lot of time figuring out the issues. The most common issue here is forgetting to include the respective WebDriver binary in a path where it is found.