
How do you find the current active connection in webrtc-internals?
Today, we want to help you find the current active connection in webrtc-internals.
To make this article as accurate as possible, I decided to go to my source of truth for the low level stuff related to WebRTC – Philipp Hancke, also known as fippo or hcornflower. This in a way, is a joint article we’ve put together.
Before we do, though, make sure that you know what the parameters in chrome://webrtc-internals mean. If you don’t, then you should start with our previous article, which explains the meaning of the parameters in webrtc-internals (and getstats).
First things first:
Why is this of any importance?
While you can always go and check the statistics on your connection and channels, there are times when what you really want to do is understand HOW you got connected.
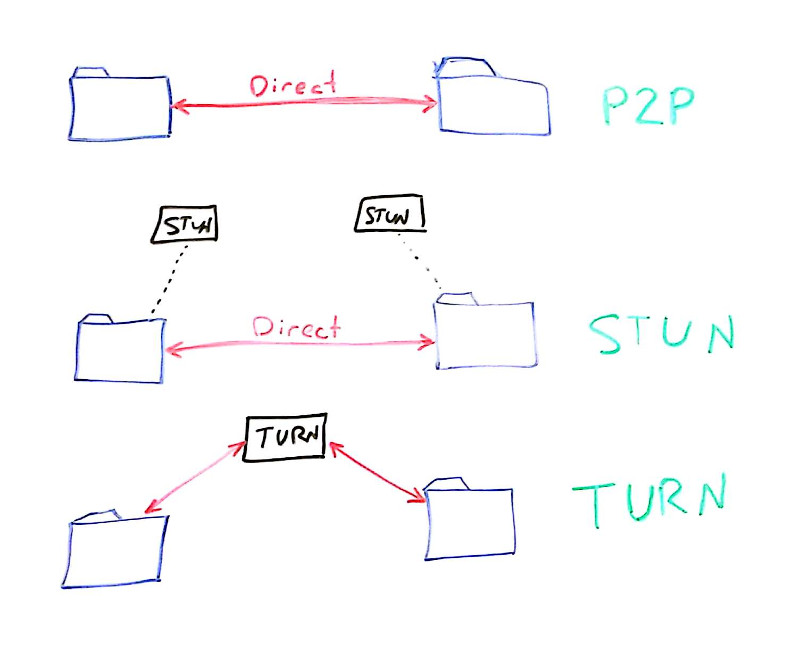
WebRTC allows connections to take one of 3 main routes:
- Direct P2P
- By making use of STUN (to find a public IP address)
- By making use of TURN (to relay all of your media through it)
Which one did you use for this connection? Did this call end up going via TURN over TCP?
There are two times when this will be useful to us:
- When trying to understand what occurred in this call, how the ICE negotiation took place, which candidate ended up being used, did we need to renegotiate or switch between candidates – we need to know how to find the active connection
- When we want to know this programmatically – especially if we are collecting these WebRTC stats and trying to ascertain the test results from it or how our network behaves in production with live users
What is an active connection in WebRTC?
WebRTC uses the ICE protocol (described in RFC 5245 if you are really keen on the details) to find a way to connect two peers which may be behind NAT routers. To establish a connection, each peer gathers a number of candidates.
There are host candidates which represent local ip addresses and ports. These have a “typ host” when you expand the onicecandidate or addIceCandidate events in webrtc-internals.
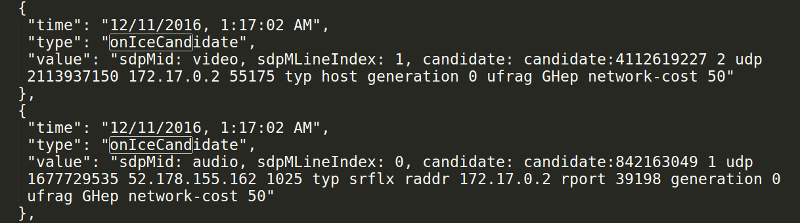
Similarly, there are serverreflexive candidates where the peer asked a STUN server for its public ip address. These will have a “typ srflx” and an additional raddr field that shows the local ip address where this originated.
Last but not least there are relay candidates. Here, the peer asked a TURN server to open a port and relay traffic. These will show up in the onicecandidate and addIceCandidate with a “typ relay”. To make things more difficult, WebRTC clients can use either UDP, TCP or TLS to connect to the TURN server.
Let’s assume that you see a number of onicecandidate and addIceCandidate calls in webrtc-internals. There are conditions where this does not happen but typically WebRTC will use a technique known as “trickle ice”.
Once candidates have been exchanged, the WebRTC engine forms pairs of local and remote candidates and starts sending STUN packets to check if it gets a response. While the details of this are very much hidden from the application we can observe what is going on in webrtc-internals (and the getStats() API).
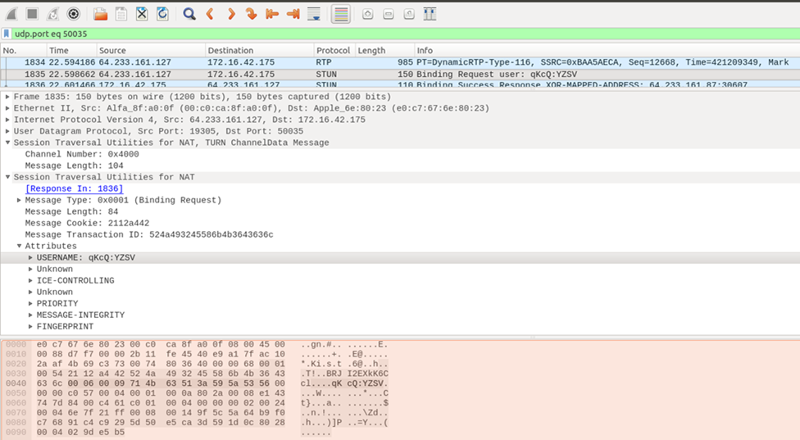
The screenshot above was taken from Wireshark, a tool that can be used to sniff the local network. It shows a TURN message flowing in a session during the connection setup stage.
How do we find the current active connection in webrtc-internals?
Open one of the WebRTC samples that establishes a local peer-to-peer connection, mute your speaker and start a call. Also open chrome://webrtc-internals. Now let’s see if we can find out together the active connection.
Now that we’re running the “local peer-to-peer connection” sample off the WebRTC samples repository, there’s something to remember – it does not use STUN and TURN servers, so the number of candidates exchanged will be quite small. We’ve selected it on purpose, so we won’t have so much clutter to go over. What you will see is just four candidates in the onicecandidate event of the first connection (because of some rules about rtcp-mux and BUNDLE) and a single candidate in the addIceCandidate event.
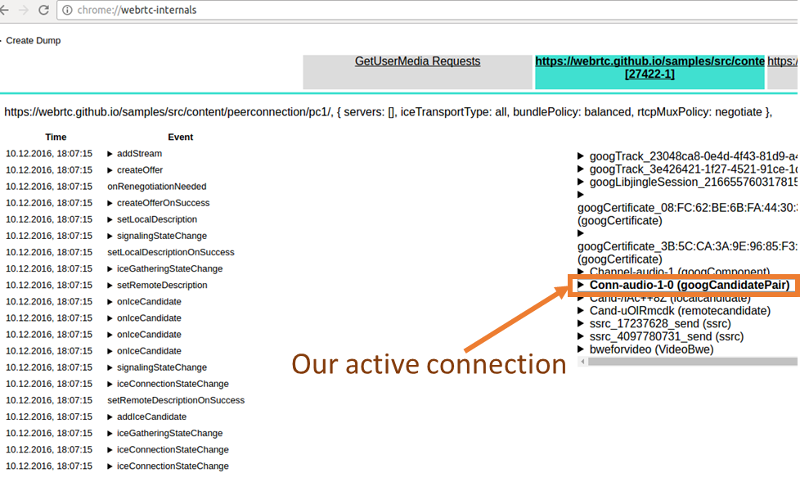
Now which of those candidate pairs is used? Fortunately webrtc-internals gives up a hint by showing the active candidate pair in bold. Typically the id of this will be Conn-audio-1-0 (with BUNDLE, the same candidate pair and connection is used also for the video). Let’s expand this and see why it is marked as bold:
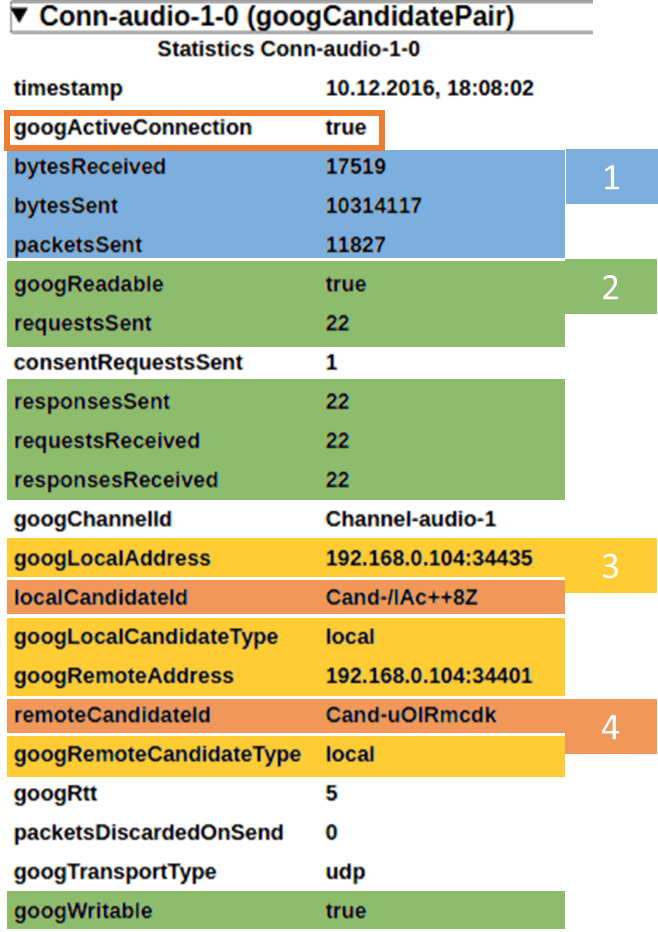
The most important thing here is the googActiveConnection attribute which is true for the currently active connection and false for all others. We see quite a number of attributes here and while some of them have been discussed in the previous post let us repeat what we see here:
- bytesReceived, bytesSent and packetsSent specify the number of bytes and packets sent over this connection. packetsReceived is still MIA but since it is not part of the specification that probably will not change anymore
- googReadable specifies whether STUN packets were received on this pair, googWritable whether responses were sent. These google properties have been replaced by the requestsReceived, responsesSent, requestsReceived and responsesSent standard counters
- googLocalAddress and googRemoteAddress show the local IP and port. This is quite useful if you need to correlate the information in webrtc-internals with a Wireshark dump. googLocalCandidateType and googRemoteCandidateType give you more information about whether this was a local, serverreflexive or relayed candidate
- localCandidateId and remoteCandidateId give you the names of the local and remote candidate statistics. These allow you to get even more details
Lets search for the local and remote candidates specified in the localCandidateId and remoteCandidateId fields. Again this is pretty easy since there is only a single candidate pair.
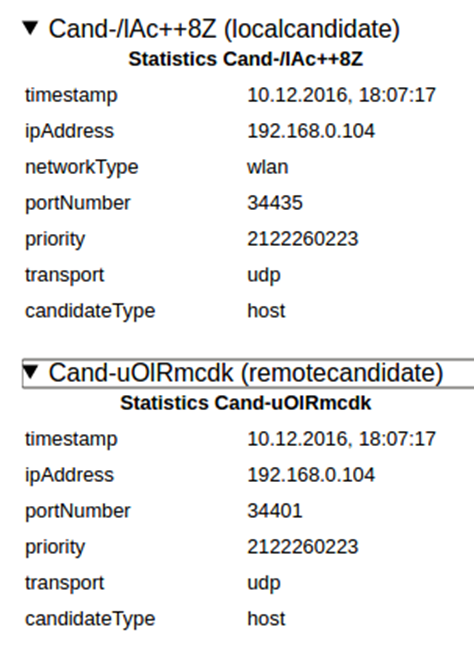
Despite having a different type (localcandidate and remotecandidate; the specification changed this slightly to local-candidate and remote-candidate; we imagine there was a lengthy discussion about the merits of the hyphen), the information in both candidates is the same:
- the ipAddress is where packets are sent from or sent to
- the networkType allows you to figure out the type of the network interface
- the portNumber gives you the port that packets are sent to or from
- the transport specifies the transport protocol of the candidate as shown in the candidate line. Typically this will be udp unless ICE-TCP is used
- the candidateType shows whether this is a host, srflx, prflx or relay candidate. See the specification for further details
- the priority is the priority of the candidate as defined in RFC 5245
The most interesting field here is the priority. When the implementation following the definition of the priority from RFC 5245, the highest 8 bit specify the type preference (= you’ll need to shift the priority attribute right >> 24 bits). This is of particular interest since for local candidates with a candidateType relay we can figure out the transport used between the client and the TURN server. Chrome uses a type preference of 2 for relay candidates allocated over TURN/UDP, 1 for TURN/TCP and 0 for TURN/TLS. Calculating priorities this way means that relayed connections will have a lower priority than any non-relayed candidates and that TURN servers will only be used as a fallback. As we have described previously, using TURN/TCP (or TURN/TLS) changes the behaviour of the WebRTC quite drastically. If you find this hard to understand do not worry, the specification is currently updated to address this!
What happens during an ICE restart?
So far we have been using a very simple example. Let’s make things more complicated with one of Philipp’s favorite topics, ICE restarts. Navigate away from the previous sample and go to this sample. Make a call. You will see an active candidate pair on chrome://webrtc-internals. Click on the “Restart ICE” button. Note how the data on the candidate pair Conn-audio-1-0 has changed, the ip addresses have changed and the STUN counters have been reset. And the data we have seen previously is now (usually) on a report with the identifier Conn-audio-1-1. The candidate pair is not used any longer but will stick around in getStats (and consequently webrtc-internals).
This is somewhat unexpected (and lead to filing an issue). It seems like the underlying webrtc.org library is renaming the reports in a way such that the active candidate always has the id Conn-audio-1-0. It has behaved like this for ages but this has some disadvantages. Among other things, it is not safe to assume that the number of bytesSent will always increase as it could reset, similar to a bug resetting the bytesSent counters on the reports with a type of ssrc that we have seen in the last post.
What’s next?
What have we learned so far?
- The meaning of parameters in webrtc-internals and getstats
- Active connections in WebRTC
- We saw why knowing and understanding the active connection is important (mainly for debugging purposes)
- We then went to look at how we find an active connection (it is in bold, and it’s googActiveConnection attribute is set to true
- We also reviewed the interesting attributes we can find on an active connection.
- We then linked back the active connection to its candidate pair using the candidates id’s, and found out the candidate type from it
- We even learned how to find over what transport protocol a candidate is allocated on a TURN server
We’ve only just started exploring webrtc-internals, and our plan is to continue working on them to create a series of articles that will act as the knowledge base around webrtc-internals.
If you are interested in keeping up with us, you might want to consider subscribing.
Huge thanks for Fippo in assisting with this series!

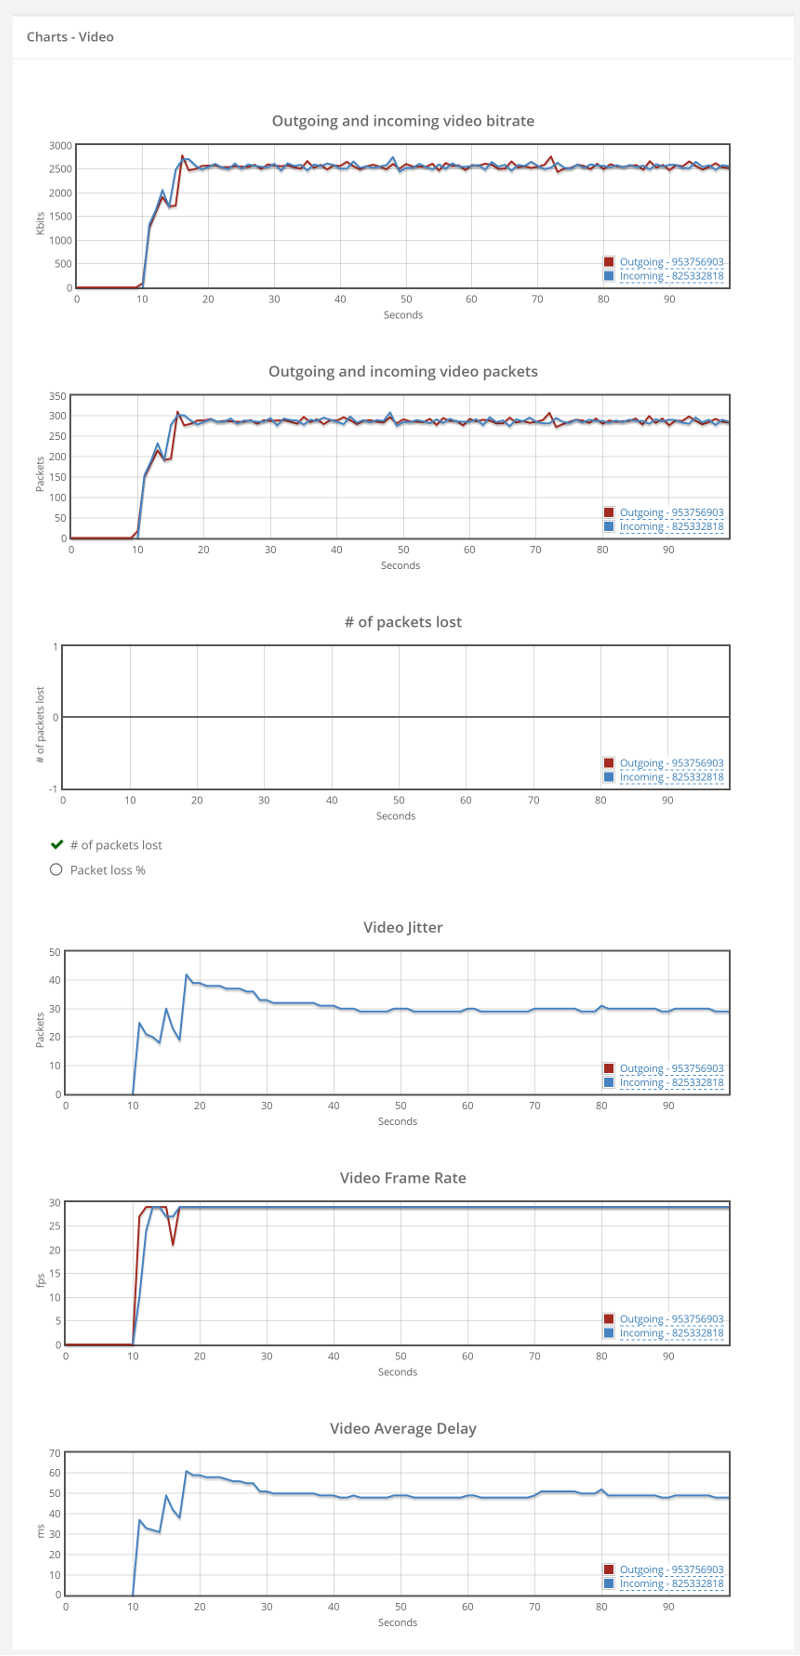
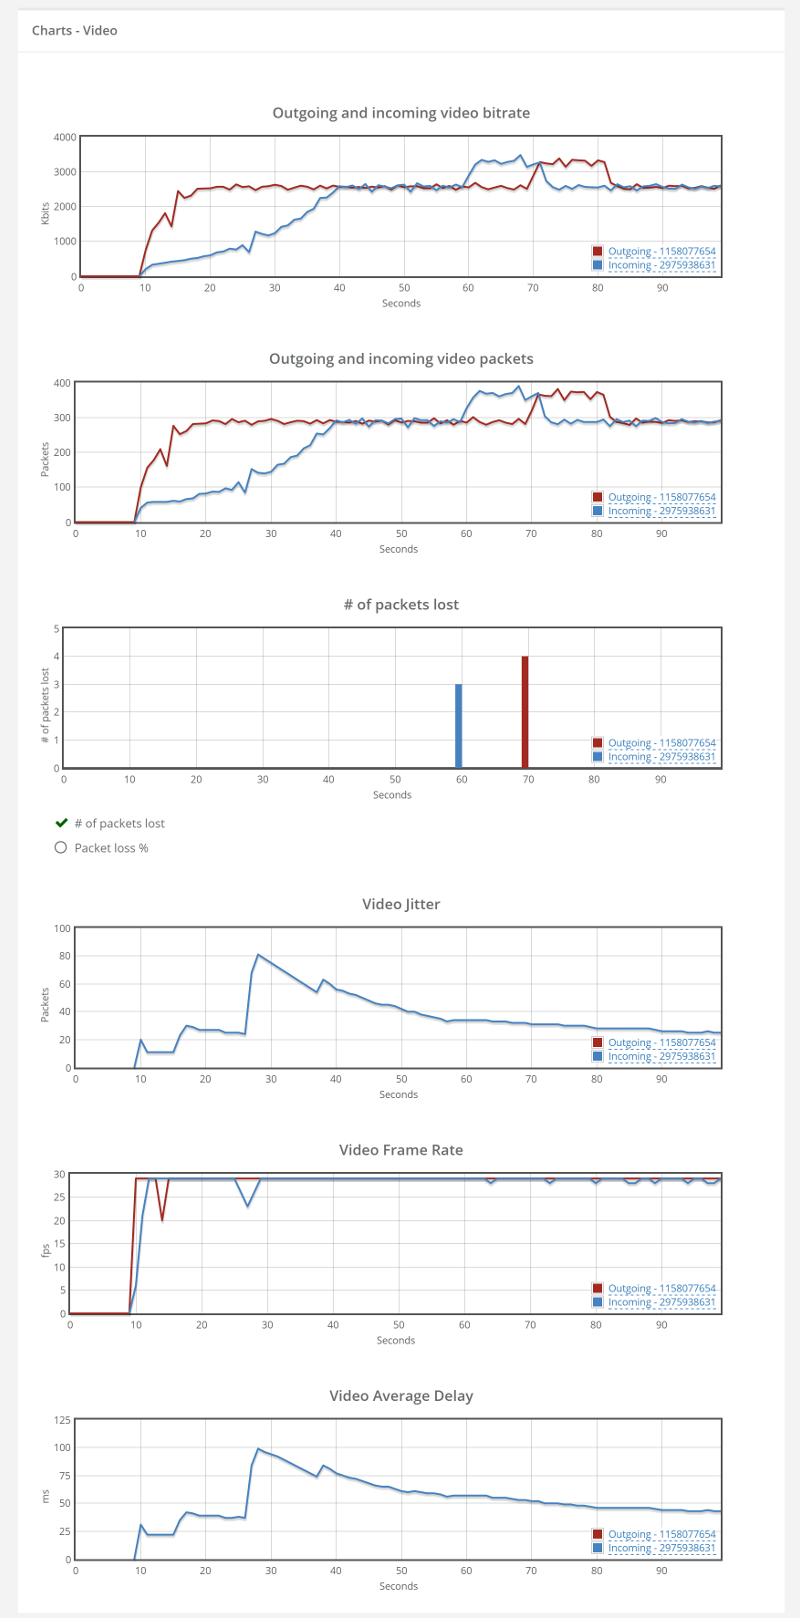
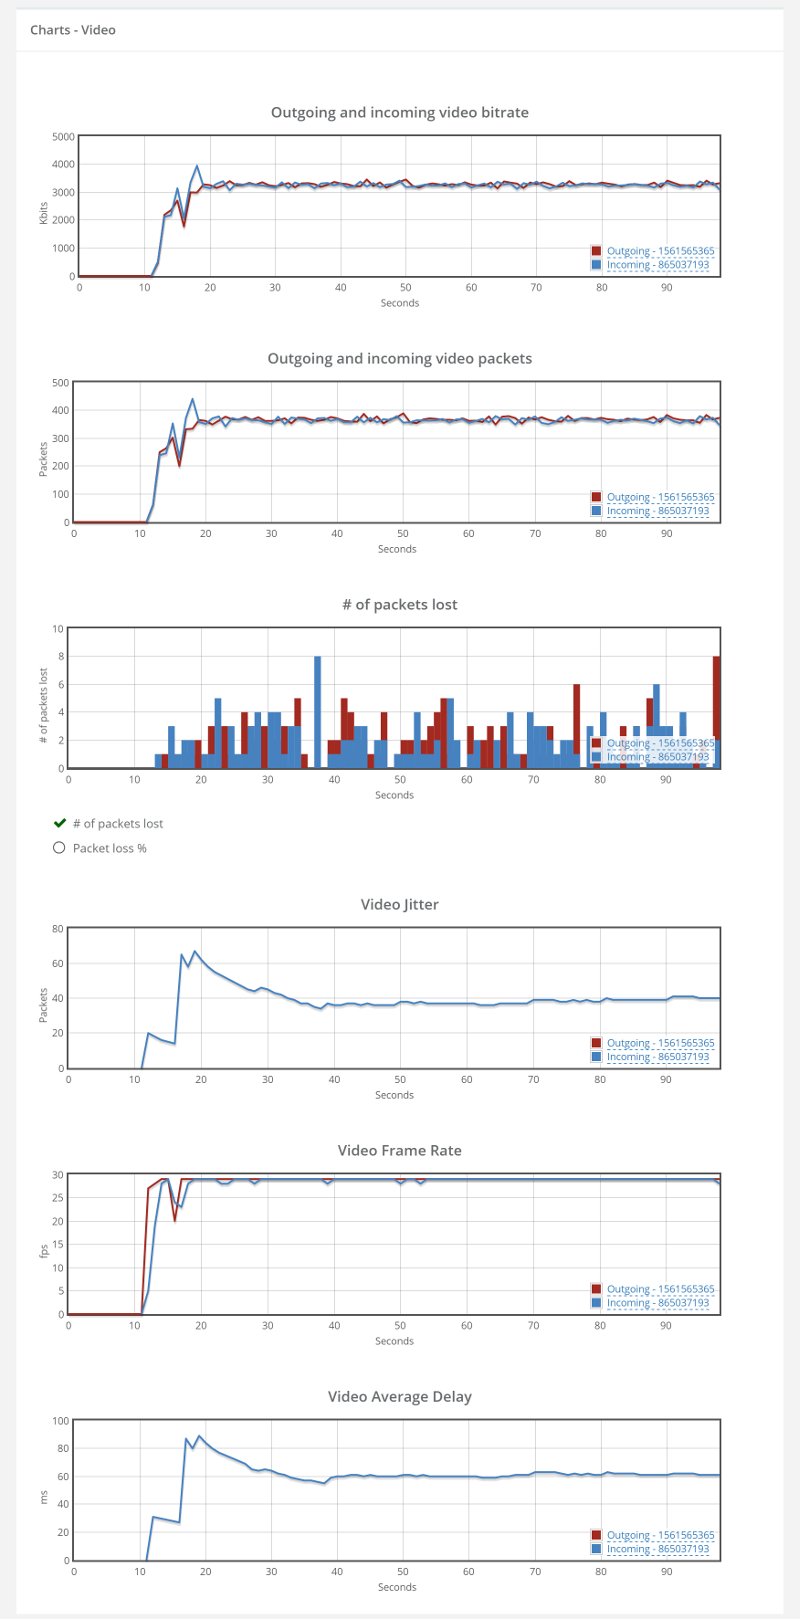
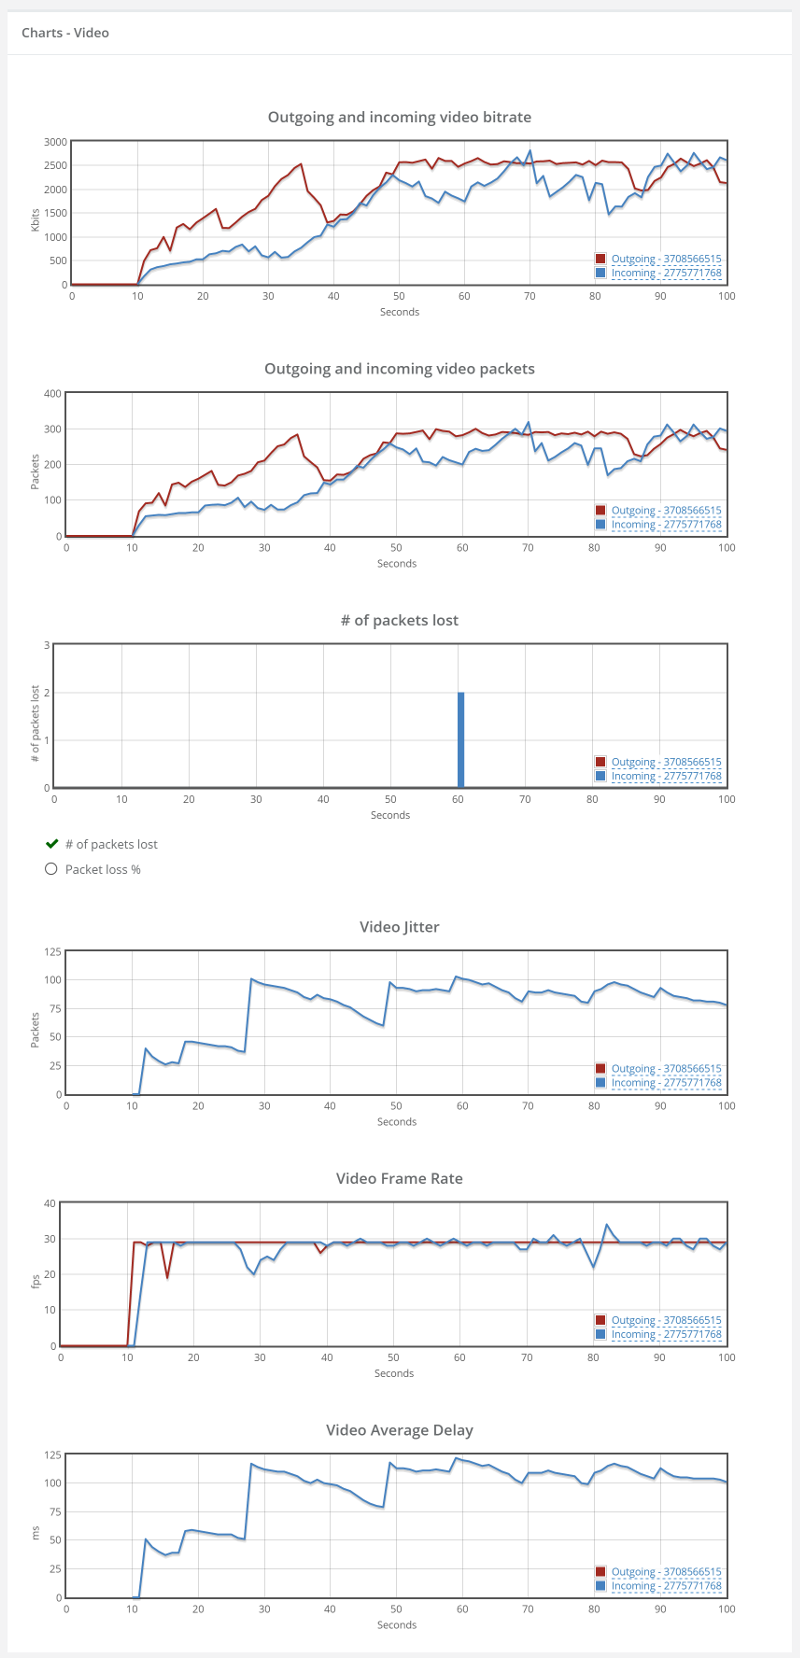 Things don’t really stabilize… at least not in a 90 seconds period of a session.