1

Your best WebRTC debugging buddy? The webrtc-internals API trace
This time, we take you through the webrtc-internals API trace to see what can you learn from it.
To make this article as accurate as possible, I decided to go to my source of truth for the low level stuff related to WebRTC – Philipp Hancke, also known as fippo or hcornflower. This in a way, is a joint article we’ve put together.
Before we do, though, you should probably check out the other articles in this series:
- Parameter’s meaning in webrtc-internals
- Finding the current active connection in webrtc-internals
Now back to the API trace.
WebRTC is asynchronous
Here’s something you probably already noticed. WebRTC is asynchronous to the extreme. It almost painstakingly makes sure that whatever you are trying to achieve – you won’t be able to without multiple calls in different contexts of your JavaScript app in the browser.
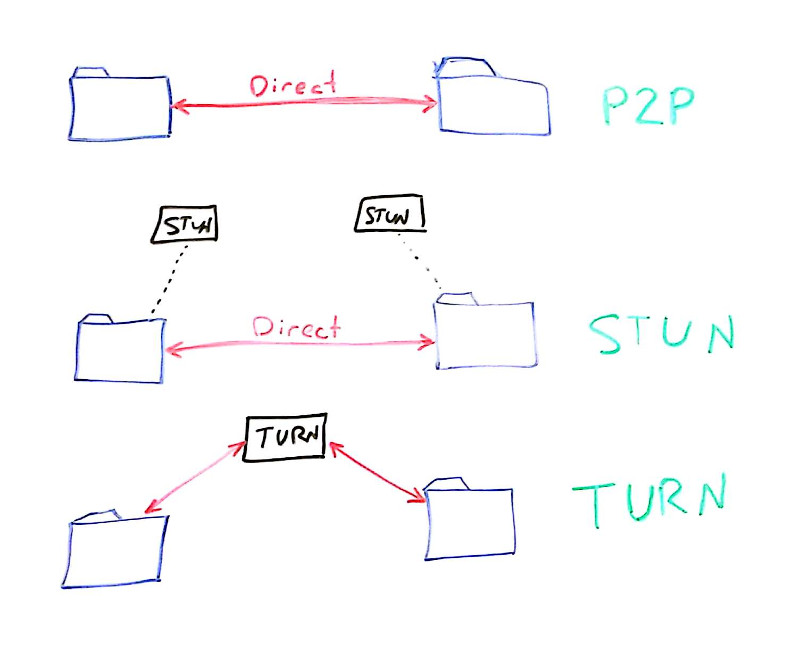
It isn’t because the authors of WebRTC are mean. It is because the nature of communications is asynchronous. It is made worse by the various network topologies that require the use of curses like STUN, TURN and ICE and by the fact that we require the user to authorize things like accessing his camera.
This brings us to the tricky situation of error handling. With WebRTC, it takes place everywhere. Anything you do can fail twice:
- When you call the API and it returns
- When the callback/promise/event handler/whatever returns back with the result of your API call
This means that in many cases, you are going to be left with a half baked solution that looks at some of the error cases (did you ever see a sample that takes care of edge cases or failure scenarios?).
It also means that often times you’ll need to be able to debug them. And that’s what the API trace in webrtc-internals can help you with.
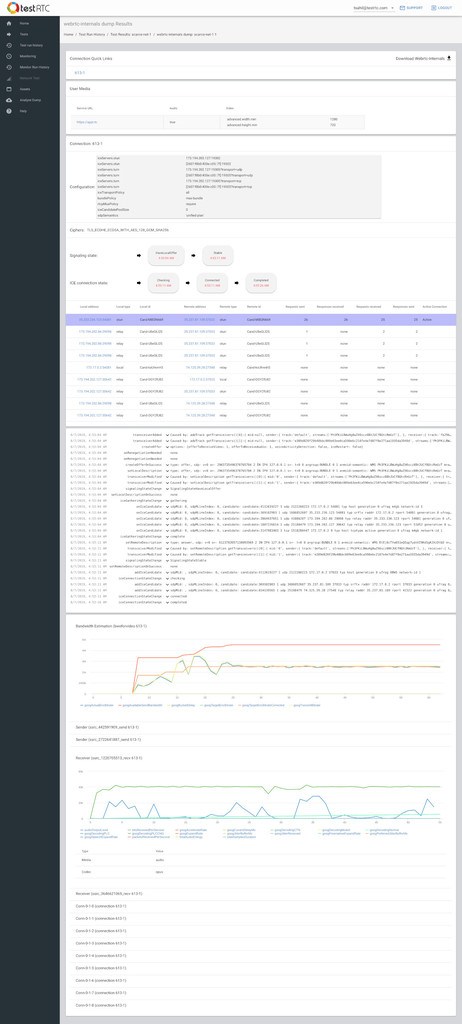
The webrtc-internals API trace
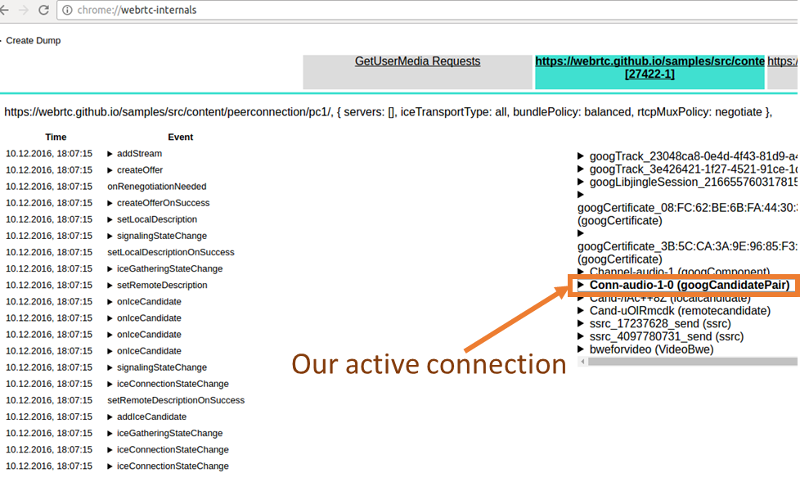
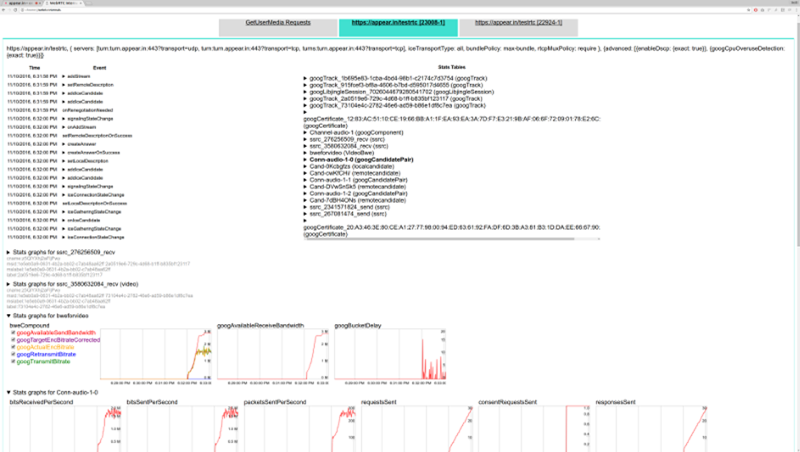
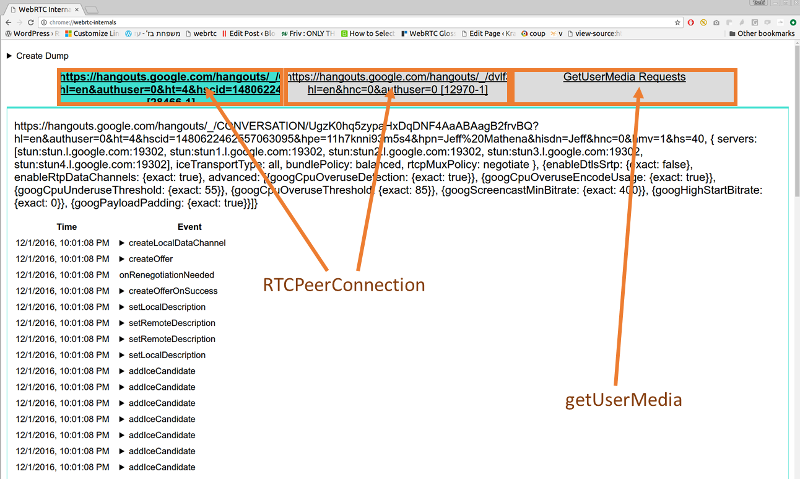
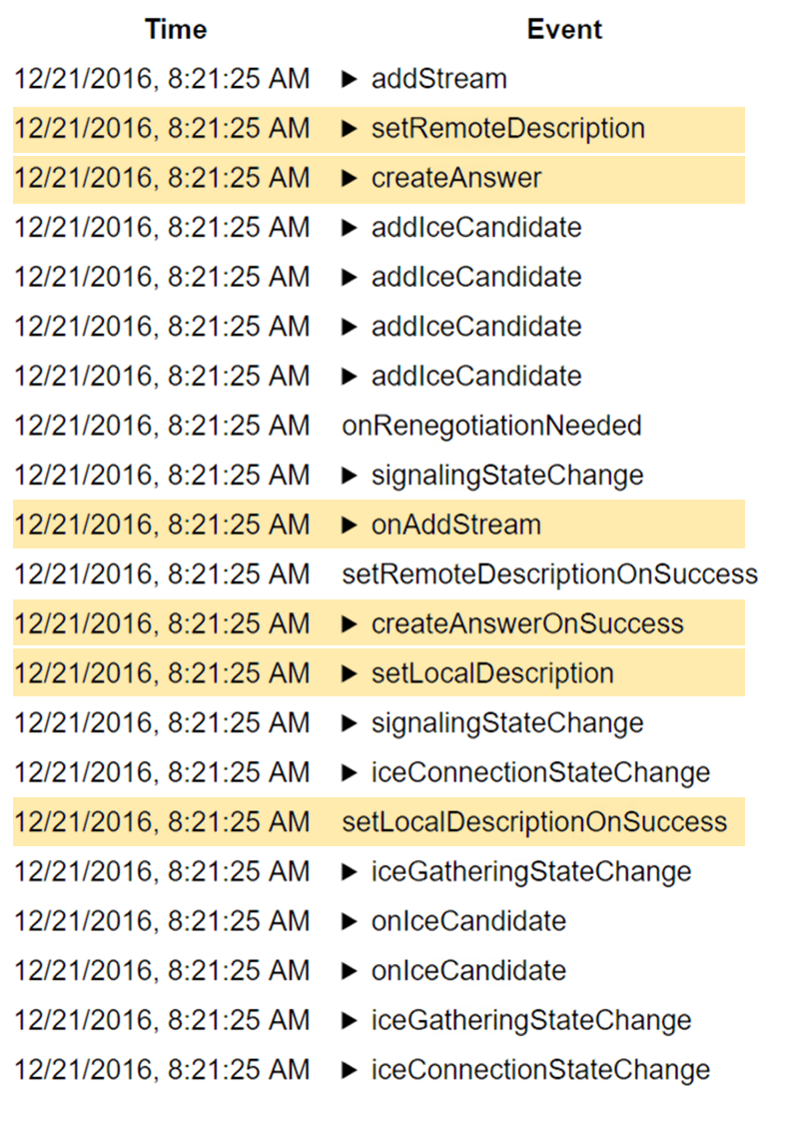
If you open chrome://webrtc-internals while in an active WebRTC session, you will immediately see the API trace:
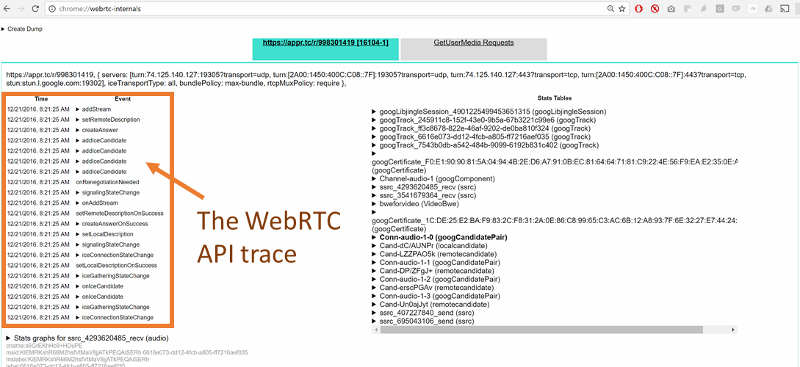
This is the list of API calls and events done on the peer connection, informing you of the progress and state of the connection.
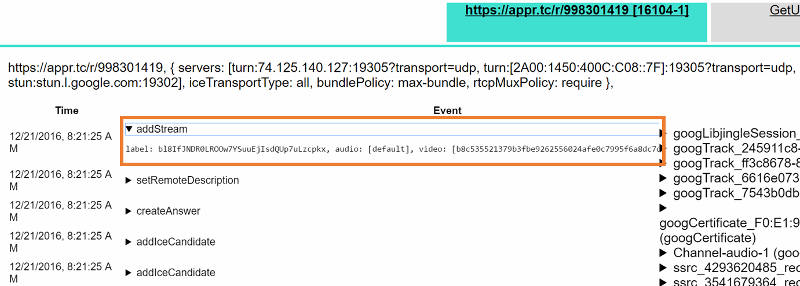
You can click on any of these APIs to see its parameters.
Before we look at what kind of analysis we can derive from these traces, let’s look at what some of the connection methods and events do.
- addStream: if this method was called, the Javascript code has added a MediaStream to the peerconnection. You can see the id of the stream as well as the audio and video tracks. onAddStream shows a remote stream being added, including the audio and video track ids, it is called between the setRemoteDescription call and the setRemoteDescriptionOnSuccess callback
- createOffer shows any calls to this API including the options such as offerToReceiveAudio, offerToReceiveVideo or iceRestart. createOfferOnSuccess shows the results of the createOffer call, including the type (which should be ‘offer’ obviously) and the SDP resulting from it. createOfferOnFailure could also be called indicating an error but that is quite rare
- createAnswer and createAnswerOnSuccess and createAnswerOnFailure are similar but with no additional options
- setLocalDescription shows you the type and SDP used in the setLocalDescription call. If you do any SDP munging between createOffer and setLocaldescription you will see this here. This results in either a setLocalDescriptionOnSuccess or setLocalDescriptionOnFailure callback which shows any errors. The same applies to the setRemoteDescription and its callbacks, setRemoteDescriptionOnSuccess and setRemoteDescriptionOnFailure
- onRenegotiationNeeded is the old chrome-internal name for the onnegotiationneeded event. If your app uses this you might want to look for it
- onSignalingStateChange shows the changes in the signaling state as a result of calls to setLocalDescription and setRemoteDescription. See the wonderful diagram in the specification for the gory details. At the end of the day, you will want to be in the stable state most of the time
- iceGatheringStateChange is the little brother of the ice connection state. It will show you the state of the ice gatherer. It will change to gathering after setLocalDescription if there are ICE candidates to gather
- onnicecandidate events show all candidates gathered, with information for which m-line and MID. Likewise, the addIceCandidate method shows that information from the other side. Typically you should see both event types. See below for a more detailed discussion of these events
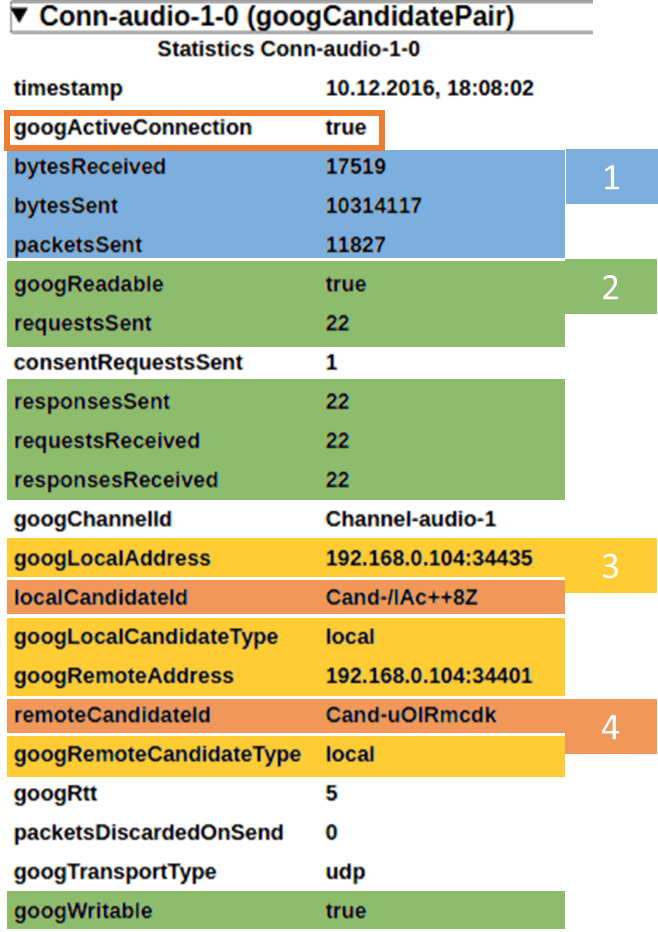
- oniceconnectionstate is one of the most important event handlers. It tells you whether a peer-to-peer connection succeeded or not. From here, you can start searching for the active candidate as we explained in the previous post
The two basic flows we can see are that of something offering connections and answering. The offerer case will typically consist of these events:
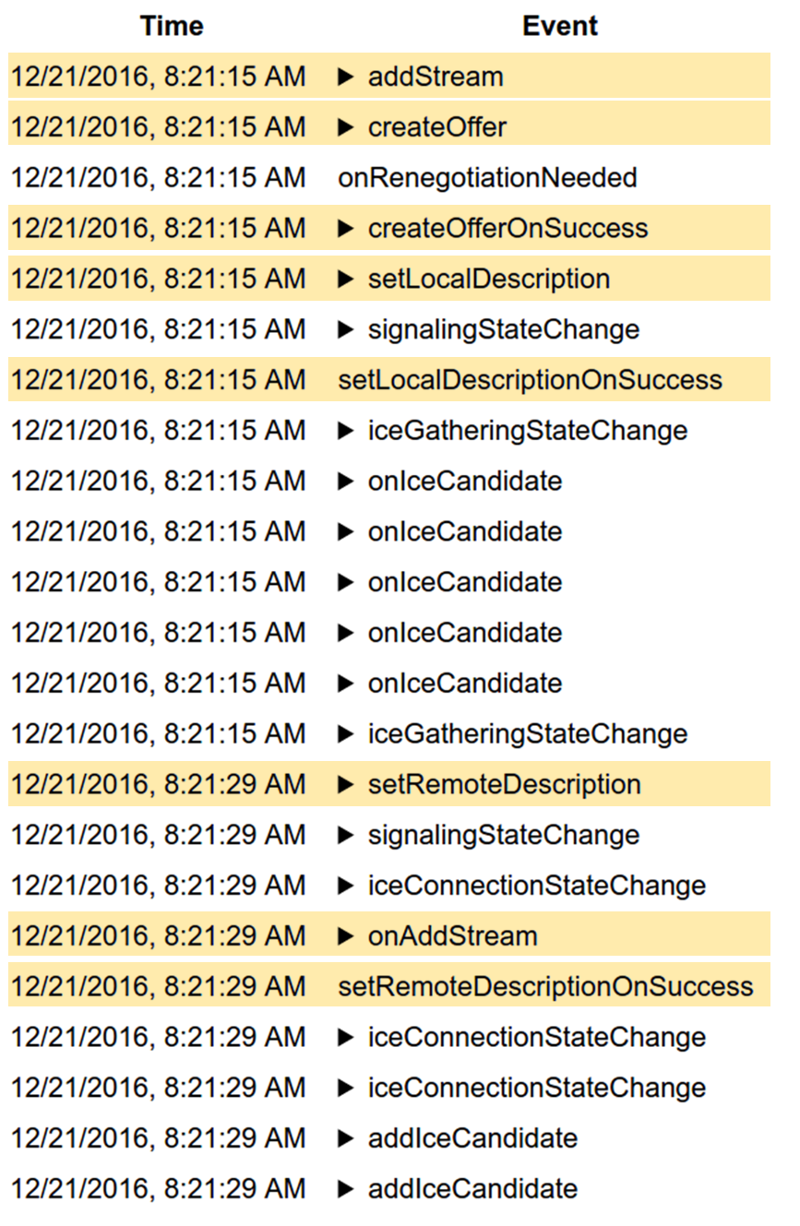
- (addStream if the local side wants to send media)
- createOffer
- createOfferOnSuccess
- setLocalDescription
- setLocalDescriptionOnSuccess
- setRemoteDescription
- (onaddstream if the remote end signalled media streams in the SDP)
- setRemoteDescriptionOnSuccess
While the answerer case will have:
- setRemoteDescription
- (onaddstream if the remote end signalled media streams in the SDP)
- createAnswer
- createAnswerOnSuccess
- setLocalDescription
- setLocalDescriptionOnSuccess
In both cases there should be a number of onicecandidate events and addIceCandidate calls along with signaling and ice connection state changes.
Let us look at two specific cases next.
Example #1 – My WebRTC app works locally but not on a different network!
This is actually one of the most frequent questions on the discuss-webrtc list or on stackoverflow. Most of the time the answer is “you need a TURN server” and “no, you can not use some TURN server credentials that you found somewhere on the internet”.
So it works locally. That means that you are creating an offer, sending it to the remote side, calling setLocalDescription() and are getting an answer that you feed into setRemoteDescription(). It also means that you are getting candidates in the onicecandidate() event, sending them to the remote side and getting candidates from there which you call the addIceCandidate() method with.
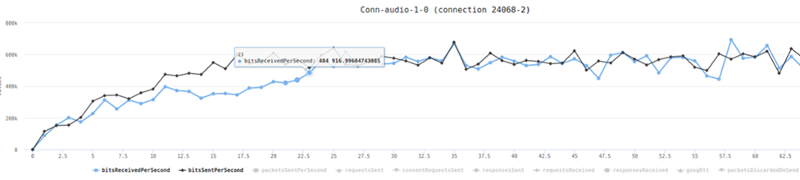
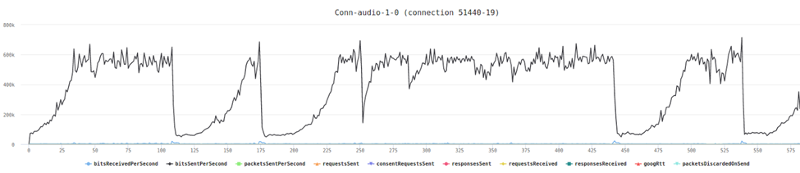
And locally you get a oniceconnectionstatechange() event to connected or completed:

Great! You probably just copied and pasted these pieces of code from somewhere on github.
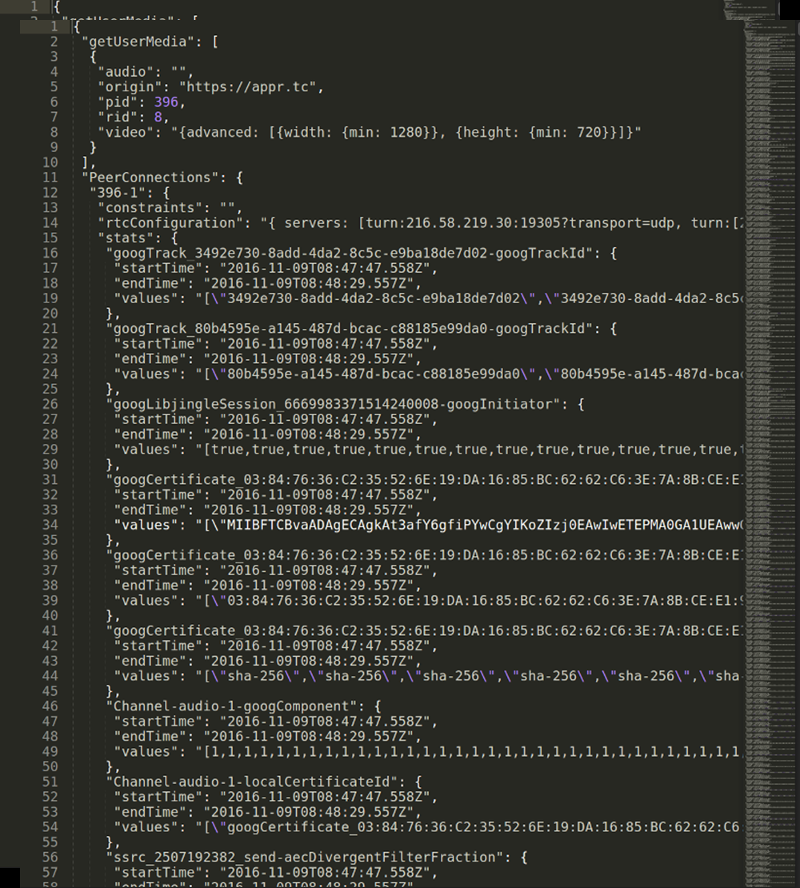
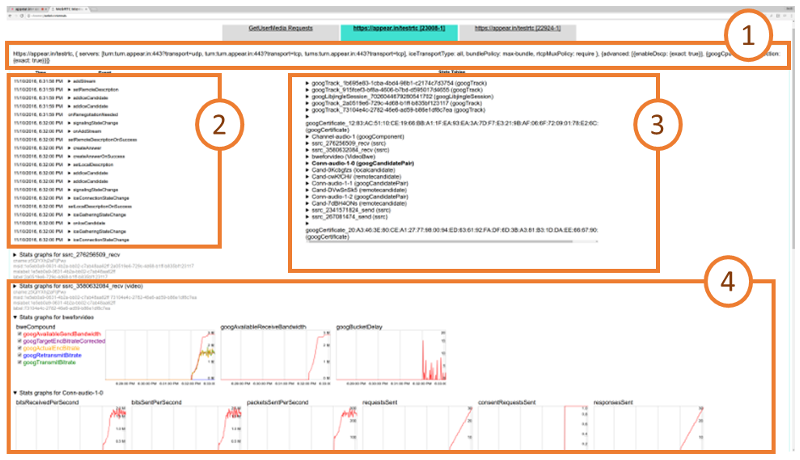
Now… why does it not work when you’re on a different network? On different networks, you need both a STUN and a TURN server. Check if your app is using a STUN and TURN server and that you’re passing them correctly at the top of webrtc-internals:

As you can see (assuming you have good eyes), there are a number of ice servers used here. In the case of our screenshot, it’s Google’s apprtc sample. There is a stun server, stun:stun.l.google.com:19302. There are also four TURN servers:
- turn:64.233.165.127:19305?transport=udp
- turn:[2A00:1450:4010:C01::7F]:19305?transport=udp
- turn:64.233.165.127:443?transport=tcp
- turn:[2A00:1450:4010:C01::7F]:443?transport=tcp
As you can see, apprtc uses TURN over both UDP and TCP and is running TURN servers for both IPv4 and IPv6.
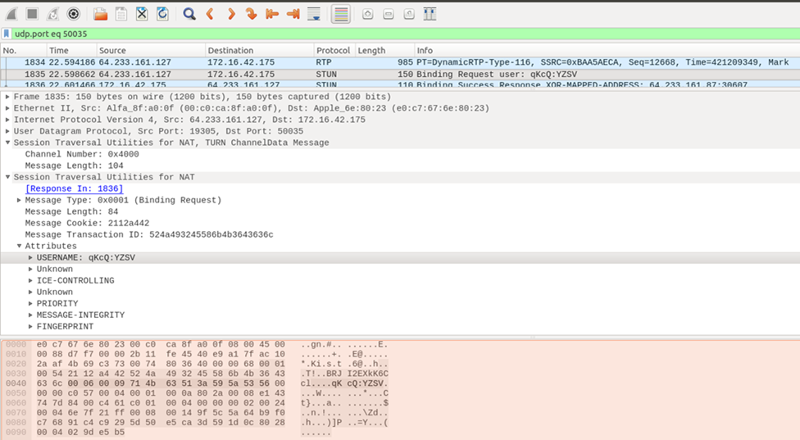
Now just because you configured a TURN server does not mean there won’t be any errors. The TURN server might not be reachable. Or your credentials might not work (this will happen if you “found” the credentials on a list of “free public servers”). In order to verify that the STUN and TURN servers you use actually work you need to look at the onicecandidate() events.
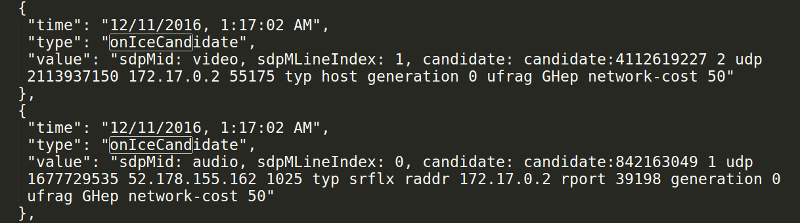
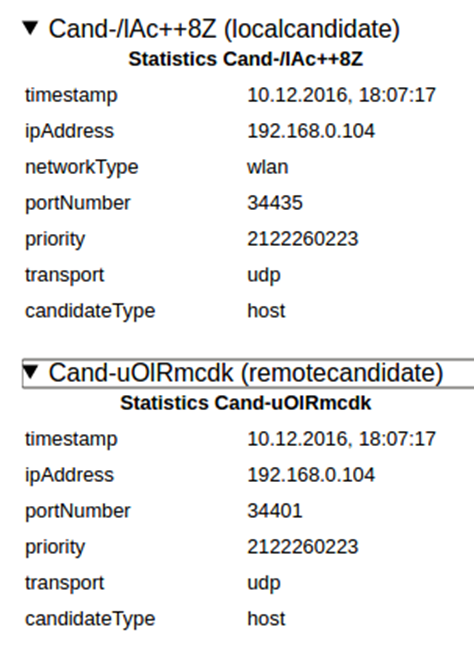
If you use a STUN or a TURN server, you should see a onicecandidate() event with a candidate that has a ‘typ srflx’.
Similarly, if you use a TURN server, you need to check if you get an onicecandidate() event where the candidate has a ‘typ relay’.
Note that Chrome stops gathering candidates once it establishes a connection. But if your connection gets established you are probably not going to debug this issue.
If you get both of these you’re fine. But you also need to check what candidates your peer sent you with which addIceCandidate() was called.
Example #2 – The network is blocking my connection
Networks that block UDP traffic are quite common. TURN/TCP and TURN/TLS (as well as ICE-TCP even though we mention this mostly to make Emil Ivov happy) provide a way to enable calls even on those networks. This has some effect on the media quality as we discussed previously but let us see how we can detect whether we are on a network that is blocking UDP traffic to begin with.
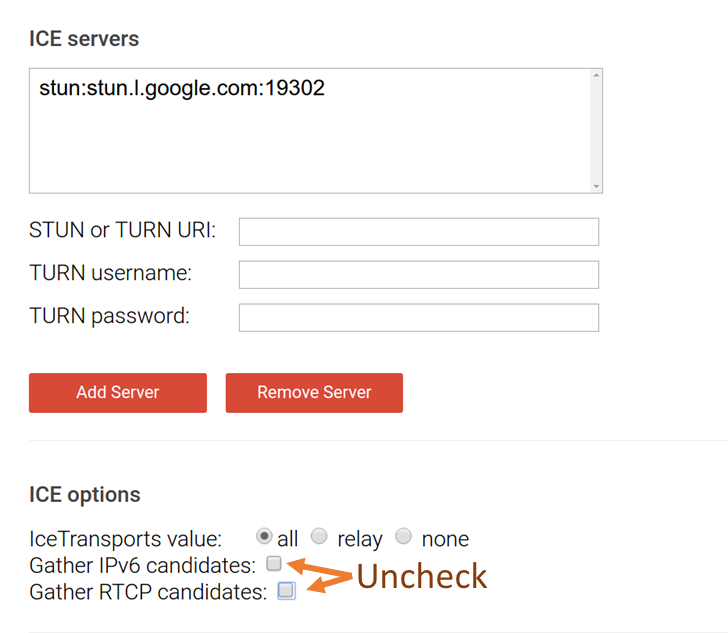
If you want to follow along, open webrtc-internals and the webrtc candidate gathering demo page and start gathering. By default, it uses one of Google’s STUN servers. To keep things simple, uncheck the “gather IPv6 candidates” and “gather RTCP candidates” boxes before clicking on the “gather candidates” button:
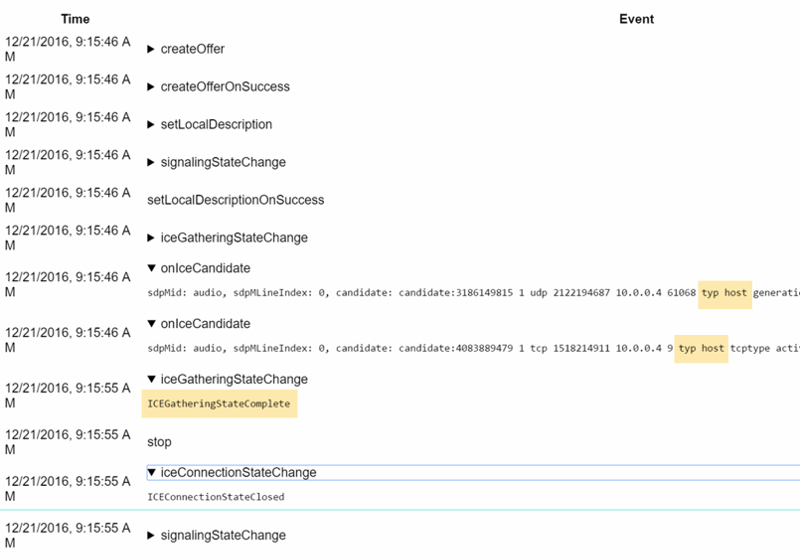
On webrtc-internals you will see a createOffer call with offerToReceiveAudio set to true (this is to create an m-line and gather candidates for it):
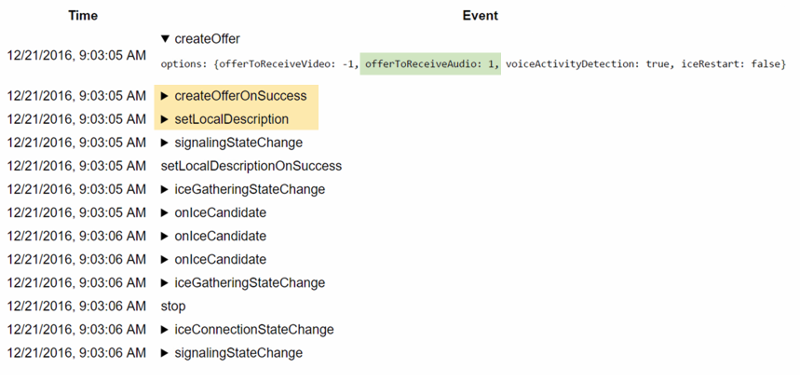
Followed by a createOfferOnSuccess and a setLocalDescription call. After that there will be a couple of onicecandidate events and an icegatheringstatechange to completed, followed by a stop call.
There should be an onicecandidate with a candidate that has a “typ srflx” in it:
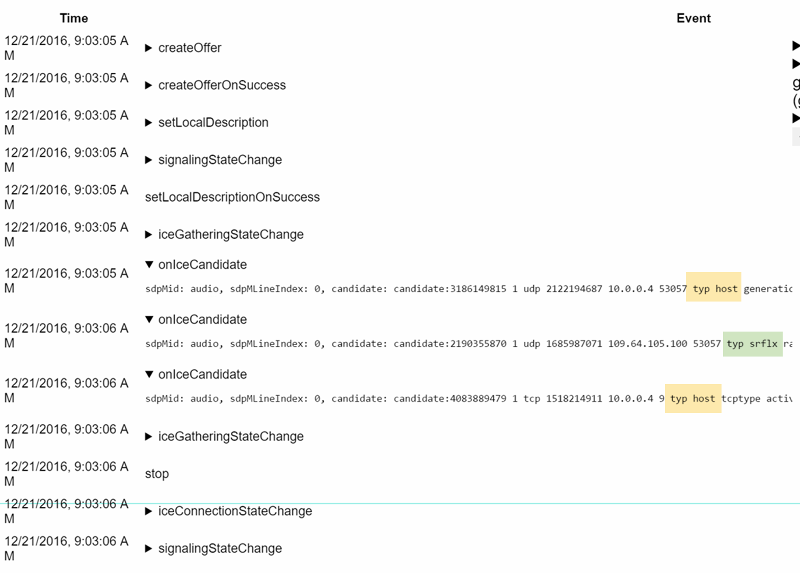
It shows your public ip. If you don’t get such a candidate but only host candidates, either the STUN server is not working (which in the case of Google’s STUN server is somewhat unlikely) or your network is blocking UDP.
Now block UDP on your network (but mind you, do not block port 53 for DNS). If you don’t know a quick way to block UDP, lets try to simulate that by changing the stun server to something that will not respond, in this case Google’s well-known DNS server running at 8.8.8.8:
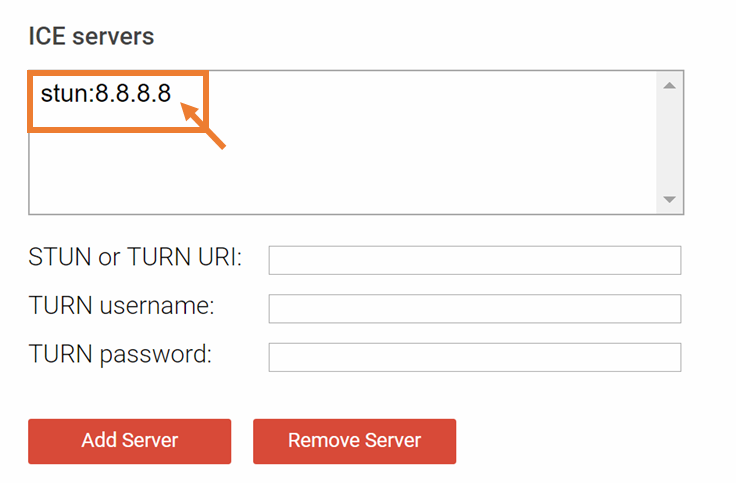
Click “gather candidates” again. After around 10 seconds you will see a gathering state change to completed in webrtc-internals. But you will not see a server-reflexive candidate:
You can try the same thing with a TURN UDP server. Make sure your credentials are valid (again, the “public TURN server list” is not a thing). This will show both a srflx and a relay candidate.
One of the nice tricks you can do here is to change the password to something invalid. Then you will only get a srflx but no relay candidate. Which is a nice and easy way to detect if your credentials are invalid — the candidates page even suggests this.
You can repeat this with TURN/TCP and TURN/TLS servers. You can even add all kinds of TURN servers and then use the priority trick we have shown in the last blog post to figure out from which servers you gathered candidates.
If you don’t get anything but host candidates you might be on a network which blocks both UDP traffic and is successful at blocking TURN/TCP and TURN/TLS. One scenario where that might happen currently is if there is a proxy that requires authentication which is not yet supported by Chrome.
Now let us take a step back. When is this useful? In a real-world scenario you will want to run with all kinds of STUN and TURN servers, otherwise you will get high failure rates. If you need to debug a failure to establish a connection, you should look for the onicecandidate and addIceCandidate events. They will allow you to figure out if the local or remote client was on a network that blocked it from establishing a connection to any peer outside the network.
What’s next?
So this time around, we’ve focused on the API traces:
- We’ve acquainted with the fact that this is something that webrtc-internals does us a great service just by capturing all of these WebRTC API calls
- We even went through the typical API calls and flows that are expected to appear in the WebRTC API trace
- We’ve looked at two examples where the WebRTC API trace can help us debug the problems we’re seeing (there are more)
- #1 – misconfiguration of NAT traversal servers
- #2 – network blocking and the forgotten TURN/TCP configuration
We’re not done yet with this series. We still have one or more articles in the pipeline to close the basics of what webrtc-internals got up its sleeves.
If you are interested in keeping up with us, you might want to consider subscribing.
Huge thanks for Fippo in assisting with this series!