
I remember that first time our servers went down after we had a couple of paying customers.
We got a call from a customer once. The only thing he wanted was to use our monitoring service. Since I knew him before, and knew he wasn’t interested in our monitoring – I asked him why.
I got something similar to this answer:
“We have monitoring on everything. We monitor the machine’s CPU, memory, storage. We look at the network. We collect metrics from our apps and monitor these as well. But yesterday we had a downtime of our service and we didn’t know it until a customer complained.”
Which brings me to the point – with WebRTC, it is extremely important to use end-to-end monitoring. It is also extremely important that this monitoring thingy you are putting in place knows a thing or two about WebRTC, otherwise, how will you know if the customer is really getting that video call or just looking at a blank screen?
Great. So now that we know we have a problem what’s the solution?
Luckily (or not?), there’s more than one way to handle monitoring WebRTC services. I like characterizing the solution based on 2 parameters, making for a nice quadrants to visualize it:
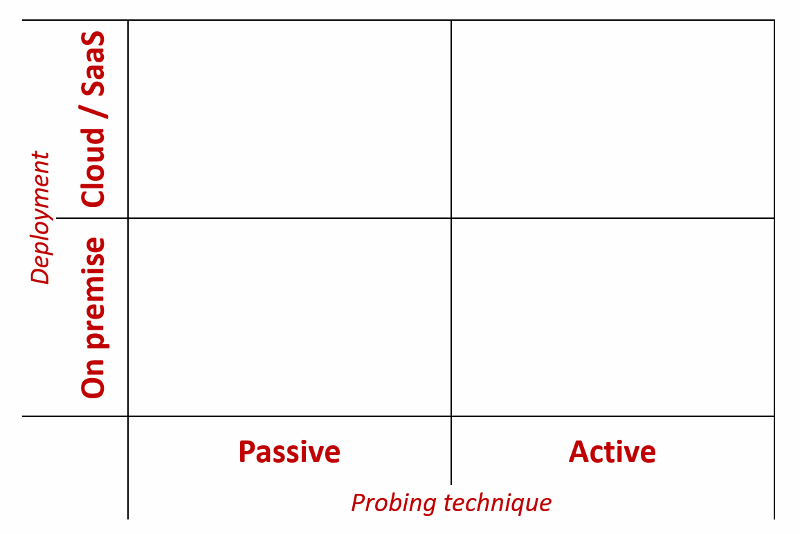
I’ll be using the terms active and passive here to describe the probing technique in a way that might be somewhat confusing to some, but for me this works.
Active monitoring is a system which actively generates traffic in the monitored product, using the generated traffic and the product’s behavior to determine its health.
Passive monitoring is a system which passively collects metrics off the different product components, determining from that the product’s health.
The exact definition/architecture of what is Cloud / SaaS versus what is on premise on premise for me ends up depending on what probing probing technique you refer to – active or passive monitoring. Let’s see how they compare (and along the way explain what cloud and on premise is in each case).

#1 – Active Monitoring (Cloud / SaaS)
Active monitoring is for us the most popular monitoring service that our customers subscribe to.
The way such a monitor works?
- It has a specific scenario it executes
- It runs it at a given frequency
- It validates a certain set of expectations, deciding if there were any failures requiring raising an alert
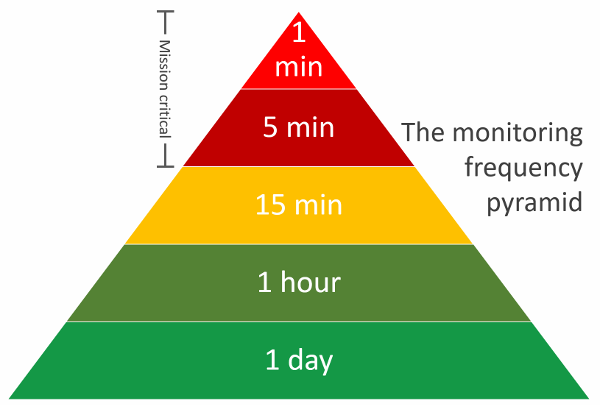
The WebRTC monitoring frequency pyramid above shows the various frequencies such a monitor can employ.
A daily monitor is akin to a ping – a healthcheck placed on a demo system for example; while a 1-minute monitor is mission critical – it is there to find issues and alert about them as soon as possible and before your customers notice them.
The cloud part of the active monitor is about the machines used to run your service. You deploy them in the cloud, probably on a managed monitoring service (we’ve got one for you). It means less setup hassle and also the ability to decide the geographical location of these machines.
Why use active monitoring?
- When your service runs at specific hours of the day. Contact centers for example, or doctor appointments. They tend to have their own “opening hours”, but what happens when the system breaks outside of opening hours? When do you get notified it? When the first customer complains at the beginning of the shift? Or 5 hours earlier when you get an alert from an active monitoring system? In order to get alerts ahead of time here, you need a “non-user” to join the session
- When the failure occurs before WebRTC altogether. Sure you have a great way to monitor calls that happen to interact with the WebRTC APIs. But what if the service failure occurs earlier? Like a connection error between your web server and the directory service? An active monitor that runs end-to-end can find and pinpoint such issues
- Consistency. Passive monitors show the experience of your users. But it can’t reproduce the same settings to show you if and how you improved – and it is devilishly hard to decide if the problem is a user problem or a service problem. An active monitor can be configured to run in very specific network configurations – over and over again. Its results can be compared in certain timeframes to show the objective degradation or improvement of the service
- Zero instrumentation. Nothing needs to change in your service to accommodate for active monitoring. The active probes that will interact with your service accommodate themselves to whatever you are doing today
Not all is rosy here though. To setup a good active monitor you need to plan a use case that fits nicely. One in which the UI of your service is predictable and simple enough to automate. I’ve seen a couple of times instances where monitors failed due to inconsistencies in the UI which caused service failures – things that humans would be comfortable with but automation would not be.
#2 – Active Monitoring (On premise)
An On premise active monitoring solution is similar to a cloud based active monitoring solution with one minor difference: the probes that are used are deployed “on premise” as opposed to “in the cloud”.
What does it mean exactly?
For an education service, where teachers and students can be anywhere, a cloud based approach works great. It actually mimics how the service is used “live”. So having the probes deployed strategically across the globe in different locations makes a lot of sense.
But for a contact center for example, where the agent sits inside the office, you sometimes want to have a monitor on site – a machine dedicated to monitoring also the network constraints that your agents feel – placing the machine within the same subnet on your local LAN.
So, the difference between Cloud and On premise Active Monitoring in WebRTC?
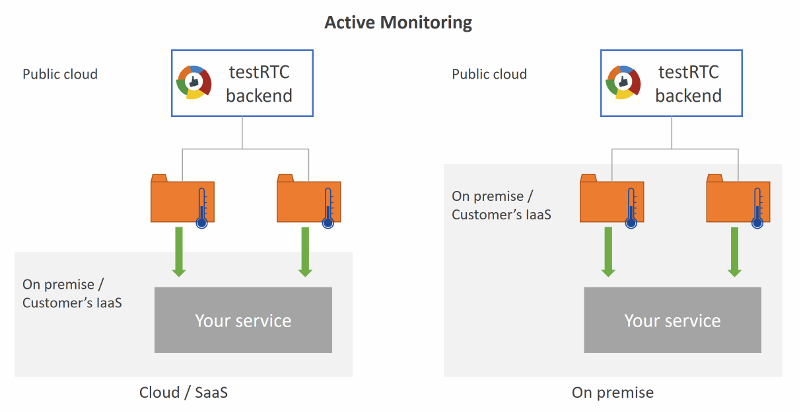
To sum things up – you deploy the probes on premise or in the cloud, but collecting and analysis can happen in both approaches in the cloud. Oh, and obviously, you can also end up deploying some probes on premise and others in the cloud (especially for a call center scenario).
The advantages of the on premise approach is that you get closer to real life scenarios with it for the use cases where you can place your users at a given location.
The main disadvantage is that this is usually a bit more expensive and time consuming to setup and maintain (there’s less of an option to use economies of scale fairy dust for it).
#3 – Passive Monitoring (Cloud / SaaS)
With passive monitoring, there are no real probes. We treat each and every user who interacts with the WebRTC service as a “probe for hire”, available if and when he decides to interact with the service.
In its Cloud variant, the data pulled off from the device gets shipped to the cloud to a third party service who aggregates and analyzes the metrics available in WebRTC (usually by means of getstats calls).
The advantages of this approach is that it gives you the data and analysis on your real user’s interactions. You can’t get any closer to that when it comes to reality. It is also easy to setup and get started with.
There are certain disadvantages though:
- Uptime. There is no indication of uptime here. If no users call the doctor before 8am, then you get no data for the time the system is idle – and no visibility towards its health
- Predictability. A session may experience failures or issues that relate to the user’s device or network. You will definitely want to optimize your service as much as possible for such cases as well, but it will be hard to check for objective trends of the service’ quality in such a way
- Privacy. You send the metrics about your service’ real live traffic to a third party, who can easily discern the size of your operation
- Instrumentation. You need to modify your product’s code to integrate with a passive monitoring solution. This will typically be a minor hindrance, but will be there
#4 – Passive Monitoring (On premise)
In many cases, people end up using homegrown passive monitoring systems.
What they do is collect data off the devices and then aggregate and analyze it in their own backend monitoring system. Terms like Elastic Search and Kibana and Graylog get thrown into the air – or god forbid – Big Data.
The biggest advantage here? You collect, get and analyze exactly what you want to. Oh – and you can also easily enrich that information you collect with your business logic and other metrics unrelated to WebRTC. In many cases, this is the reason I’ve seen vendors foregoing the cloud based passive monitoring approach – the need for enrichment and wider analysis.
The big disadvantage here is probably time and material. Putting such an operation in place can be time consuming and expensive. It requires developers to work on your monitoring infrastructure which no one sees at the end of the day instead of having them focus on your core product’s offering and features.
We’re in the process of running a pilot with an on premise passive monitoring product. If you want to learn more, just contact us.
Which shall it be?
Passive or active. Cloud or on premise.
If you are serious with what you are doing, and want to run it as a business – a viable commercial service – then you will need monitoring.
I urge you not to be happy enough with web based monitoring solutions and also go for an end-to-end type of a monitoring service that understands WebRTC.