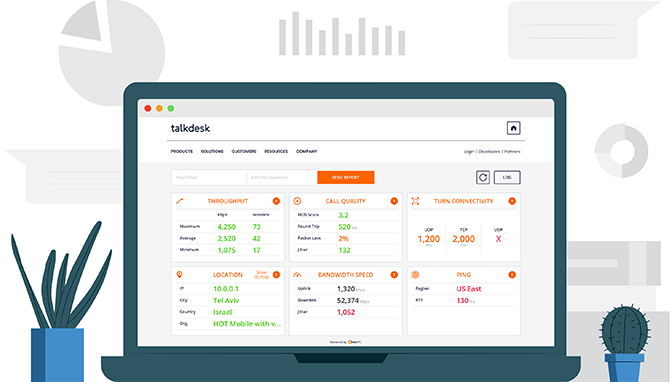
Understand behavior and user experience
watchRTC collects, monitors and analyzes real user traffic and metrics enabling you to troubleshoot and optimize your infrastructure.

Works out of the box with your favorite WebRTC frameworks:


What do you really know about the user experience you are offering your users?
Would you like to have a detailed view of each and every session at the tip of your hand?
How fast from the time you ask a question about your deployment until you find an answer?
Can you tell what is the top priority for you to improve in your WebRTC infrastructure?
When running and maintaining a WebRTC infrastructure there are a lot of questions you will need answered. Many of them aren’t going to be addressed simply by looking at machine metrics or even server side application metrics.
You can go about developing all of that monitoring infrastructure on your own, but that would be an ongoing continuous project. One that would take you off your real focus, which is providing a great service to your users.
How about using a tool that can easily integrate with your WebRTC infrastructure that collects, analyzes and visualizes how your users behave and feel with your WebRTC application?
Introducing: watchRTC - a WebRTC passive monitoring solution
watchRTC is a passive monitoring tool for WebRTC that integrates with your client side applications. It automatically collects all relevant application metric data related to WebRTC and your user’s quality of experience, making it available to you for further analysis.
watchRTC is a part of a comprehensive suite of quality assurance solutions. testRTC enables testing, monitoring and supporting WebRTC based applications and services.
The best thing? watchRTC offers you a detailed drill down to the minute details of each session while at the same time providing a bird’s eye view of your service. And all that in a super fast, visual and interactive user interface.
“
watchRTC makes troubleshooting and managing application performance extremely easy. A must have tool if you are deploying applications using WebRTC
Sameer Maini
CEO and Founder
“
When launching Beacon, a next generation audio video communication platform, we turned to watchRTC to track realtime call performance, investigate past connectivity issues and tune parameters, so we can provide our users consistently high video quality and unparalleled 3D audio experience.
Teodor Atroshenko
SVP of Technology
Quickly identify and solve issues in your WebRTC infrastructure

Gain visibility
Understand and track user and infrastructure behavior over time, gaining insights on how your service is being utilized and where your bottlenecks are.

Improve productivity
Use the data to optimize your service where it matters the most and track the change in quality and user satisfaction.

Increase quality
By gaining visibility and understanding your important bottlenecks you will be able to focus your work towards increasing the quality of experience for your users.
What can watchRTC do for you?
Try out watchRTC today
It takes ~10 minutes to setup and configure watchRTC for any WebRTC implementation.

It usually takes a few minutes to get you started. Sometimes a wee bit longer.
After a day or two you should be all set collecting metrics and looking at important trends in your WebRTC application.
No.
watchRTC operates by collecting data directly from the end user devices. For that, you will need to integrate our SDK into your client-side code but there’s nothing you need to do on your servers to make it work.
Yes.
You control which of the users run our SDK, which means you can decide to collect partial data. Maybe focusing on a specific customer of yours, a deployment or even a media server.
Yes.
watchRTC collects the data and makes all the analysis for you. Sometimes, our clients want to enrich that data further or run their own algorithms on it. We enable that using a specialized data stream capability, so you can get near-real-time access yourself.
Yes, as well as many other solutions.
watchRTC has been designed to work with any WebRTC infrastructure - we are agnostic to what media servers or signaling mechanisms you are using, be it your own proprietary mechanism, a popular open source or a CPaaS SDK.
Pricing is based on minutes use.
Let’s talk and see how we can work together.
SEE HOW testRTC CAN HELP YOUR BUSINESS
Want to learn more about testRTC and what we do?
Address: 68 Kaplan st, Qiryat Ono, 5529368, Isreal
Phone: +972-3-721-9301
Email: [email protected]


