Note that rtcEvent() now expects 2 parameters at all times.
Up until recently, if you passed a single parameter, rtcEvent() assumed a “global” event type. A decision was made to make the event type explicit and not assume anything for the user.
If you are using the rtcEvent() function, please be sure to check if you need to update your test script accordingly.
Analysis
When the incoming RTT metric is reported on RTCP, we now collect, analyze and display it on charts
Additions to the event log:
We now provide the track label (=device) when logging addTrack, addTransceiver and replaceTrack events
Added track.onended event to log the track state. The event log will display both live/ended track state as per context
Added log for muted property on track along with event listeners for unmute/mute events
qualityRTC & probeRTC
We’ve added a popup telling the user to allow access to the microphone (and camera where applicable) if we understand that the browser will make sure a request
TURN CONNECTIVITY and VIDEO P2P test widgets can now run silently and log the information without showing the widget itself
DEVICE STATE test widget will now also show the media path (region) the call used, where applicable
Video related tests now also report in the logs frames per second and quality limitation metrics
In probeRTC, you can now provide an end date. Once reached, the probe will become inactive automatically
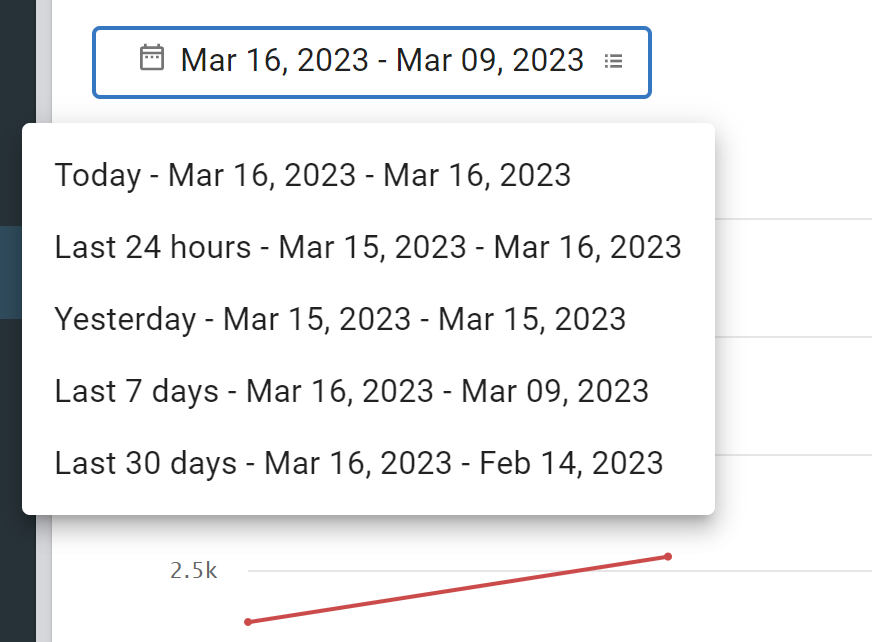
probeRTC now has a flexible date picker to choose viewing range
watchRTC
Dashboard
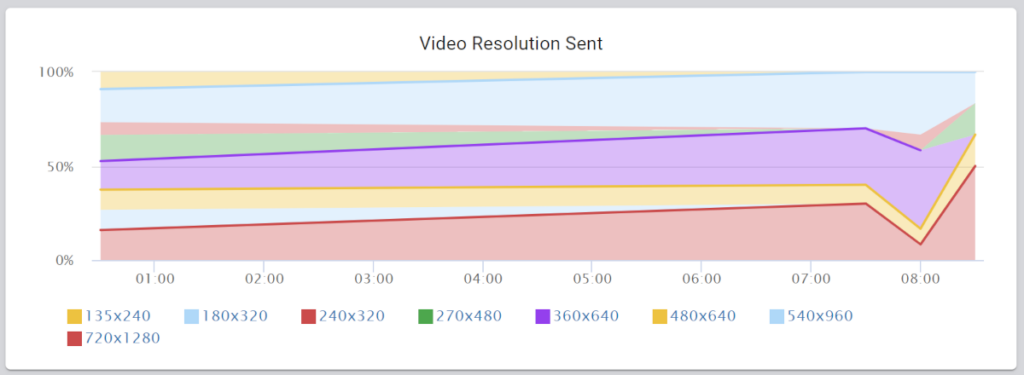
We have new video resolution graphs. These will indicate which send/rect resolutions are most “popular” and used in your application:
Persistent connections
We’ve added support for persistent connections.
If you are running a contact center, you might be using such a feature where a single WebRTC peer connection is used to connect the agent to the server, and then all calls flow through that connection.
In order to distinguish between these calls in watchRTC, you can now use new SDK APIs to tell watchRTC where to start and stop your calls – since they are now application specific and don’t show in WebRTC traffic.
mapStream() is now deprecated, replaced with mapTrack()
We’ve introduced an onstatechange callback to JavaScript SDK. This will enable the application to know and understand when the SDK is connected or disconnected from the watchRTC server
For our iOS SDK, we’ve removed all external dependencies and shrunk the binary size considerably
Here and there
Data streams in watchRTC now include MOS, score values on the receive and send stream levels and not only at the peer level. We’ve also added audio and video device values on the peer level
Some contact centers use the same WebRTC peer connection for multiple calls. This is done in order to reduce the call setup time by having the connection persist. It makes sense when call center agents are “on the phone” most of the day. This feature is sometimes called nail up call or persistent connection.
If you are using such a thing, you can use the persistentStart() and persistentEnd() APIs in our JS SDK. By using them, you can instruct watchRTC to start a new logical call or to stop a logical call within a longstanding peer connection.
These separate logical calls will be treated by watchRTC as separate rooms for all analysis purposes.
This feature can also be used when you are conducting hours long or endless sessions and you wish to be able to analyze them. By using these APIs, you can split them up into smaller chunks of an hour for example.
Running a test script in testingRTC (or upRTC) means that one or more virtual machines are allocated for your WebRTC test script to execute. Using these virtual machines is costly, so there is a need to make sure that they are only used when they are really needed.
The powerful capabilities in test scripts means that you can reach places where the test logic itself is recursive, reaches endless loops or just hangs on a pause or waitfor command for an indefinite amount of time.
Because of this, testRTC includes a built-in timeout mechanism which will kill any running test script after a configurable amount of time. This process will release the machines, counting the minutes towards your used balance. Due to the nature of this process, minimal log information will be collected in such cases.
testingRTC uses a default timeout is a maximum of 5 minutes.
If you are planning on running larger tests, you will need to increase that value. For that, you can use the #timeout run option, keeping the following rule of thumb in mind:
The #timeout value you provide should take into account test time, additional slack
Test time – the time required for your test to run from beginning to end. this should include any additional activities such as logging in, filling out forms, waiting for additional users, etc. So if you want to test calls that are 5 minutes long, add at least 2 more minutes to cover that part of your test session
Additional slack – testRTC takes its own time on teardown of the test in the end. This is used to collect and upload all logging information and screenshots, analyze results, etc. You should add this to your calculations of timeout as well. For small tests, this is usually a minute or so at most. For larger tests in can take longer. So be sure to also check our timeout configuration suggestions on WebRTC stress testing best practices
You get charged only on minutes used. Even if the timeout is a lot longer
Think of the timeout parameter as a way to stop tests that get into an endless loop. It is there to “save” you from wasting minutes for nothing useful
If you integrate directly with the Amazon Connect API , then you need to take the following steps in order for watchRTC to be able to capture the WebRTC metrics in Amazon Connect sessions.
In order to collect metrics from that iframe, you will need to modify the initial configuration of the Amazon Connect Streams API a bit
Integration steps
Step 1: Create the sample application and include watchRTC in it
For the purpose of this explanation, we will be using the Amazon Connect React sample application. You can apply a similar approach to your own application.
Start by creating the sample:
npx create-react-app amazon-wrtcsdk-intergraion
cd amazon-wrtcsdk-intergraion
Add the Amazon dependency to the package.json:
yarn add amazon-connect-streams
Add our watchRTC SDK dependency to the package.json:
When initializing Amazon CCP, we need to make sure watchRTC gets called properly. For that purpose, we follow Amazon Connect Streams PI instructions to initialize CCP. JavaScript example:
To allow watchRTC to access and collect the WebRTC metrics it needs, we will need to disallow the framed softphone feature and then add it once the manager gets initialized.
First things first here – make sure to have the softphone parameter (within the second parameter of connect.core.initCCP()) with
This allows your page to handle softphone calls with the connect-rtc.js loaded by your web page. allowFramedSoftphone : true is necessary if your page also lives in a frame, otherwise, you can remove this parameter.
Step 5: Initialize watchRTC
Now that we explicitly create the softphone manager, it is time to make sure that once it initializes it also initializes watchRTC. For that purpose, add the following code into subscribeToAgentEvents():
The summer is now behind us and it is time to introduce our latest release of testRTC 🥳
Besides the usual slew of features and improvements, we focused on two big areas:
More powerful performance testing and monitoring – there is now a new performance dashboard. More on that below
Simplified UI with more information – our endless pursuit of the best visualization in the industry. This time with traffic lights, tooltips, maps, shortcuts and more data
Read on below for the full list of changes – there are definitely a thing or two (at the very least) that you will find useful.
Unrelated, or semi-related – from this release and on, API keys can only be regenerated by Account Admin users.
Chrome 107
Google decided with no real warning to change the way getStats() returns its objects, changing all identifiers. This breaks most of the analysis tools we’ve seen (and has broken our analysis as well).
In this release we’ve invested heavily (and urgently) in making sure our getStats() code logic is capable of working with both the “old” stats and the “new” stats and other browsers’ stats.
Not to be left behind, Chrome 108 and 109 are bringing with them more getStats() changes and we’ve been updating our analysis to take them into account as well.
Performance Dashboard
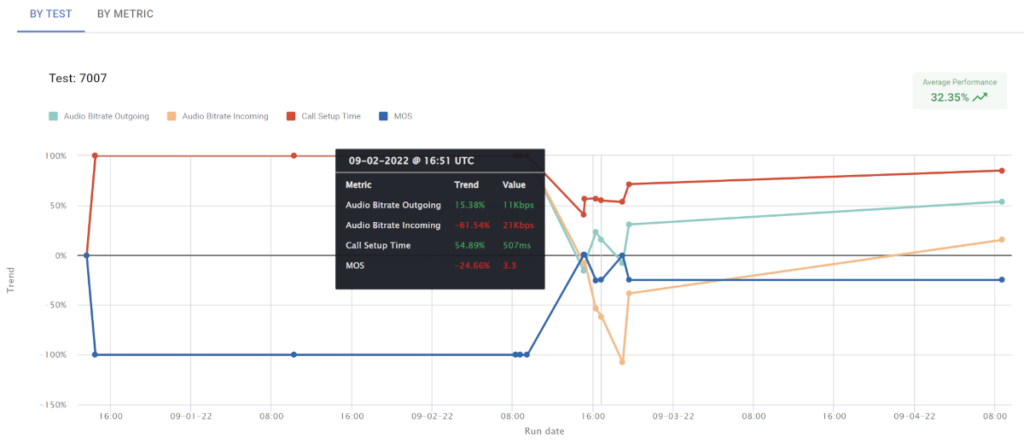
Have you worked on optimizing the media quality of your service? Or wanted to know over time if things are improving or degrading? Now you can easily do this using testingRTC and upRTC.
How does this work? You select the tests (or monitor), pick the metrics you are interested in, and testRTC will do the rest.
The Performance Dashboard looks at the oldest test result, placing that as the baseline and from there calculates the trend for the metrics you’ve picked to look at.
You can view up to 5 different test scripts and 5 different metrics at the same time.
Check it out and let us know if you found it useful.
Analysis
A lot of work is going lately into improving the analysis we do. Here’s what we’ve introduced in this round:
Weighted analysis based on timing
We’ve spent a ton of time in this release working on how we calculate each and every individual value we show the user on practically every level of our test and monitoring results.
The main change we’ve done is to make sure each metric on a channel or probe/peer gets its fair share when averaged up with other channels or probes/rooms. This means for example, that the shorter the channels versus other channels in a probe, the less weight it will have on the calculated result of its metrics for the probe.
This gives more accurate results across the board and makes it easier for you to analyze edge case results.
Score calculation
testRTC has two separate quality scores for results: Score and MOS
MOS is for audio and Score takes into account video as well.
Since different applications handle video differently, the weight they give to different media aspects tend to be different from other applications as well.
What we’ve done in this round of changes, was polish our score calculation:
Score will be 0 if there are no media streams at all for the given probe/peer
We calculate and show MOS and Score per individual channel
When calculating the total score of a probe/peer, we can now configure the weight per channel type (incoming/outgoing, audio/video) individually to fit the use case
And yes, Score now also adheres to the weighted average calculations we are doing everywhere
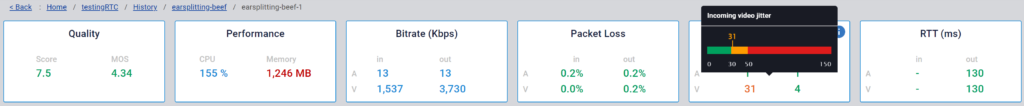
Ribbons and traffic lights
There’s a new traffic lights coloring scheme for ribbon information across testRTC. That includes anywhere where we show high level information at the top of a page.
You already know what I mean – right? 🟢🟡🔴
Green is good. Yellow/orange not so. Red you should check out.
Notice the nice new tooltip that also explains where within the range your value falls?
As we can’t know your exact use case, the thresholds we use can be reconfigured if needed – just reach out to us.
On probe/peer level
The new Trace window has been polished with a modern design, making it a lot easier to read and navigate
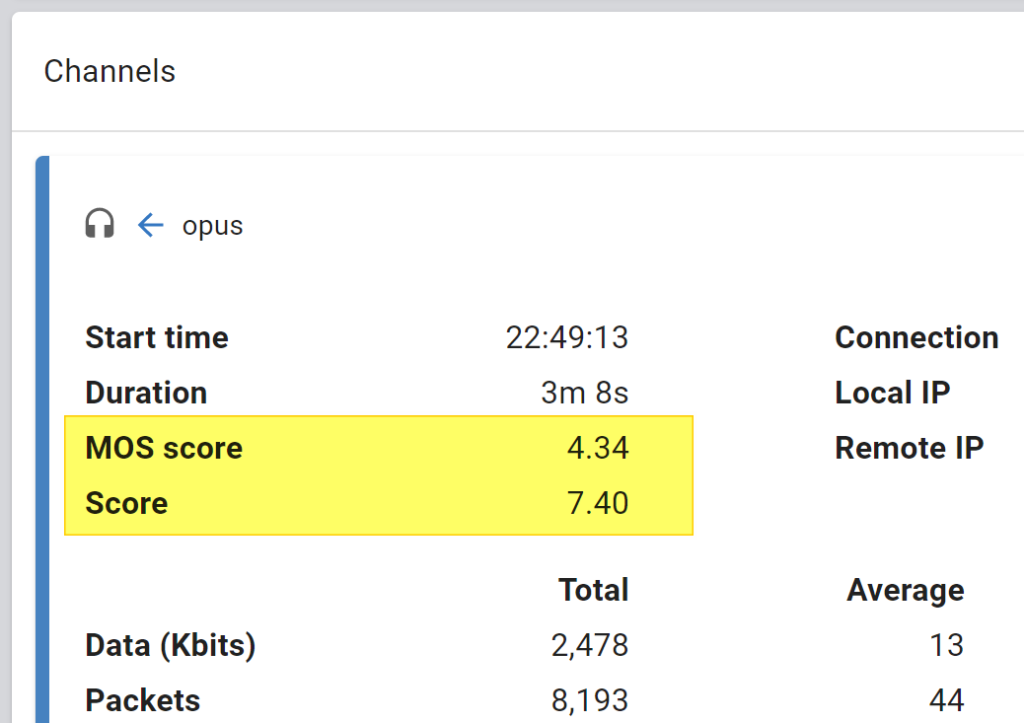
Audio channels now show their individual calculated MOS score:
In Advanced WebRTC Analytics
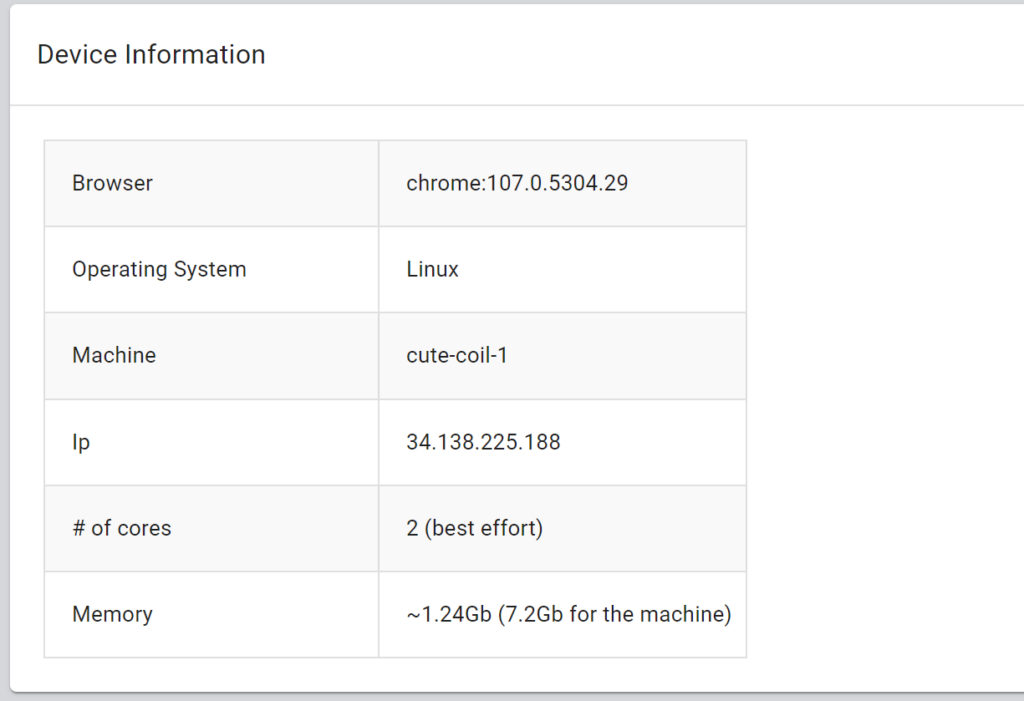
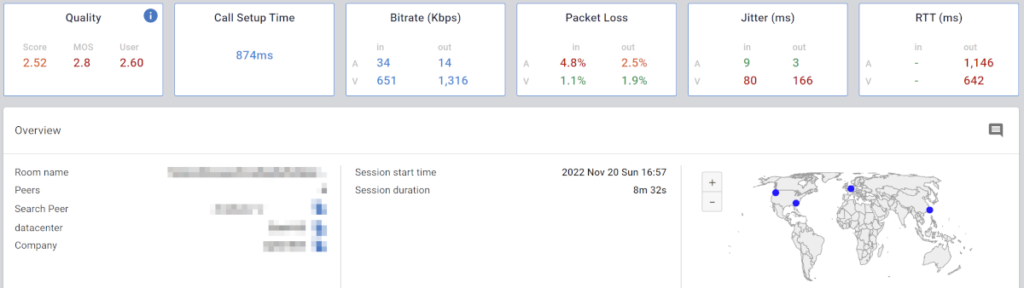
For testingRTC and upRTC, some of our customers ask about the machines we’re using and their available resources. To make this easier to understand, we’ve added it to the top of the Advanced WebRTC Analytics page:
Start time and duration of peer connections are now prominently displayed
The page has been “shortened” hiding areas you’re unlikely to need
State machines now only show the first few states, allowing to see more if needed
ICE candidate pairs table now shows only the first few candidates, allowing to see more if needed
Events log now shows only the first few events, allowing to see more if needed
testingRTC & upRTC
We’ve upgraded to Nightwatch v2.4.2, so we’re now running on the latest stable version
Performance dashboard. That new feature explained above? Here’s where to find it
In testingRTC, just go to testingRTC | Performance in the sidebar. Pick the tests and metrics you want to analyze and you’re good to go. The URL of the page will preserve your selection, so you can share it with others
In upRTC, just go to the monitor’s configuration. Below the scheduling section, a performance dashboard will appear. You just need to select the metrics you are interested in
Trace window is now available for testingRTC and upRTC results on the probe level view
qualityRTC
Deeper integrations
For those who are embedding the qualityRTC network testing user-facing page, we’ve added a few new capabilities to make this even more customizable:
A PDF of the generated results can be attached to an email sent back to you. This is useful when creating automated tickets in your support system based on these emails. You can learn more about this in our email integration article
If needed, we can now configure a rotating message during the running test to appear in the popup window
Another improvement we’ve made is that now qualityRTC tries to figure out if different IP addresses are used for media and signaling and indicates that in the LOCATION test result.
Bulk export
Both qualityRTC and probeRTC support data streams.
We’ve introduced Data Streams as a feature in our last release. This capability allows our clients to export the data stored in testRTC using JSON files and cloud storage (AWS S3 for now). Our first release of this feature was for watchRTC. In this release, we are bringing data streams to qualityRTC and probeRTC.
Any tests conducted using qualityRTC and probeRTC can now be collected as a data stream of files.
watchRTC
More insights
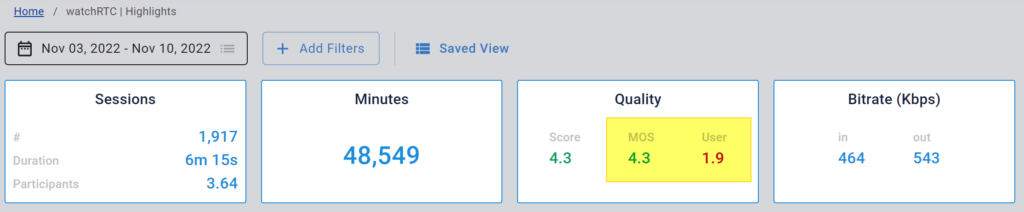
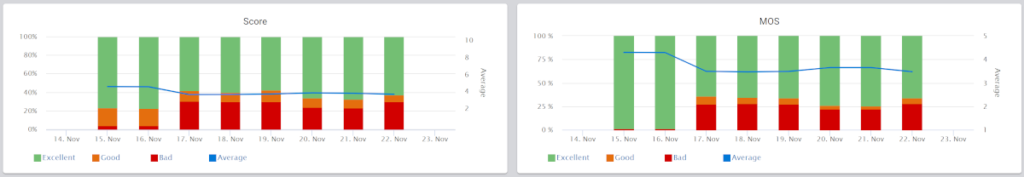
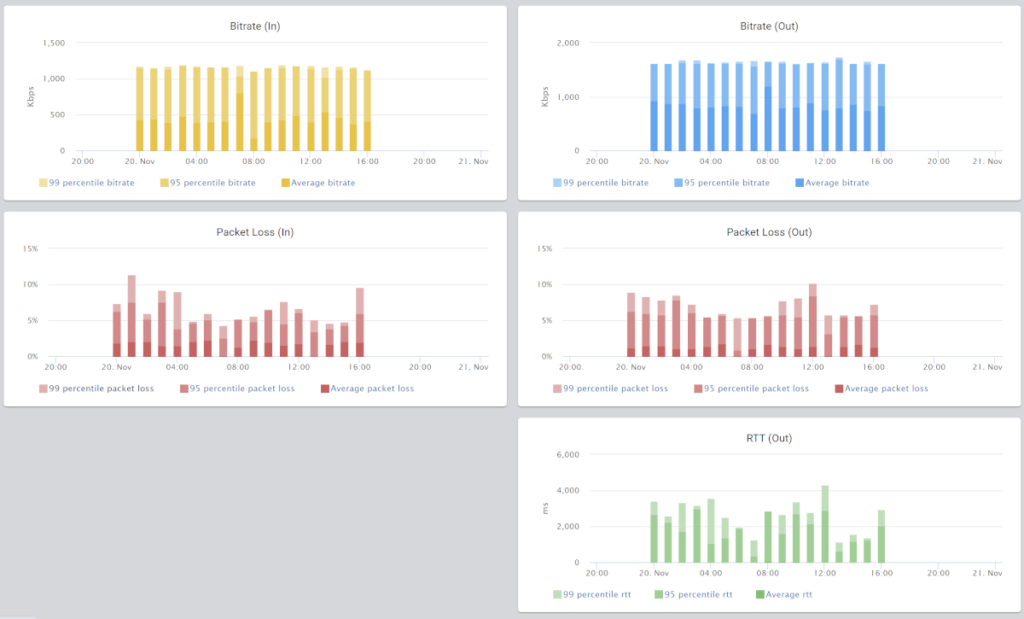
Highlights now show MOS and user ratings and not only Score.
The Trends view now also includes MOS and Score graphs.
We’ve also split packet loss and RTT graphs into two separate ones – for incoming and outgoing metric values:
Location, location, location
We heard you. You wanted more access to the location information. That of the users as well as the media servers they’re interacting with. So we sprinkled the UI with that information and made it more accessible in many ways.
The room and peer level views now have maps on them, pinpointing the locations of the users and the media servers.
The ISP has been added also to the peer level view as well as added to the data streams exported data.
SDK
We’re introducing a new beta feature: The SDK now exposes the metrics it collects to the application locally. You could get this information directly from WebRTC, but there are times when doing it through the watchRTC SDK is just… better:
If you are using a third party CPaaS and its SDK doesn’t give you direct access to this data
When you are using more than a single CPaaS vendor and would like to keep this part of your application clean of its APIs, so as not to hold multiple unaligned versions
We now have Android and iOS SDKs available in beta. Reach out to our support team to learn more about these
Here and there
Data streams in watchRTC now include ISP information, end time, audio and video metric total averages
You can now mark as read/unread all notifications
Added the ability to make log message of the watchRTC more verbose via a URL parameter (see here)
In some cases, you will want to embed the qualityRTC frontend inside your own web application. This is a powerful capability that gives you greater control over the user experience, letting you stitch the network test step inside your own application’s workflow.
qualityRTC offers several tools that you can use to reach this goal:
Use ?embedded=true in the URL and wrap the page as an iframe in your own web page
This way, you can place the page wherever you want in your web application
To use it, be sure to contact our support since it requires us to reduce some of the privacy protections we have be default on qualityRTC pages
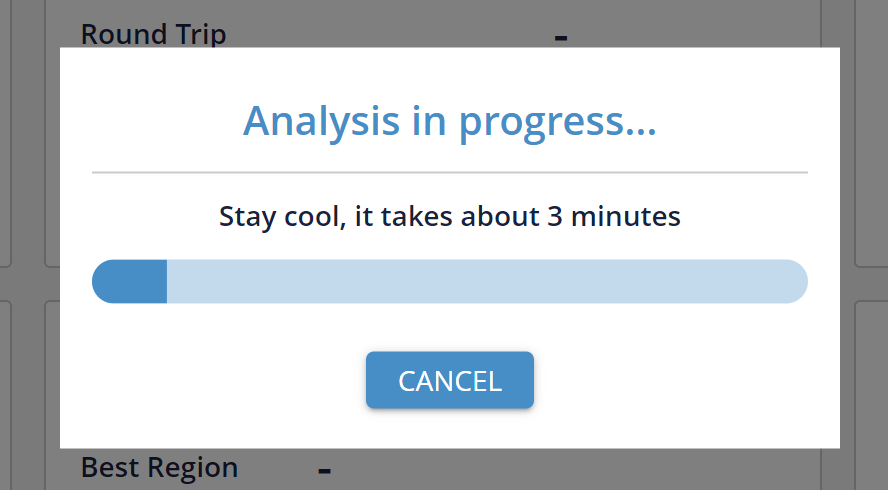
You will be left with our popup progress bar for the test
The purpose of this is to allow you to display whatever data and UI you’d like to your end user
Use ?returnurl=url to go to your own page after the test completes
If you want to show only partial result, or not show the result at all, or simply move forward at the end of the network test – you can use this feature
This way, you can move forward in your workflow automatically
This is best used in conjunction to GET /qualityrtc/result/{testid} to collect the result of the test and decide what data of it to display to your user
hen conducting a qualityRTC test, a popup message appears:
From time to time, our clients are looking to change the content of the message there.
There are two customization alternatives we offer here:
Change the content of the popup to your own custom message
Rotate between 2 or more text messages. In this case, the messages will appear for around 10 seconds each before switching to the next one in the rotation
If you’d like to have the message changed, contact support.
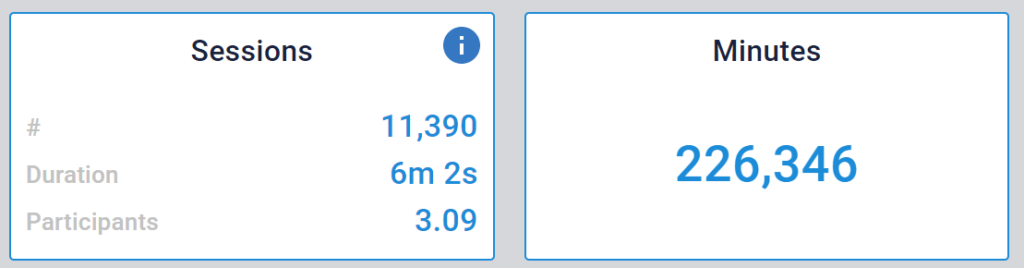
The Sessions block at the top ribbon of watchRTC Highlights gives you the gist on your account’s activity:
The Sessions and Minutes values adhere to the filters selected on the Highlights page, enabling you to slice and dice the data in various different segments.
Here’s what this information means:
# – the total number of sessions conducted based on the filtering criteria
Minutes – the total number of minutes collected and analyzed by watchRTC based on the filtering criteria
Duration – the average duration of a session in the filtering criteria
Participants – the average number of participants in the filtering criteria
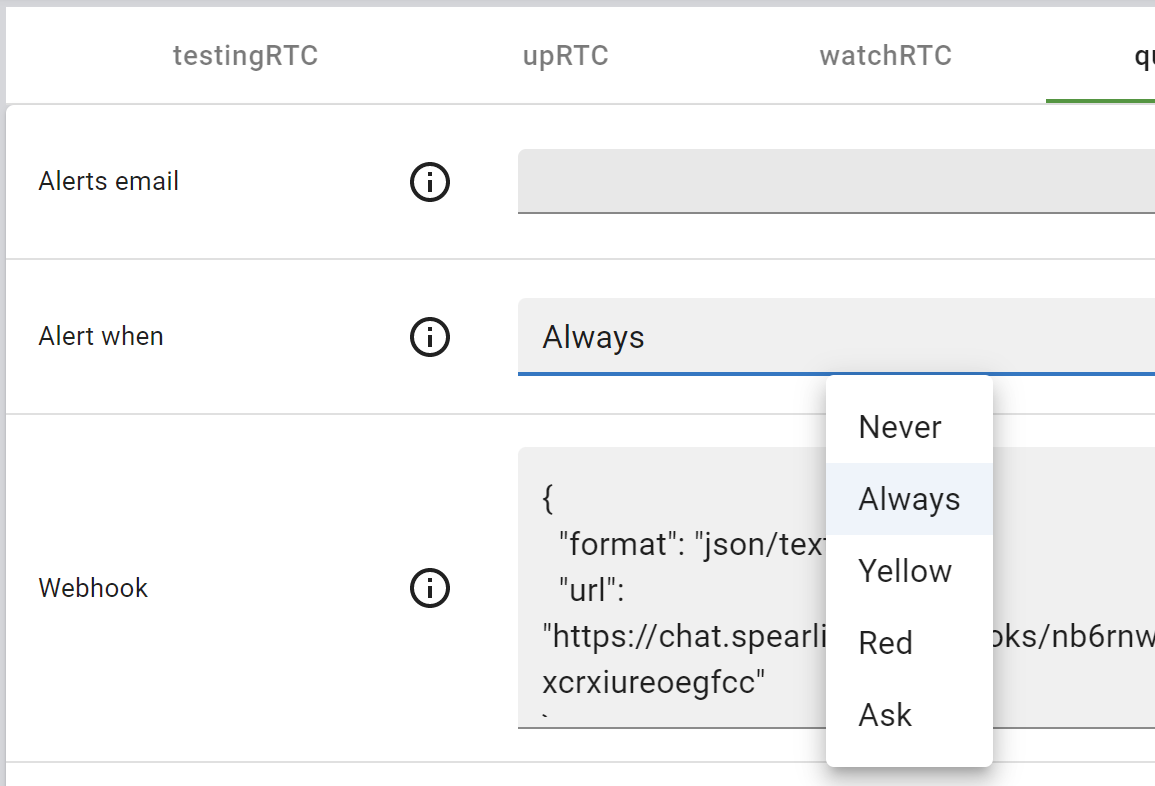
Whenever a test is conducted by a user in qualityRTC, we collect the results and analyze them. Once done, we assign a total result indication to it: 🔴 failed; 🟡 borderline; 🟢 good
You can decide to receive such results via an email to your support team or even your ticketing service. If you go to the Settings in the sidebar and select qualityRTC, you will be able to make these decisions:
Note that choosing when to alert can be either based on the results (only when failed – Red; only if borderline or failed – Yellow; Always or Never). And you can also have the user decide if he wants to report the results or not by setting the “Alert when” field to Ask.
The alert email received will include a link to the test result itself.
If needed, the email can also include a PDF attachment with the result itself, and the PDF can be configured to include the detailed logs in it if needed. If you want the PDF to be included in the email, contact our support.
Daily is a CPaaS vendor focusing on faster time to market with a mixture of APIs and Prebuilt (lowcode/nocode) solutions.
If you are using Daily, then your best starting point for testRTC testing scripts for Daily WebRTC applications would be to use the samples created by Daily directly.