All Posts by Tsahi Levent-Levi

Console logs in watchRTC

The watchRTC SDK can also collect browser console logs. While these might be verbose, they can be quite useful to trace and resolve application related issues.

The ability to collect console logs in watchRTC is dependent on the specific plan you are on.

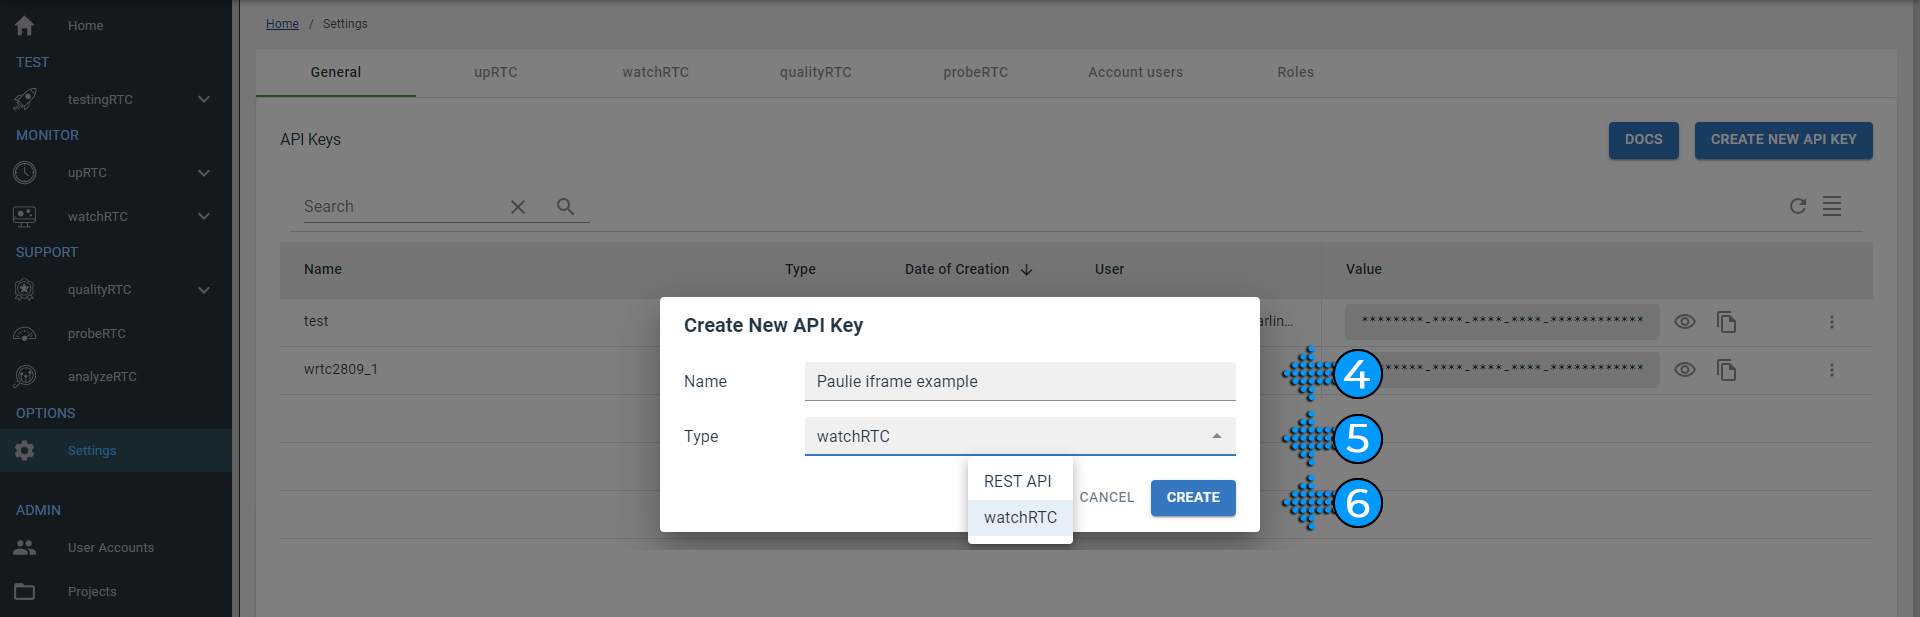
Configuring console logs collection

Since browser console logs can be quite verbose, collecting them all can affect your application performance by taking up much of the available bandwidth that is better used for the actual voice or video sessions you are conducting over WebRTC.

This is why the watchRTC SDK will filter console log messages based on their level.

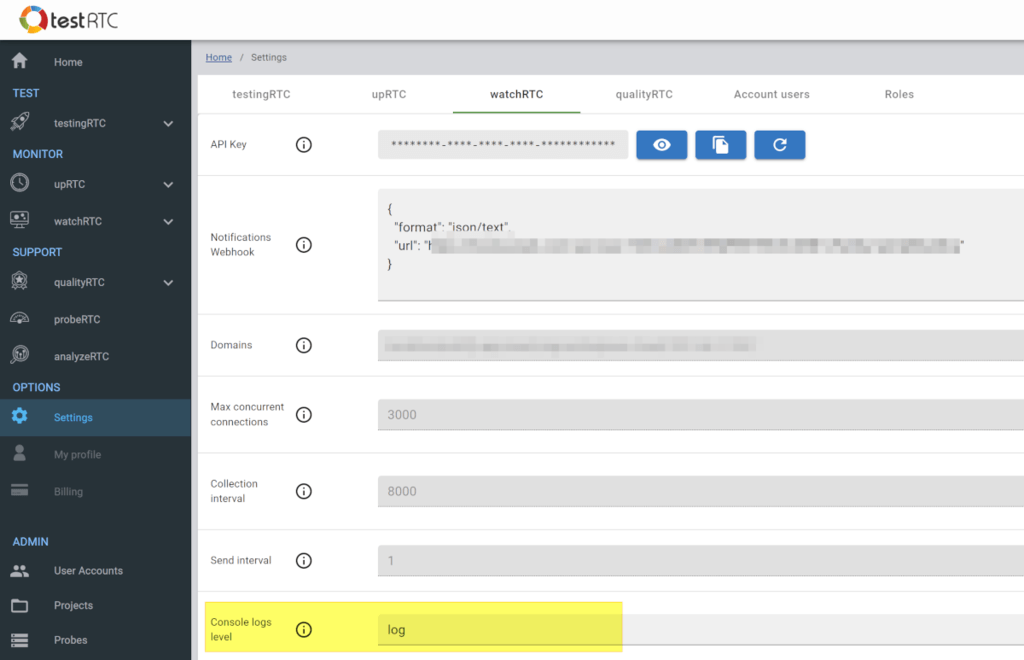
On Settings | watchRTC you can define Console logs level to “log”, “debug”, “info”, “warn” or “error”. Keep it at “warn” or “error” at all times is our suggestion.

Notes:

  • In the example above, we decided to collect log level messages because we were keen in figuring out a bug and catching it in our staging environment, not deploying it to the production system
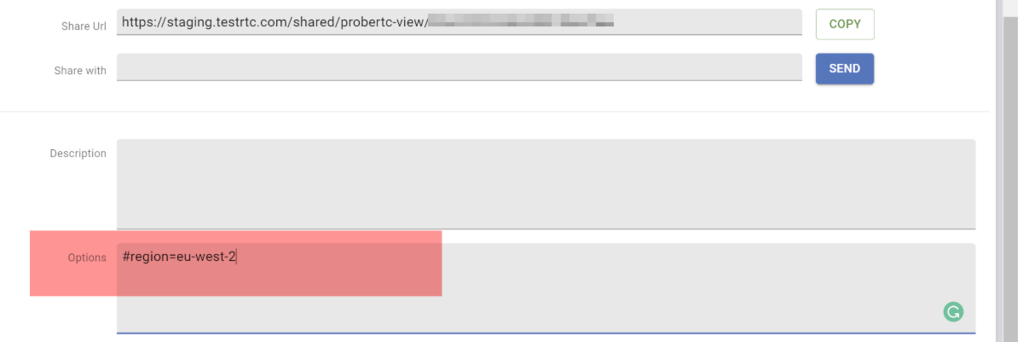
  • The configuration specified here will be used by default for collecting console logs in the watchRTC SDK. You can override this for individual peers if needed
  • If this field is disabled in your account then your watchRTC plan does not include console logs collection

Granular control of console log collection in the SDK

On the watchRTC SDK level, you can granularly decide to override the default collection configuration of browser console logs per peer as well as dynamically during a session.

To do that, you can use the watchrtc.init() or watchrtc.setConfig() API calls in the watchRTC SDK, providing them a console parameter:

watchRTC.setConfig({
  console: { level: "error", override: true }
});
Code language: JavaScript (javascript)

The above example will set the log level to “error”, overriding the configuration of the account.

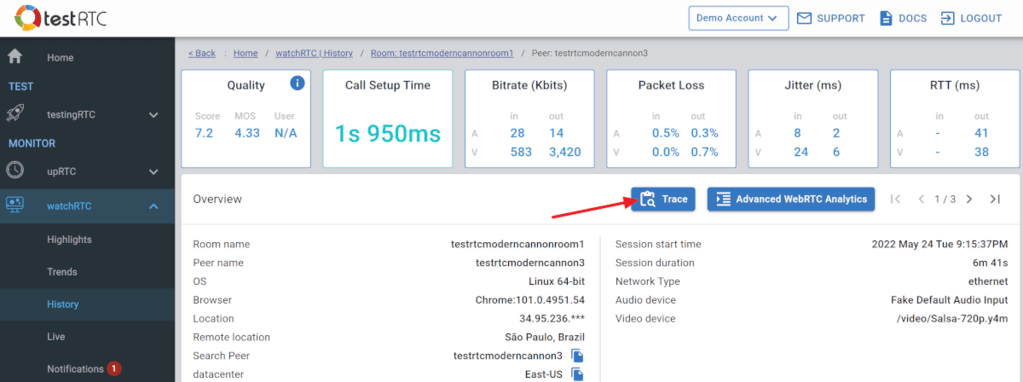
Viewing console logs

Console logs collected can be viewed as part of the Trace window of the peer level page:

probeRTC options

probeRTC is meant to run on its own with little assistance from the user. From time to time, there is a need to modify its behavior, especially when further troubleshooting is required.

This is enabled via URL parameters when running a probe or via the options in the probe editor:

Supported options

All variables are optional. You are not mandated to add any of them to the URL.

VariableDescription
region=XIf the deployment of your infrastructure includes multiple data centers, then you can specify the specific data center to work in front by using the region= option

Connecting to watchRTC

The watchRTC SDK automatically connects to the watchRTC servers when a peer connection is created in your web application. Sometimes, application developers would rather connect earlier than that. This has the added benefit of:

  1. Collecting failures taking place prior to the creation of a peer connection
  2. Catching and logging fast failures that close the page, refresh or retry the connection before a peer connection get fully connected

This is doubly true for cases where custom events and console logs are added and collected prior to a peer connection’s creation.

To that end, you can use watchRTC.connect() API call to explicitly tell the watchRTC SDK to connect to the server. If you make use of the connect() API, you will also need to explicitly call watchRTC.disconnect() when you are done with the sessions (note that without calling connect, the watchRTC SDK will automatically disconnect once all peer connections are closed).

WebRTC test scoring

testRTC collects and analyzes a lot of different data points and metrics. To manage that information, testRTC also offers various scoring values for tests and collected monitors data. When opening test results or monitor information, you can find the score values at the top ribbon bar of the results:

If you are using testingRTC or upRTC, then this information block includes Score and MOS. For watchRTC this information block includes also User.

Score

The Score value is a number between 0-10 giving the overall scoring of the scenario.

It looks at both audio and video, across all channels, penalizing them from a score of 10 based on the media metrics values as well as the variance of these values over time.

It is an objective score that is mainly useful for baselining service performance. Deciphering if a score value is good or bad is left to the judgement of the testRTC user based on his understanding and experience with his own application.

Learn more about test scoring in testingRTC.

MOS

MOS score stands for Mean Opinion Score. It looks only at the audio channels in a scenario. It is a widely used metric.

MOS is a value between 1-5 indicating a subjective quality measurement.

MOS scorePerceived quality
Above 3Good
2-3Mediocre
Below 2Bad

testRTC derives its MOS score calculations indirectly from RTCP reports that are exposed in WebRTC via the getStats() APIs. We rely on jitter, packet loss, round trip time and codec type to calculate it (we figure out the R-factor and from there derive the MOS score value).

User

User scoring is available in watchRTC. It enables developers to collect user rating and store them in watchRTC directly.

You can use the watchRTC SDK‘s watchRTC.setUserRating() API to report user rating information.

Quality of a scenario

When more than a single user or device is part of the scenario, the scoring information of the whole scenario is calculated as the average score across the relevant devices.

  • Average score relates to Score, MOS and User values
  • Relevant devices are all the devices in the scenario that have that score value. For example, if a single User in a meeting of 10 participants provided a user rating, then his rating will be the User rating given to the whole scenario

rtcSetEventsExpectation()

This is a variation of .rtcSetTestExpectation() that works between given events created using .rtcEvent().

Indicate expected outcome for the specific probe execution between two application defined events. This is used to decide if a test has successfully passed or failed.

The condition is evaluated at the end of the test, based on collected information and metrics. The command can be placed anywhere in the script and can appear multiple times with different constraint values.

testRTC offers additional assertion and expectation commands.

Arguments

NameTypeDescription
criteriastringThe criteria to test. See below for the available options
start-eventstringThe starting point in time for the evaluation. Events are creating using rtcEvent()
Learn more about event based test expectations
end-eventstringThe ending point in time for the evaluation. Events are created using rtcEvent()
Learn more about event based test expectations
messagestringMessage to invoke if criteria isn’t met
levelstringLevel of expectation:
  • “error” – error occurred – fail the test
  • “warning” – consider this as a warning
  • Default value: error

Criteria

A criteria is comprised of the metric to test, an operator and a value.

For example: “video.in > 0” will evaluate that the number of incoming video channels is greater than 0.

Operators

The available operators for the criteria are:

  • ==
  • >
  • <
  • >=
  • <=
  • !=

Complex expectations

You can also use the boolean operators and or or to build more complex expectations.

An example of using it is when you want to check for a certain threshold only on some of the channels. Assume for example that you have any incoming channels, but some of them are muted so they have no data flowing on them. But you still want to test for frame rate. Here’s how you can now do that:

client.rtcSetEventsExpectation("video.in.channel.bitrate == 0 or video.in.channel.fps > 0");Code language: JavaScript (javascript)

Criteria metrics

The criteria is defined as a chained definition of the object we wish to evaluate, and depends on the metric type we wish to access.

The detailed list of available criteria metrics are found in the description of .rtcSetTestExpetaction().

Example

In the example below, the expectations check for the audio bitrate between two events created using .rtcEvent() in the test script. These events are called ‘Limit Network’ and ‘Stop Limit’.

 // The below expectation is based on the events used to check network configuration
 client
     .rtcSetEventsExpectation("audio.in.bitrate >= 15", 'Limit Network', 'Stop Limit', "audio bitrate too low", 'error')
     .rtcSetEventsExpectation("audio.out.bitrate >= 15", 'Limit Network', 'Stop Limit', "audio bitrate too low", 'error')
;Code language: JavaScript (javascript)

DEVICE STATE: What we measure

The Device State Widget shows information collected by other tests, placing it all in a conveniente location:

Data we collect and share

AudioIndicates if an audio device (microphone) was allowed access to
DeviceProvides the name of the audio device used by default on the machine (and the one used during the test)
NetworkIndicates what network type the browser thinks it is using. This is a best-effort parameter, available only on some browsers

Things to notice

Make sure that access to the audio device is allowed.

Check that the device name provided makes sense. You’ll be able to notice here use of remote desktop type solutions (VDI) or bluetooth devices for example.

If your user is using wifi as his network, it might be worthwhile checking his jitter values and pointing out he might be too far from the access point if his network seems somewhat “flaky”.

DEVICE STATE widget

The Device State Widget collects useful device information that can be found in the logs and puts it front and center on the results page.

The information provided in the example above focuses on the audio device – the ability to access it, its name, the network used, and the region from which the call was connected.

Estimated run time: 1 second or less


Customization

During onboarding, we can customize which fields are shown to your needs. The most common fields requested here are;

  • Audio: Indicates if an audio device (microphone) was allowed access to.
  • Device: Provides the name of the audio device used by default on the machine (and the one used during the test).
  • Network: Indicates what network type the browser thinks it is using.
  • Media Path: Indicates the region from which the call was connected.

Tip! There are many more fields which you as the customer may find useful to be presented here. If you know of a metric related to your testing that you would like to be shown here, please let us know and we will work towards having that added for you.


When to use?

The Device State Widget can be used if you want quick access to that information for your support people. It adds no new data over other tests conducted – it simply places the information in an easy to reach location with more visibility.

Usually, clients who have room on their results page and no need for other test widgets will adopt the device state widget.

testRTC March 2022 Release Notes

testingRTC & upRTC

  • Added the ability to control the collection frequency of getstats during tests using the #getstats-frequency run option. This is useful for long running tests
  • The longer the test, the longer the collection interval is now going to be by default
    • For tests with a #timeout value of 20 minutes or more, we will collect statistics every 5 seconds
    • For tests with a #timeout value of 60 minutes or more, we will collect statistics every 30 seconds

Analysis

Up until today, all of our graphs had their X axis relative time, which started from 00:00. With watchRTC, we started hearing more and more requests to also support absolute time, to make it easier to correlate events and metrics behavior to the wall clock. So we added just that – across all high level and probe/peer level graphs in testRTC. There’s a new clock icon which enables you to alternate between absolute and relative time.

APIs

  • We are tightening our security on our platform. Part of it is making sure that our customers don’t integrate with us using insecure interfaces. From this version and on, webhooks used can only use TLS 1.2 or newer
  • /testruns/ and /testagents/ API calls to get results of test runs now also show frames per second for incoming and outgoing video

qualityRTC

  • We’ve added a test to check for muted or unavailable microphones
  • Browsers now throttle tabs that are sent to the background. This may cause inaccuracies and timeouts to network tests conducted by qualityRTC. We’ve added indication in the results log on the time the test spent in the background
  • Internationalization now supports also Arabic, German and Japanese languages

watchRTC

Please update to the latest version of our SDK. This is important to enjoy some of the new features (and to help us weed out some nagging collection bugs).

An image is worth a 1,000 words. How about an animated GIF?

We’ve added to the watchRTC highlights and trends the ability to filter the graphs based on a slew of metrics and parameters.

This gives you superpowers in how you look at your deployment.

We’ve added a countries view to trends.

You’ll now see a map along with the top 5 countries accessing your service:

Webhooks for watchRTC notifications

UPDATE: We’ve renamed watchRTC custom notifications to custom alerts.

Last time we added custom notifications to watchRTC. These notifications enable you to set up notifications on quality metrics of any session taking place that watchRTC collects. The results were then aggregated on the Highlights dashboard as well as appear prominently on room and peer level views of the History dashboard.

Now you can catch these notifications as webhooks. Learn more about webhooks in watchRTC.

GetUserMedia failure tracking

GetUserMedia failures are one of these things that need to be handled by the application, but having more information about their prevalence can be quite useful. Due to popular demand, we’ve added this to watchRTC as well.

GetUserMedia failures are now collected and reported back to watchRTC once a peer connection is created. They can then be found on the Advanced WebRTC Analytics, peer level view and also filtered in the History view:

Here and there

  • Deep linking roomId and peerId with your application
    • We’re now making it super easy to programmatically “figure out” the URL that points to a room or a specific peer in a room. This can help in “fusing” watchRTC into your own monitoring and analysis tools and reducing the time you need to spend searching
    • On the reverse side, we can now configure a URL template to redirect roomId and peerId fields to a URL of your choosing. This can help you jump to your dashboard with additional application specific information you hold about the room or peer
    • Learn more about watchRTC URL redirections
  • You can now export the highlights and trends dashboards to PDF – that can be useful if you need to share it “elsewhere”
  • Custom events in watchRTC now support additional parameters on the event. This makes it easier to troubleshoot the application logic
  • Also with custom events – now the global events will show the peer id on the charts when you hover on the event
  • watchRTC SDK caused a slight freeze at the beginning of the first peer connection. This has been resolved and removed
  • Using a proxy for watchRTC now handles geolocation properly

Deep linking to rooms and peers

Oftentimes, you will have your own metadata associated with the rooms and peers you store in watchRTC. You might even have dedicated URLs for them, linking towards your database dashboard or other monitoring systems.

To make it super simple for you to switch from one application to another, watchRTC offers deep linking capabilities. This means that:

  1. You can deep link to any roomId and peerId, so that it is reachable with a single link-click from your systems
  2. You can deep link back from inside watchRTC room and peer views directly to your systems

In order to use this capability, be sure to decide how you designate roomId and peerId values in watchRTC.

Linking from your system to watchRTC

If you need to open a specific room or peer inside watchRTC, you can use these URL shortcuts:

Room

You can link directly to a specific roomId page:

https://app.testrtc.com/app/watchrtc/results?room=<roomId>

The above will be translated into the room URL with the roomId designated by <roomId>. If the roomId isn’t unique, then the last one created with that roomId will be linked to.

Peer in a room

Peers in testRTC are unique only within a specific room. You can link directly to a specific peerId inside a room page:

https://app.testrtc.com/app/watchrtc/results?peer=<peerId>&room=<roomId>

The above will be translated into the peer URL with the roomId designated by <roomId> and the peerId designated by <peerId>.

Linking from watchRTC to your system

In watchRTC, on a room page or a peer page, the roomId and peerId fields can be made clickable. In such a case, clicking them can link to a page on your choosing in your own system.

For this, we use two URL templates that can be configured:

  1. Room URL template, which receives {%roomId%} as a variable
  2. Peer URL template, which receives {%roomId%} and {%peerId%} as variables

If we were to redirect these to the same page for example, we would use the following template configurations:

  • https://app.testrtc.com/app/watchrtc/results?room={%roomId%}
  • https://app.testrtc.com/app/watchrtc/results?peer={%peerId%}&room={%roomId%}

If you would like to use these fields and redirect them to your own pages, submit a support ticket with the relevant information.

Create a watchRTC API key

In order to use watchRTC, you’ll need a special API key for it. This API key is used to associate the SDK with your account.

To create and use an API key, follow these steps:

  1. Enable watchRTC: If you created your own evaluation account in testRTC, then watchRTC isn’t enabled for you by default. You will need to approach our support asking for such access. You can do that by submitting a support ticket or by using the chat widget.
    At that point, we will be asking you of your requirements, nature of the application, etc.
    How do you know if watchRTC is enabled in your account? The watchRTC sidebar should be visible and open to you:
  2. Set an API key: Now that your account is enabled, you can create your API key.
    1. Navigate to the Settings section
    2. Select the General tab
    3. Click CREATE NEW API KEY
    4. Give the key a name
    5. Choose the key type
    6. Click CREATE
  3. Define domains being collected: We use a configuration of enabled domains. This makes sure that your watchRTC API key isn’t abused to collect data for others. To configure these domains, you can submit a support ticket, indicating which watchRTC domains you wish to collect data from.
    When the watchRTC SDK is initialized, the server will check to make sure the page watchRTC is executed on is from a valid domain.

Notes:

  • Domain names are provided as wildcards. If your app for example has WebRTC sessions created on *.myapp.com, then provide it simply as *.myapp.com
  • On the Settings | watchRTC configuration page you can see the domains that are approved for your watchRTC SDK