
Network Jitter or Round Trip Time – which is more important when testing or monitoring a WebRTC application?
You’ve got your WebRTC application. You have users communicating with it. How do you know they are having a good experience? How do you know you’ve placed your servers in the right locations? Got the routes properly configured? Do you need to add a new server in Frankfurt? Or maybe it would be better to beef up your Australian presence?
These answers require looking at the users you have and the quality they are getting. And when the time comes to look at WebRTC quality, you’ll hear a lot the terms network jitter, latency and round trip time thrown around.
So which one is more important to track and focus on with WebRTC? Is it network jitter or maybe it is round trip time?
I’d say both. But not exactly…
Let’s try to break this down to understand it better.
Table of contents
- Network vs “glass to glass”
- Network Jitter vs Round Trip Time (or Latency)
- What’s “Network Jitter”?
- Do we look at “Latency” or “Round Trip Time”?
- We didn’t talk packet loss
- Network jitter and round trip time – are these an infrastructure problem or an end user problem?
- How to fix network jitter and round trip time using testRTC’s tools?
Network vs “glass to glass”
We can look at these metrics, and especially latency and round trip time in different ways, where the first question to ask is what exactly are we measuring?

The illustration above is a simplified version of the network traffic in a WebRTC session. We don’t have servers here and we don’t have a lot of other components. Rest assured that each component along the way can add latency and even affect jitter.
What I did in the illustration is also delineated 3 different areas:
- The peripheral, where the media is acquired and played. Screens, microphones, cameras, speakers – they all add inherent delays and some of it can be considerable. Bluetooth devices for example are notorious for adding delays (anyone said iOS 15?)
- WebRTC processing, on its own, designed and built to reduce delays and jitter, but a contributor to it as well. This is doubly true in media servers that you own and operate but also true for browsers you don’t control and your users are using to access your service
- Network, which is what we’re trying to measure, at least in this article
Here’s the thing: for the most part, in most use cases, you have little control or knowledge of the peripherals being used. Measuring their own effects is also hard and in many real world applications impossible. So we are going to ignore peripherals.
WebRTC processing and the network are usually bunched together and there’s little in the way of splitting them up. Based on what you see and experience, you will need to decide if the issue is the network (=infrastructure and DevOps) or WebRTC processing (=software bugs and optimizations).
Network Jitter vs Round Trip Time (or Latency)
To me, the difference between network latency and round trip time is akin to the difference between weather and climate: Weather reflects short-term conditions of the atmosphere while climate is the average daily weather for an extended period of time at a certain location.
In the same token, jitter reflects short-term conditions or more accurately inconsistencies in the flow of packets over a network while round trip time (or latency) is the average time it takes for packets to flow through the network for a longer period of time and from one location to another.
Network Jitter answers the question how inconsistent the network is.
Round Trip Time (or Latency) answers the question how much delay is there in the network.
What’s “Network Jitter”?
In a WebRTC session, we will be sending over packets continuously. On a voice call, in many cases, a packet will be sent every 20 milliseconds. With video, we will be sending packets to reach 30 frames per second, and there are more than a single packet per frame usually, which means hundreds of packets every second.
Assuming the network experiences no packet loss, then we expect to receive the same number of packets in the same frequency.
Let’s look at a span of 200 milliseconds of audio from a sender’s perspective versus a receiver’s one. That’s 10 packets worth of data:
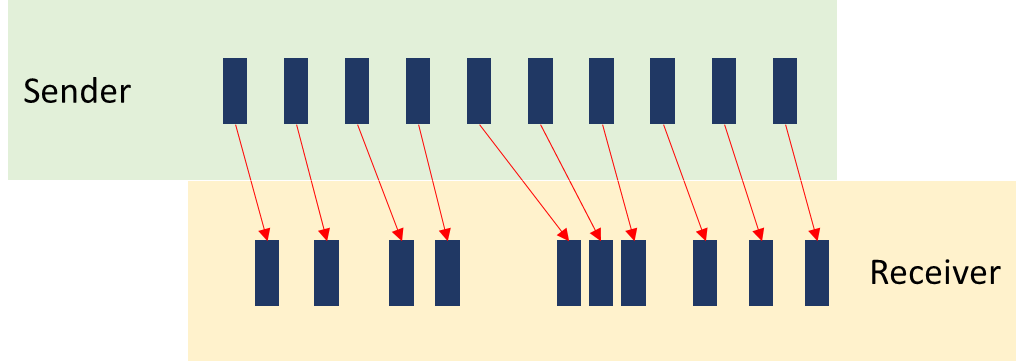
The sender sends an SRTP audio packet every 20 milliseconds in the illustration above, but the receiver doesn’t receive them exactly every 20 milliseconds – they are somewhat jittery… and that’s what we’re measuring with network jitter.
What contributes to network jitter?
Mainly the network.
When you send packets over the internet, who guarantees that what gets sent is actually received and in a timely manner?
Think about the post office. Not all letters delivered get to their destination, and not all letters delivered get to their destination with the same latency (=on time). The same is true for a computer network, and the more complex the network, the harder it gets to do this properly.
Here are some things that can affect network jitter badly:
- The user’s network and his location
- Poor location. A user connecting from inside an elevator over cellular or sitting far away from his WiFi access point will result in bursty connections that will introduce high jitter and packet loss
- Congested network. Either the local one (your daughter on TikTok and your son on Fortnite while you’re trying to have a conversation over WebRTC; an office with too many people on the Internet on a slow connection; 50,000 people in a stadium trying to do Facebook Live at the same time) or the path to the WebRTC infrastructure being clogged by network traffic
- Faulty hardware. A bad ethernet cable… a true story: we had a client some time ago stress testing his service, only to find that packet loss (and jitter) originated from a faulty cable in his data center
- CPU. Local resources on a user’s device or your TURN and media servers in itself can add jitter. If the CPU of a machine starts throttling, the end result is going to be jitter (and packet loss)
Things that end up causing jitter on top of just jitter are packet loss (we never did receive what was sent), duplication of packets (yes, that can happen) and reordering of packets (if they are out of order, there’s definitely jitter, just with an added headache).
Why is network jitter a bad thing?
Why is this bad? Because if we want to smoothly playback the audio and video being sent, we need to align it yet again towards what the sender intended. Or more accurately, towards what the microphone and camera captured on the sender side.
If we don’t align the incoming media, the audio will not sound natural and the video will look choppy. If you want to experience this firsthand, just make sure the CPU of the device you are using is busy doing other things while being on a video call.
How does WebRTC compensate for jitter?
This is something that all VoIP services have, which is a jitter buffer. A jitter buffer is a software component that collects the received packets and decides when to play them out. It is used to handle lip synchronization (playing out audio and video together in sync), to reorder packets, and to take into account the jitter on the network.
If we know that jitter can be around 30 milliseconds, then the jitter buffer can wait for at least that time before playing back packets, so that whenever we need to play back a packet in a smooth manner, that packet has already been received.
Since network jitter is dynamic in nature, so is WebRTC’s jitter buffer – it is an adaptive jitter buffer that tries to understand how much jitter there is on the network, and increase or decrease the buffer size (length) based on what the network exhibits. Why do we do that? Because too little jitter means bad user experience due to dropped packets or improper playback and too high a jitter means adding to the latency of the playout, which we don’t want in real time interactive WebRTC sessions.
Do we look at “Latency” or “Round Trip Time”?
Latency, round trip time and delay are words that get dumped together. Also RTT – which is the acronym for round trip time. While there are nuances between them, and what exactly each one means, the lower they are the better the experience will be and the better interactive the session can be.
Here’s how I usually look at these and categorize them:
Latency for me is the time it takes for a packet of data to get from one point in the network to another.
Round trip time is the time it takes for a response packet to get back.
You can argue around latency and delay and decide if they should include or shouldn’t include the peripheral’s built in delay or even the delay added by WebRTC processing in end units or servers in the network.
For round trip time, the argument can be around the processing time needed to handle the incoming message and then send out the reply to it (if don’t incorrectly, this can add a considerable delay on its own).
And how do you measure latency exactly? If the clocks on the two devices aren’t fully in sync, how can you measure it? The result is, that in most cases, and WebRTC is no different, you rely on the round trip time instead – if I send a message and wait for a response, all I need to do is check the time that passed. And that’s exactly what you can glean out of the RTCP reports and WebRTC statistics.
What contributes to round trip time?
Besides the things that affect jitter, you’ll find here also the route taken by the packets over the network.
Here’s how I usually explain it – lets say your TURN server or media server or gateway is located in “East US”. That’s the generic name we all give to our first cloud data center choice.
Why? We want a global service, but we try to target the US first, so it needs to be in the US. And on the maps, the best alternative to also reach Europe is the east coast. So we end up with US East on one of the cloud vendors. At least until we grow and distribute our service.
What happens if the session takes place between 2 people who are both located in Paris and the session is routed through our media servers in the US?
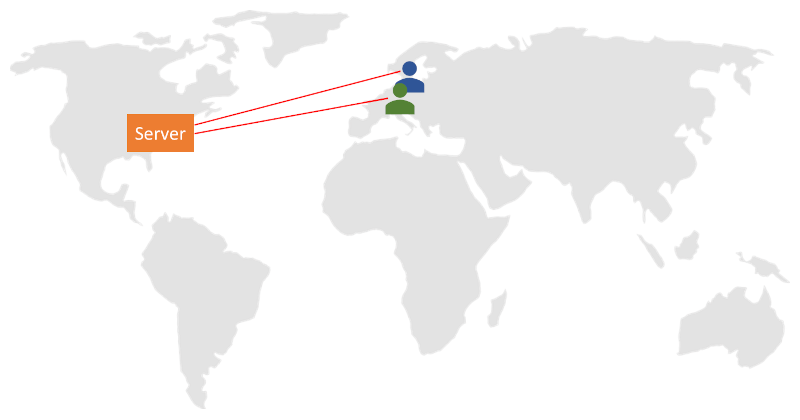
That most probably will take a longer route both geographically and when measured in time, which ends up adding to the latency of the session. In many cases, it also means a higher packet loss as there are more opportunities along that route to lose packets.
This means that the way we design our infrastructure, deploy it around the globe and configure it has a considerable impact on the round trip time users are going to experience.
Why is high round trip time a bad thing?
More latency means it takes time from what we do until the other side can hear or see it.
For live streaming (somewhat related to WebRTC), the effects of latency are simply to explain. Here’s a good video for that:
If you are dealing with surveillance cameras, then latency is bad. When you’re in an interactive session – a 1:1 conversation or a group meeting, then you’ll be expecting latency of below 200 milliseconds. Anything above that would be noticeable and nagging. You won’t know when someone finished speaking so you can contribute to the conversation right after him for example.
So we’d like to have low round trip time as well as low network jitter for a good interactive experience in WebRTC applications.
How does WebRTC compensate for high round trip time?
It doesn’t. Not really. You’re on your own. You’ll need to decide where to place your servers and how to configure the routes between them to reduce latency.
Solutions we’ve seen recently range from:
- Placing more media servers and TURN servers in more data centers closer to where your users are
- Using third party TURN servers that are highly distributed (think Subspace and Cloudflare)
- Go for a service such as AWS Global Accelerator to end up with an optimized route
At the end of the day, you’ll need to invest energy or money or both in order to improve round trip time as you grow your service.
We didn’t talk packet loss
Here’s something you should understand – high round trip time or network jitter can easily cause packet loss.
If there’s congestion on the network, you might end up with packet loss since a network switch or router along the path of your packets decided to drop some of your packets because it is congested.
But if the packets arrive too late (because of high round trip time or high jitter), then playing them might not be an option anymore – their time has passed. In such a case, WebRTC would simply drop the packet even though it received it. The real time nature of WebRTC doesn’t allow it to buffer data forever.
Network jitter and round trip time – are these an infrastructure problem or an end user problem?
Both.
At times, network jitter and round trip time can occur due to infrastructure issues – anything from faulty cables, bad network configurations or just machines that are too busy to process data fast enough.
Other times, your user is to blame. Either due to his device or the network he is using.
Then there’s the network. If everyone is currently trying to access the network, there are bound to be clogged routes, even if only periodically.
It is going to be your job to try and understand where the problem originates from.
How to fix network jitter and round trip time using testRTC’s tools?
Glad you asked 😀
testRTC offers tools for the full life cycle of WebRTC applications. For the most part, fixing jitter and round trip time is going to be part of the operations work on your end – understanding where traffic is routed through and how to redirect it elsewhere (including the possible need to add new regions and servers). Here’s where you’ll meet network jitter and round trip time in our services:
testingRTC
Our WebRTC testing service enables you to conduct integration, regression, function, non-functional, sizing, load and stress testing.
In all tests we collect network jitter and round trip time for all simulated probes in a session. We treat your service as a black box, launch our machines from different locations around the globe (you define which ones) and collect that as part of the metrics we store. We make it available on the channel level, browser level and test level as an aggregate of everything. Access to it is offered via the dashboard and through APIs. You can even add your expectations of these values and cause tests to fail based on your thresholds. If you want, you can dynamically change these values for each browser in the test and see how this affects your service.
upRTC
upRTC is our WebRTC active monitoring service. Its main purpose is to understand the behavior of your infrastructure. It does that by bringing predictability to the user side and his network, so you can be sure that every time the monitor’s browser runs in front of your infrastructure they behave the same from the side of the network.
Here, looking at network jitter and round trip time and setting thresholds for them to alert you via email and webhook is the way to go.
watchRTC
watchRTC offers WebRTC passive monitoring. It hooks up to your users’ devices and collects their WebRTC metrics. This gets processed, aggregated and analyzed. Part of the metrics we collect and share is network jitter and round trip time. We do that on the individual channel level, the peer level, the room level and in aggregate across complex filters:
The purpose of it all is:
- To let you understand what your end users are experiencing
- Assist you in tracking down outliers in device types, operating systems, networks, locations, etc
- Drill down to a certain user’s complaint when needed
qualityRTC and probeRTC
With qualityRTC and probeRTC we help your support and users answer the question “how can I improve my connectivity to your service?”
This is done by a series of tests, many of them collecting network jitter and round trip time data
Talk to us
Need to figure out your network jitter? Have a round trip time and latency issue with users?
Come and talk to us. I am sure we will be able to help you figure out the issues.