Category Archives for "Announcements"

4

Testing call center quality when onboarding WFH remote agents

As call centers are shifting from office work to work from home with the help of cloud and WebRTC, network quality and testing are becoming more important than ever. qualityRTC is here to help.

“testRTC’s Network Testing service reduces the turnaround time for us in understanding and addressing potential network issues with clients”

João Gaspar, Global Director, Customer Service at Talkdesk

How did we get here?

Call centers were in a slow migration, from on-premise deployments transitioning towards the cloud. It was the SMBs, a few larger call centers and that’s about it. We’ve started seeing upmarket movement of cloud call center providers towards larger contact centers, talking about 1,000s of agents and more per call center.

This migration came to be because of several things occurring at once:

  1. A general shift of everything to the cloud
  2. The success of SaaS startups of all kinds and the rise of unicorns (a few of them in the communication and call center space)
  3. WebRTC as a browser technology
  4. The need for more business agility and flexibility, along with the movement of remote work
  5. Cost
  6. Transition time to a new software stack

In March 2020 what we’ve seen is a rapid transition to remote work for all imaginable jobs. All of them. Everywhere. In most countries.

Source: The Economist

The reds and cyans on the map above from The Economist are quarantined countries. And that’s from over two weeks ago. This is worse today.

Here’s the funny thing:

  • We’re not all stuck at home
  • Switched to online deliveries of everything. From computing hardware, to gym gear, to groceries and food deliveries
  • We need call centers more than ever before
  • But call centers are physical locations, where employees can no longer reside. At least not if the service is deemed non-essential

What are we to do?

Rapidly shift call centers to work from home.

Call center deployments today

And there are two main architectures to get that done, and which one a call center will pick depends on where they started – on premise or in the cloud:

Cloud based call centers are more suitable for the WFH era, but they have their challenges as well. And in both cases, there’s work to be done.

Shifting to cloud call center WFH

Here’s how a shift to WFH looks like, and how we get there, depending on where we started (cloud or on premise):

Cloud based call centers would simply switch towards having their calls diverted to the agents’ homes. On premise call centers can go two ways:

  1. Migrate to the cloud, in record time, with half the customizations they have in their on premise deployment. But you can’t get picky these days
  2. Connect the on premise call center via an SBC (Session Border Controller) to the home office

Connecting agents via VPN to WFH:

WFH call center agents biggest challenge

Once you deal with the architectural technical snags, you are left with one big challenge: getting 100s or 1,000s of agents to work from home instead of in the office.

And the challenge is that this is an environment you can’t control.

A month ago? You were in charge of a single network – the office one. You had to make sure it was connected properly to the cloud or the SIP trunk that connected you to the carrier to get your calls going. Maybe you had several offices, each one housing lots of agents.

Today? You need to handle connectivity and media quality issues of more than a single office – more like hundreds or thousands of agents. Each with his own network and his own issues:

  • Bad firewall configurations
  • Misuse of VPN software (trying to watch the latest TV shows abroad)
  • Poor service provider internet access
  • Wrong location in the house, causing poor wifi reception
  • and the list of surprising issues goes on…

Analysing and understanding the network conditions of each home network of each agent becomes a first priority in scaling up your call center back to capacity.

Are you wasting time figuring out the network quality of your remote agents working from home?

If each agent takes 30 minutes to deal with to get to the root cause of the issues blocking him from running properly, then getting a contact center of 100 agents will take 50 work hours for your IT. For 1,000 agents – 500 hours. This is definitely NOT scalable.

qualityRTC for WFH agents network testing

We’ve designed and built qualityRTC to assist cloud call center vendors handle onboarding and troubleshooting issues of the call center clients they have. We have a webinar on how Talkdesk uses our service just for that purpose.

What we found out this past month is that qualityRTC shines in call center WFH initiatives – both for the vendors but also directly for the call centers themselves. We’ve seen an increase of x100 use of our demo, which led us to place it behind a password, in an effort to protect the service capacity for our clients.

Here’s how results look on our service:

The above is a screenshot taken on my home network. You can check it out online here.

qualityRTC offers several huge benefits:

  • It conducts multiple network tests to give you a 360 view of your agent’s home network. This is far superior to the default call test solutions available in some of the call center services
  • qualityRTC is simple to use for the home agent. Collecting the statistics takes only a few minutes and require a single click
  • There is no installation required, and the integration to your backend is simple (it is even simpler if you are a Twilio or TokBox customer already). Oh – and we can customize it for your needs and brand
  • There’s a workflow there, so that your IT/support get the results immediately as they take place. You don’t need to ask the agent to send you anything or to validate he did what you wanted

Here’s a quick walkthrough of our service:

Want to take us for a spin? Contact us for a demo

qualityRTC network testing FAQ

Do I need to install anything?

No. You don’t need to install anything.

Your agents can run the test directly from the browser.

We don’t need you to install anything in your backend for this to work. We will integrate with it from our end.

What network tests does qualityRTC conduct?

We conduct multiple tests. For WFH, the relevant ones are: a call test through your infrastructure, firewall connectivity tests, location test, bandwidth speed test and ping test.

By having all these tests conducted and collected from a single tool, to your infrastructure, and later visualized for both the agent and your IT/support, we make it a lot simpler for you to understand the situation and act based on solid data.

How is qualityRTC different from a call test?

A call test is just that. A call test.

It tells you some things but won’t give you a good view if things go wrong (like not being able to connect a call at all). What qualityRTC does is conduct as many tests as possible to get an understanding of the agent’s home network so that you can get a better understanding of the issues and solve them.

If I use SIP for my WFH agents, can qualityRTC help me?

Yes. A lot of the network problems are going to be similar in nature. Some of the tests we conduct aren’t even done using WebRTC.

Our service is based on WebRTC, but that doesn’t mean you can’t use it to validate a call center that offers its remote agents service via SIP.

How much time does it take to setup qualityRTC?

If you are using Twilio or TokBox we can set you up with an account in a day. A branded site in 2-3 more days.

If you are using something else, we can start off with something that will work well and fine tune to your exact needs within 1-2 weeks.

How much does this network testing tool cost?

Reach us out for pricing. It depends on your size, infrastructure and need.

From a point of view of price structure, there’s an initial setup and customization fee and a monthly subscription fee – you’ll be able to stop at any point in time.

What if my agents are distributed across the globe?

qualityRTC will work for you just as well. The service connects to your infrastructure wherever it is, conducting bandwidth speed tests as close as possible to your data centers. This will give you the most accurate picture, without regards to where on the globe or in what exact location your agents are.

Is qualityRTC limited to voice only calls?

No. We also support video calls and video services.

And once we’re back to normalcy, there is also a specific throughput test that can give some indication as to the capacity of your call center’s network (when NOT working from home).

Does it make sense to use qualityRTC for UCaaS and not only contact centers?

Yes it is.

Our main focus for the product is to check network readiness for communication services. It just so happens that our tool is a life saver today for many call centers that are shifting to work from home mode due to the pandemic and the quarantines around the globe.

Call Center WFH Solutions

If you need help in shifting your call center towards work from home agents, contact us – we can help. Both in stress testing your SBC capacity as well as in analyzing your agent’s home network characteristics.

2

Analyzing WebRTC network issues FASTER for your customers

Did this ever happen to you when you got a complaint from a customer?

You get a complaint from a customer. Usually it will be a prospect, trying out your cloud contact center service. He will say something like this:

“The calls just don’t connect”

Or maybe it will be “call quality sucks”

It might be some other complaint which you will immediately tag in your mind as a network issue with that customer’s network. The challenging part now, is how to help that customer?

Can you check your backend logs to find that single call and try to figure out the issues with it? Will that tell you (and convince your prospect) that the issue resides on their end?

Would you be asking your customer to try again? Maybe to check if google.com loads in his browser? Or run a generic speed test service? How will that further your understanding of the problem and get you to a resolution?

The main challenge here is the time it takes to collect the information and then to show the customer why this is happening so he can fix his end of the problem.

What do I mean exactly?

  • The customer opens up a ticket
  • Gets an automated email from the ticketing system
  • At some point, a support person on your end will see the ticket, and send back a response. Something along the lines of a few things you want the customer to do for you
  • A day goes by
  • Or two
  • And you get a response. Your support person now needs to read the whole thing to refresh his memory. And in all likelihood, ask the customer for more information, or to conduct the information collection he did slightly differently
  • Back at forth it goes 2-4 times
  • Each time, losing hours or days

That prospect? Got a bit colder now in using your service.

The customer who complained? He is now unhappy. He can’t get decent calls done.

We need a better solution for this.

In 2019, we’ve worked with Talkdesk on a service that solves just that – getting the data they needed faster to their support team so they can help and onboard new customers faster. Just by making sure they have the data they need sooner and without too much of a hassle for their customers.

João Gaspar from Talkdesk joined us for a webinar. In this webinar he shared what Talkdesk’s support team is able to achieve by using our Network Testing service.

Check out the recording of the webinar:

Feel free to contact us to learn more about this tool.

The new dashboard homepage for testRTC

New UI, assets and better WebRTC analytics

Earlier this week we’ve started rolling out our new version of testRTC to our customers. This was one of these releases that we’ve worked on for a long time, starting two or three releases back when a decision was made that enough technical debt has been accumulating and a refresh was needed. It started as a nicely sized Angular to React rewrite and “redesign” which ended up being a lot more than that.

The results? Something that I am really proud of.

New top level view of test result in testRTC

The switch to React included a switch to Highcharts as well, so we can offer better graphs moving forward. This isn’t why I wanted to write about this release though.

If you’ve been using testRTC already, you will be quite comfortable with this new release. It will feel like an improvement, while keeping everything you wanted and were used to using in the same place.

There are four things we’ve added that you should really care about:

#1 – Assets

This is something we are asked for quite some time now. We have clients who are running multiple tests and multiple monitors.

In some cases, the different scripts have only slight variations in them. In others, they share common generic tasks, such as login procedures.

The problem was that we were allowing customers to create a single file script only, and run it as a fully contained “program”. This kept our solution simple and elegant, but not flexible enough for growth.

This is why we are introducing Assets into the mix.

Assets screen in testRTC

You can now create asset files which are simple scripts. Once created, you can include them into any of your running test scripts. You do that by simply adding an .include(‘<asset-name>’) command into your test script.

#2 – Advanced WebRTC Analytics

We’ve kinda revamped the whole Advanced WebRTC Analytics screen.

Up until now, it was a braindump of all getstats statistics without much thought. It gave power to the people, but it took its toll.

This time around, we’ve sat down to decide what information we have available, looked at what others are doing, and ended up with our own interpretation of what’s needed:

Advanced WebRTC Analytics view in testRTC with new information

The Advanced WebRTC Analytics section now includes the following capabilities:

  • Splits information into peer connection for easy view
  • Shows getUserMedia constraints
  • Show the PeerConnection configuration, so it is now super easy to see what STUN and TURN servers were configured
  • Show cipher information for the security conscious
  • Show ICE state machine progress, correlating it with the events log
  • Show ICE negotiation table, to pinpoint on failure reasons (and understand what candidate pair got selected)
  • Show WebRTC API events log, with the detailed calls and callbacks
  • Show the actual graphs, just nicer, with Highcharts

I’ve been using these new capabilities just last week to explain to a new lead why his calls don’t connect with our probe’s firewall configuration.

#3 – Media scores everywhere

We’ve added media scores to our test results in the last release, but we placed them only on the test results page itself.

Media quality score in test results in testRTC

Now we’re taking the next step, putting the scores in monitor lists and test run lists. This means they are more accessible to you and can be seen everywhere.

What can you do with them?

  1. Quickly understand if your service degrades when you scale
    1. Run the smallest test possible. See the media score you get
    2. Start scaling the test up. Expect the media score to not drop. If it does, check why
  2. Make sure monitors are stable
    1. Run a monitor
    2. Check if the media score changes over it
    3. If it changes too much, you have an infrastructure problem

#4 – Client performance data

Another thing we’ve had for quite some time, but now decided to move front and center

There’s now a new tab in the test results of a single probe called “Performance”:

testRTC machine performance view

When opened, if you have the #perf directive in your run options, it will show you the probe’s machine performance – the CPU, memory and network use of the probe and browser.

This will give you some understanding of what user machines are going to be “feeling”, especially if you are aiming for a UI-heavy implementation.

We see customers using this for performance and stress testing.

Other

Other improvements that made it into this release?

  • Filtering webhooks to run only on failed test runs
  • Automating dynamic allocation of probes when no static ones are available
  • Export test run history
  • Ability to execute and collect traceroute on DNS lookups in the browser
  • Added support to run longer tests
  • Modified fields in most tables to make them more effective to users

Check it out 🙂

Testing Firefox has just become easier (and other additions in testRTC)

We’ve pushed a new release for our testRTC service last month. This one has a lot of small polishes along with one large addition – support for Firefox.

I’d like to list some of the things you’ll be able to find in this new release.

Firefox

When we set out to build testRTC, we knew we will need to support multiple browsers. We started off with Chrome (just like most companies building applications with WebRTC), and somehow drilled down into more features, beefing up our execution, automation and analysis capabilities.

We tried adding Firefox about two years ago (and failed). This time, we’re taking it in “baby steps”. This first release of Firefox brings with it solid audio support with rudimentary video support. We aren’t pushing our own video content but rather generating it ad-hoc. This results less effective bitrates that we can reach.

The challenge with Firefox lies in the fact that it has no fake media support the same way Chrome does – there is no simple way to have it take up media files directly instead of the camera. We could theoretically create virtual camera drivers and work our way from there, but that’s exactly where we decided to stop. We wanted to ship something usable before making this a bigger adventure (which was our mistake in the past).

Where will you find Firefox? In the profile planning section under the test editor:

When you run the tests, you might notice that we alternate the colors of the video instead of pushing real video into it. Here’s how it looks like running Jitsi between Firefox and Chrome:

That’s a screenshot we’ve taken inside the test. That cyan color is what we push as the video source from Firefox. This will be improved over time.

On the audio side you can see the metrics properly:

If you need Firefox, then you can now start using testRTC to automate your WebRTC testing on Firefox.

How we count minutes

Up until now, our per minute pricing for tests was built around the notion of a minimum length per test of 10 minutes. If you wanted a test with 4 probes (that’s 4 browsers) concurrently, we calculated it as 4*10=40 minutes even if the test duration was only 3 minutes.

That has now changed. We are calculating the length of tests without any specific minimum. The only things we are doing is:

  1. Length is rounded up towards the nearest minute. If you had a test that is 2:30 minutes long, we count it as 3 minutes
  2. We add to the test length our overhead of initiation for the test and teardown. Teardown includes uploading results to our servers and analyzing them. It doesn’t add much for smaller tests, but it can add a few minutes on the larger tests

End result? You can run more tests with the minutes allotted to your account.

This change is automatic across all our existing customers – there’s nothing you need to do to get it.

Monitoring tweaks

We’ve added two new capabilities to monitoring, due to requests of our customers.

#1 – Automated run counter

At times, you’ll want to alternate information you use in a test based on when it gets running.

One example is using multiple users to login to a service. If you run a high frequency monitor, which executes a test every 2-5 minutes, using the same user won’t be the right thing to do:

  • You might end up not leaving the first session when running the next monitor a couple of minutes later
  • Your service might leave session information for longer (webinars tend to do that, waiting for the instructors to join the same session for ten or more minutes after he leaves)
  • If a monitor fails, it might cause a transient state for that user until some internal timeout

For these, we tend to suggest clients to use multiple users and alternate between them as they run the monitors.

Another example is when you want in each round of execution to touch a different part of your infrastructure – alternating across your data centers, machines, etc.

Up until today, we’ve used to do this using Firebase as an external database source that knows which user was last used – we even have that in our knowledge base.

While it works well, our purpose is to make the scripts you write shorter and easier to maintain, so we added a new (and simple) environment variable to our tests called RTC_RUN_COUNT. The only thing it does is return the value of an iterator indicating how many times the test has been executed – either as a test or as a monitor.

It is now easy to use by calculating the modulu value of RTC_RUN_COUNT with the number of users you created.

You can learn more about RTC_RUN_COUNT and our other environment variables in our knowledge base.

#2 – Additional information

We had a customer recently who wanted to know within every run of a monitor specific parameters of that run – in his case, it was the part of his infrastructure that gets used during the execution.

He could have used rtcInfo(), but then he’ll need to dig into the logs to find that information, which would take him too long. He needed that when the monitors are running in order to quickly pinpoint the source of failures on his end.

We listened, and added a new script command – rtcSetAdditionalInfo(). Whatever you place in that command during runtime gets stored and “bubbled up” – to the top of test run results pages as well as to the test results webhook. This means that if you connect the monitor to your own monitoring dashboards for the service, you can insert that specific information there, making it easily accessible to your DevOps teams.

Onwards

We will be looking for bugs (and fixing them) around our Firefox implementation, and we’re already hard at work on a totally new product and on some great new analysis features for our test results views.

If you are looking for a solid, managed testing and monitoring solution for your WebRTC application, then try us out.

Monitoring WebRTC apps just got a lot more powerful

As we head into 2019, I noticed that we haven’t published much around here. We doubled down on helping our customers (and doing some case studies with them) and on polishing our service.

In the recent round of updates, we added 3 very powerful capabilities to testRTC that can be used in both monitoring and testing, but make a lot of sense for our monitoring customers. How do I know that? Because the requests for these features came from our customers.

Here’s what got added in this round:

1. HAR files support

HAR stands for HTTP Archive. It is a file format that browsers and certain viewer apps support. When your web application gets loaded by a browser, all network activity gets logged by the browser and can be collected by a HAR file that can later be retrieved and viewed.

Our focus has always been WebRTC, so collecting network traffic information that isn’t directly WebRTC wasn’t on our minds. This changed once customers approached us asking for assistance with sporadic failures that were hard to reproduce and hard to debug.

In one case, a customer knew there’s a 502 failure due to the failure screenshot we generate, but it wasn’t that easy to know which of his servers and services was the one causing it. Since the failure is sporadic and isn’t consistent, he couldn’t get to the bottom of it. By using the HAR files we can collect in his monitor, the moment this happens again, he will have all the network traces for that 502, making it easier to catch.

Here’s how to enable it on your tests/monitors:

Go to the test editor, and add to the run options the term #har-file


Once there and the test/monitor runs next, it will create a new file that can be found under the Logs tab of the test results for each probe:

We don’t handle visualization for HAR files for the moment, but you can download the file and place it on a visual tool.

I use netlog-viewer.

Here’s what I got for appr.tc:

2. Retry mechanism

There are times when tests just fail with no good reason. This is doubly true for automating web UI, where minor time differences may cause problems or when user behavior is just different than an automated machine. A good example is a person who couldn’t login – usually, he will simply retry.

When running a monitor, you don’t want these nagging failures to bog you down. What you are most interested in isn’t bug squashing (at least not everyone) it is uptime and quality of service. Towards that goal, we’ve added another run option – #try

If you add this run option to your monitor, with a number next to it, that monitor will retry the test a few more times before reporting a failure. #try:3 for example, will retry twice the same script before reporting a failure.

What you’ll get in your monitor might be something similar to this:

The test reports a success, and the reason indicates a few times where it got retried.

3. Scoring of monitor runs

We’ve started to add a scoring system to our tests. This feature is still open only to select customers (want to join in on the fun? Contact us)

This scoring system places a test based on its media metrics collected on a scale of 0-10. We decided not to go for the traditional MOS scoring of 1-5 because of various reasons:

  1. MOS scoring is usually done for voice, and we want to score video
  2. We score the whole tests and not only a single channel
  3. MOS is rather subjective, and while we are too, we didn’t want to get into the conversation of “is 3.2 a good result or a bad result?”

The idea behind our scores is not to look at the value as good or bad (we can’t tell either) but rather look at the difference between the value across probes or across runs.

Two examples of where it is useful:

  1. You want to run a large stress test. Baseline it with 1-2 probes. See the score value. Now run with 100 or 1000 probes. Check the score value. Did it drop?
  2. You are running a monitor. Did today’s runs fair better than yesterday’s runs? Worse? The same?

What we did in this release was add the score value to the webhook. This means you can now run your monitors and collect the media quality scores we create and then trendline them in your own monitoring service – splunk, elastic search, datadog, whatever.

Here’s how the webhook looks like now:

The rank field in the webhook indicates the media score of this session. In this case, it is an AppRTC test that was forced to run on simulated 3G and poor 4G networks for the users.

As with any release, a lot more got squeezed into the release. These are just the ones I wanted to share here this time.

If you are interested in a monitoring service that provides predictable synthetics WebRTC clients to run against your service, checking for uptime and quality – check us out.

WebRTC Application Monitoring: Do you Wipe or Wash?

UPDATE: Recording of this webinar can be found here.

If you are running an application then you are most probably monitoring it already.

You’ve got New Relic, Datadog or some other cloud service or on premise monitoring setup handling your APM (Application Performance Management).

What does that mean exactly with WebRTC?

If we do the math, you’ve got the following servers to worry about:

  • STUN/TURN servers, deployed in one or more (probably more) data centers
  • Signaling server, at least one. Maybe more when you scale the service up
  • Web server, where you actually host your application and its HTML pages
  • Media servers, optionally, you’ll have media servers to handle recording or group calls (look at our Kurento sizing article for some examples)
  • Database, while you might not have this, most services do, so that’s another set of headaches
  • Load balancers, distributed memory datagrid (call this redis), etc.

Lots and lots of servers in that backend of yours. I like to think of them as moving parts. Every additional server that you add. Every new type of server you introduce. It adds a moving part. Another system that can fail. Another system that needs to be maintained and monitored.

WebRTC is a very generous technology when it comes to the variety of servers it needs to run in production.

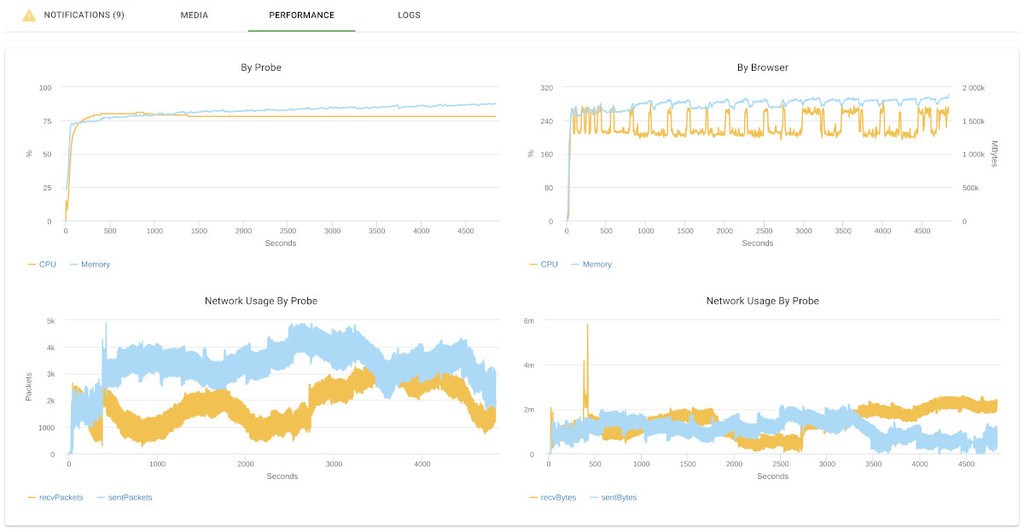
Assuming you’re doing application monitoring on these servers, you are collecting all machine characteristics. CPU use, bandwidth, memory, storage. For the various servers you can go further and collect specific application metrics.

Is that enough? Aren’t you missing something?

Here are 4 quick stories we’ve heard in the last year.

#1 – That Video Chat Feature? It Is Broken

We’re still figuring out this whole embeddable communications trend. The idea of companies taking WebRTC and shoving voice and video calling capabilities into an existing product and workflow. It can be project management tools, doctor visitations, meeting scheduler, etc.

In some cases, the interactions via WebRTC are an experiment of sorts. A decision to attempt embedding communications directly to the existing product instead of having users find how to communicate directly (phone calls and Skype were the most common alternatives).

Treated as an experiment, such integrations sometimes were taken somewhat out of focus, and the development teams rushed to handle other tasks within the core product, as so often happens.

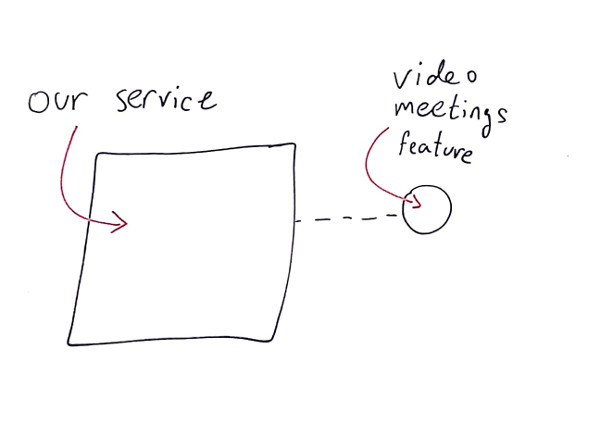
In one such case, the company used a CPaaS vendor to get that capability integrated with their service, so they didn’t think much about monitoring it.

At least not until they found out one day that their video meetings feature was malfunctioning for over two weeks (!). Customers tried using it and failed and just moved on, until someone complained loud enough.

The problem ended up being the use of deprecated CPaaS SDK that had to be upgraded and wasn’t.

#2 – But Our Service is Working. Just not the Web Calling Part

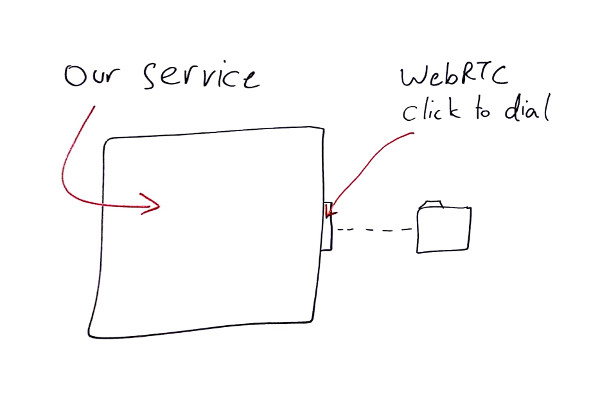
In many cases, there’s an existing communication product that does most of its “dealings” over PSTN and regular phone numbers. Then one day, someone decides to add browser dialing. Next thing that happens, you’ve got a core product doing communications with a new WebRTC-based feature in there.

Things are great and calls are being made. Until one day a customer calls to complain. He embedded a call button to his website, but people stopped calling him from the site. This has gone for a couple of days while he tried tweaking his business and trying to figure out what’s wrong. Until finding out that the click to call button on the website just doesn’t work anymore.

Again, all the monitoring and health check metrics were fine, but the integration point of WebRTC to the rest of the system was somewhat lost.

The challenge here was that this got caught by a customer who was paying for the service. What the company wanted to do at that point is to make sure this doesn’t repeat itself. They wanted to know about their integration issues before their customers do.

#3 – Where’s My Database When I Need it?

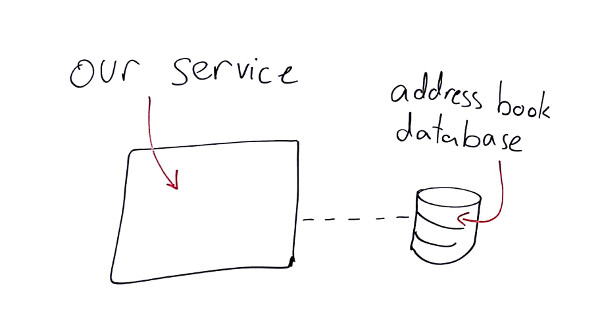
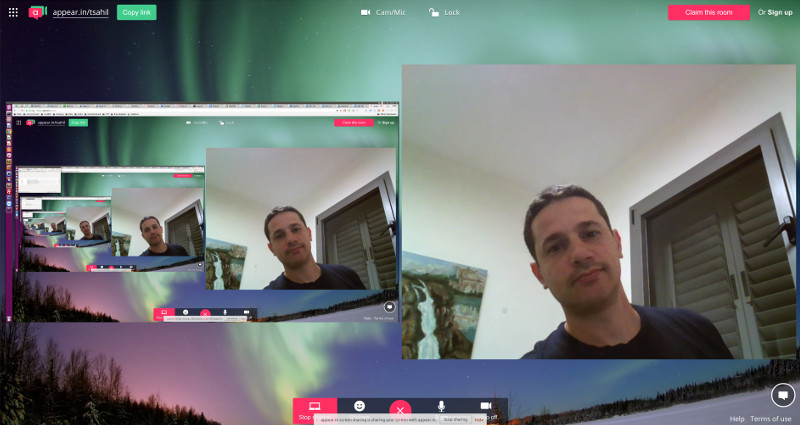
Here’s another one. A customer of ours has this hosted unified communications service that runs from the browser. You login with your credentials, see a contacts list and can dial anyone or receive calls right inside the browser.

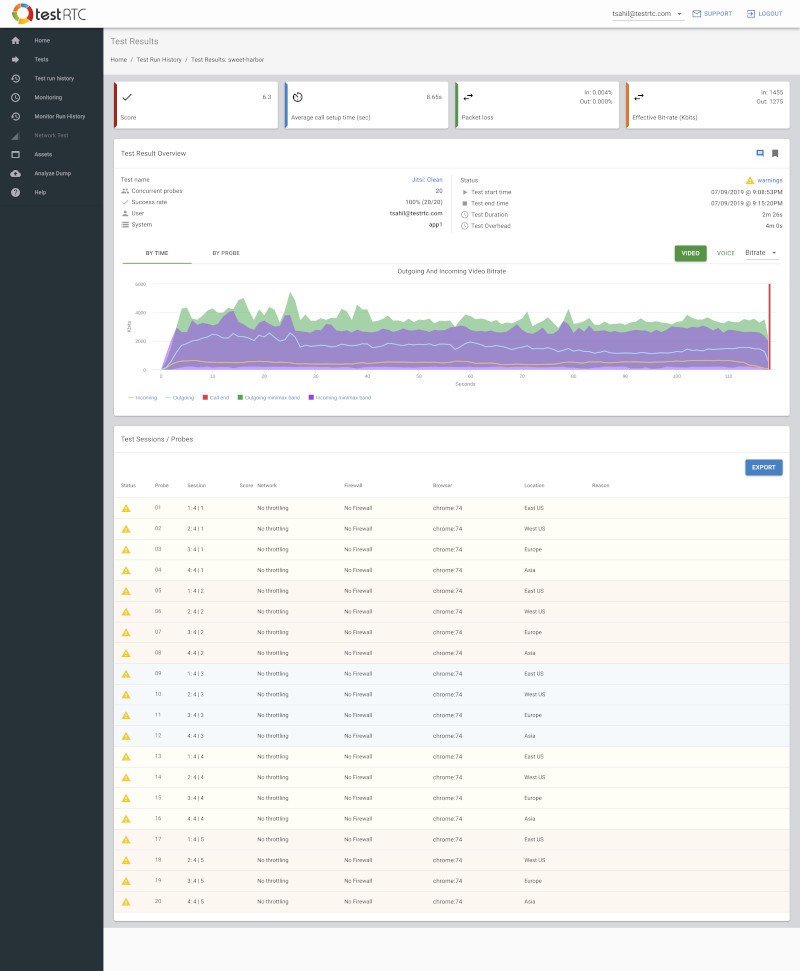
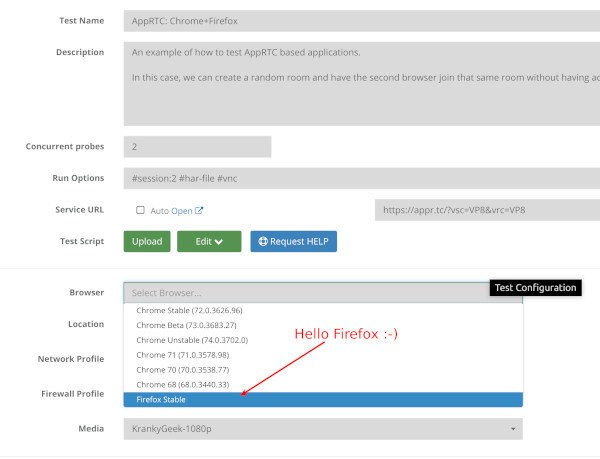
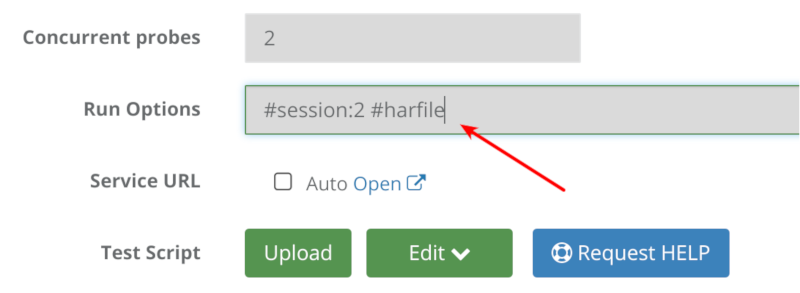
They decided to create a monitor with us that runs at a low frequency doing the exact same thing: two people logging in, one calls and the other answers. Checking that there’s audio and video and all is well.

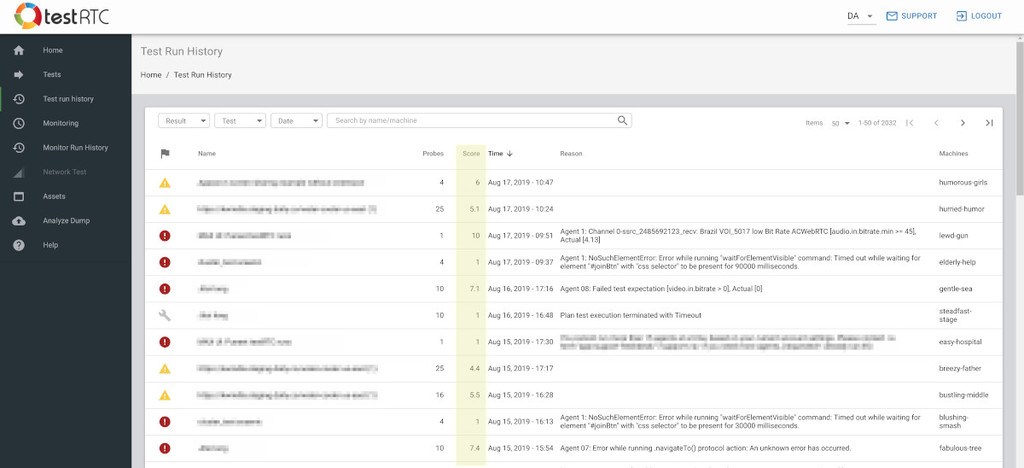
One time they contacted us complaining that our monitor is  failing while they know their system is up and running. So we opened up a failed monitor run, looked at the screenshot we collect automatically upon failure and saw an error on the screen – the browser just couldn’t get the address book of the user after logging in.

This had nothing to do with WebRTC. It was a faulty connection to the database, but it ended up killing the service. They got that pinpointed and resolved after a couple of iterations. For them, it was all about the end-to-end experience and making sure it works properly.

#4 – The Doctor Won’t See You Now

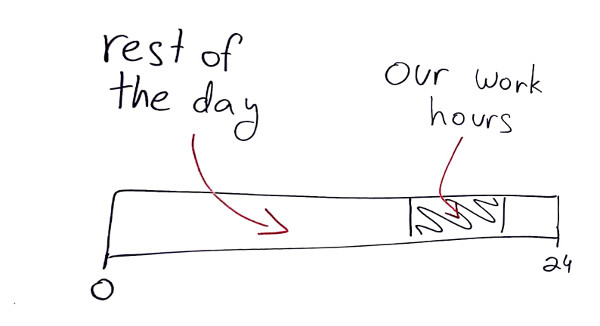
Healthcare is another interesting area for us. We’ve got customers in this space doing both testing and monitoring. The interesting thing about healthcare is that doctor visitations aren’t a 24/7 thing. For that particular customer it was a 3-hour day shift.

The service was operating outside of the normal working hours of the doctor’s office, with the idea of offering patients a way to get a doctor during the evening hours.

With a service running only part of the day, the company wanted to be certain that the service is up and running properly – and know about it as early on as possible to be able to resolve any issues prior to the doctors starting their shift.

End-to-End Monitoring to the Rescue

In all of these cases, the servers were up and running. The machines were humming along, but the service itself was broken. Why? Because application metrics tell a story, but not the whole story. For that, you need end-to-end monitoring. You need a way to run a real session through the system to validate that all of its pieces – all of its moving parts – are working well TOGETHER.

Next week, we will be hosting a webinar. In this webinar, we will show step by step how you can create a killer monitor for your own WebRTC application.

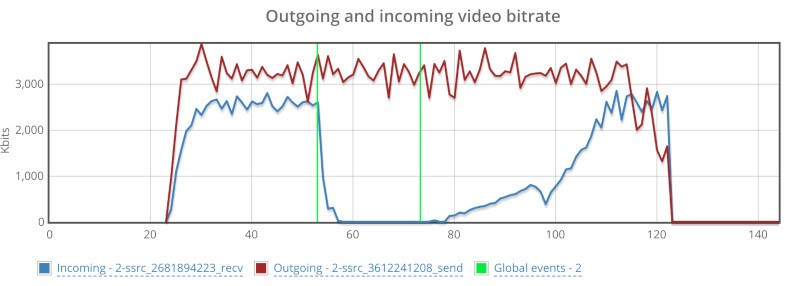
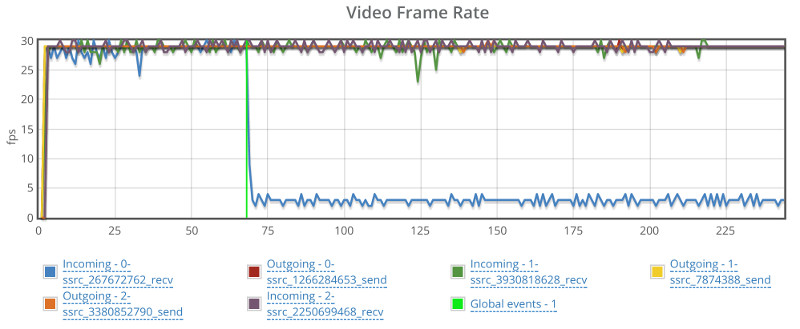
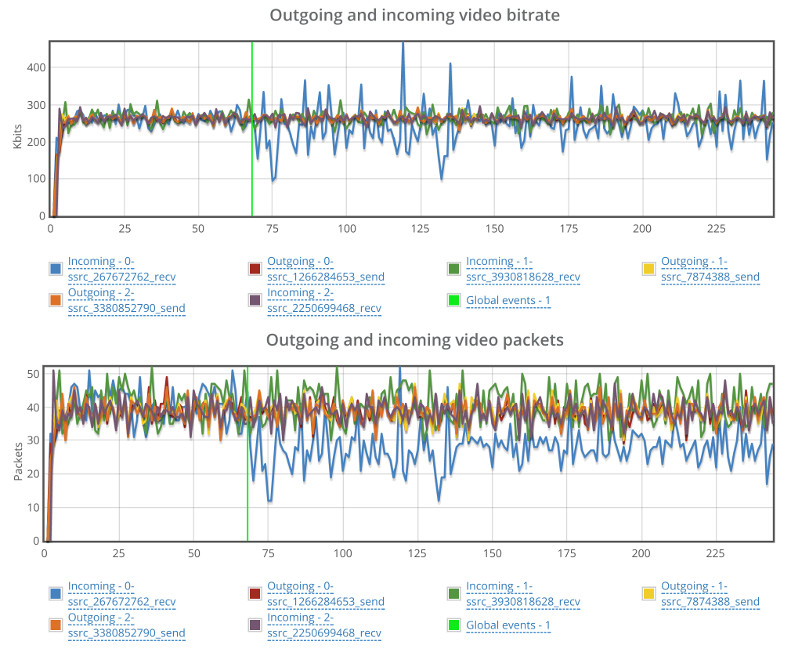
Oh – and we won’t only focus on working/not working type of scenarios. We will show you how to catch quality degradation issues of your service.

I’ll be doing it live, giving some tips and spending time explaining how our customers use our WebRTC monitoring service today – what types of problems are they solving with it.

Join me:

Creating a Kickass WebRTC Monitor Using testRTC
recording can be found here


1

We’ve Partnered Up With Frozen Mountain

Guess what? We’ve partnered with Frozen Mountain.

If you are developing a WebRTC application that is self hosted service on your own (AWS, bare metal or whatever cloud or data center), then you’ve got your hands full with work. That work includes a lot in the domain of stress testing the service, trying to size your servers and then ongoing monitoring of it.

More often than not, this would lead you to us. At testRTC we take care of your testing and monitoring needs for your WebRTC application.

And recently, we’ve seen several companies using Frozen Mountain and selecting testRTC for their WebRTC testing and monitoring needs.

Which lead to a natural next step for both companies –

We’ve now partnered.

What does that mean exactly?

It means that we know Frozen Mountain’s products and their capabilities a bit better – and guess what – Frozen Mountain knows our products and our product’s capabilities a bit better. It also means that if you’re using testRTC through Frozen Mountain, then the Frozen Mountain team can easily gain access to your test results when needed, analyze them and assist you with the issues you’re facing.

The end result? Speeding up your time from development to production.

If you are a Frozen Mountain customer, and you are looking for a testing and/or monitoring solution for your WebRTC application, then you can reach out directly to Frozen Mountain (or to us) – we’ll both be there for you to guide you through the process and make sure you end up with a better product offering with a higher quality to it.

5

Just Landed: Automated WebRTC Screen Sharing Testing in testRTC

Well… this week we had a bit of a rough start, but we’re here. We just updated our production version of testRTC with some really cool capabilities. The time was selected to fit with the vacation schedule of everyone in this hectic summer and also because of some nagging Node.js security patch.

As always, our new release comes with too many features to enumerate, but I do want to highlight something we’ve added recently because of a couple of customers that really really really wanted it.

Screen sharing.

Yap. You can now use testRTC to validate the screen sharing feature of your WebRTC application. And like everything else with testRTC, you can do it at scale.

This time, we’ve decided to take appear.in for a spin (without even hinting anything to Philipp Hancke, so we’ll see how this thing goes).

First, a demo. Here’s a screencast of how this works, if you’re into such a thing:

Testing WebRTC Screen Sharing

There are two things to do when you want to test WebRTC screen sharing using testRTC:

  1. “Install” your WebRTC Chrome extension
  2. Show something interesting

#1 – “Install” your WebRTC Chrome extension

There are a couple of things you’ll need to do in the run options of the test script if you want to use screen sharing.

This is all quite arcane, so just follow the instructions and you’ll be good to go in no time.

Here’s what we’ve placed in the run options for appear.in:

#chrome-cli:auto-select-desktop-capture-source=Entire screen,use-fake-ui-for-media-stream,enable-usermedia-screen-capturing #extension:https://s3-us-west-2.amazonaws.com/testrtc-extensions/appearin.tar.gz

The #chrome-cli thingy stands for parameters that get passed to Chrome during execution. We need these to get screen sharing to work and to make sure Chrome doesn’t pop up any nagging selection windows when the user wants to screen share (these kills any possibility of automation here). Which is why we set the following parameters:

  • auto-select-desktop-capture-source=Entire screen – just to make sure the entire screen is automatically selected
  • use-fake-ui-for-media-stream – just add it if you want this thing to work
  • enable-usermedia-screen-capturing – just add it if you want this thing to work

The #extension bit is a new thing we just added in this release. It will tell testRTC to pre-install any Chrome extensions you wish on the browser prior to running your test script. And since screen sharing in Chrome requires an extension – this will allow you to do just that.

What we pass to #extension is the location of a .tar.gz file that holds the extension’s code.

Need to know how to obtain a .tar.gz file of your Chrome extension? Check out our Chrome extension extraction guide.

Now that we’ve got everything enabled, we can focus on the part of running a test that uses screen sharing.

#2 – Show something interesting

Screen sharing requires something interesting on the screen, preferably not an infinite video recursion of the screen being shared in one of the rectangles. Here’s what you want to avoid:

And this is what we really want to see instead:

The above is a screenshot that got captured by testRTC in a test scenario.

You can see here 4 participants where the top right one is screen sharing coming from one of the other participants.

How did we achieve this in the code?

Here are the code snippets we used in the script to get there:

var videoURL = "https://www.youtube.com/tv#/watch?v=INLzqh7rZ-U";

client
   .click('.VideoToolbar-item--screenshare.jstest-screenshare-button')
   .pause(300)
   .rtcEvent('Screen Share ' + agentSession, 'global')
   .rtcScreenshot('screen share ')
   .execute("window.open('" + videoURL + "', '_blank')")
   .pause(5000)

   // Switch to the YouTube
   .windowHandles(function (result) {
       var newWindow;
       newWindow = result.value[2];
       this.switchWindow(newWindow);
   })
   .pause(60000);
   .windowHandles(function (result) {
       var newWindow;
       newWindow = result.value[1];
       this.switchWindow(newWindow);
   });

We start by selecting the URL that will show some movement on the screen. In our case, an arbitrary YouTube video link.

Once we activate screen sharing in appear.in, we call rtcEvent which we’ve seen last time (and is also a new trick in this new release). This will add a vertical line on the resulting graphs so we know when we activated screen sharing (more on this one later).

We call execute to open up a new tab with our YouTube link. I decided to use the youtube.com/tv# URL to get the video to work close to full screen.

Then we switch to the YouTube in the first windowHandles call.

We pause for a minute, and then go back to the appear.in tab in the browser.

Let’s analyze the results – shall we?

Reading WebRTC screen sharing stats

Screen sharing is similar to a regular video channel. But it may vary in resolution, frame rate or bitrate.

Here’s how the appear.in graphs look like on one of the receiving browsers in this test run. Let’s start with the frame rate this time:

Two things you want to watch for here:

  1. The vertical green line – that’s where we’ve added the rtcEvent call. While it was added to the browser who is sending screen sharing, we can see it on one of the receiving browsers as well. It gets us focused on the things of interest in this test
  2. The incoming blue line. It starts off nicely, oscillating at 25-30 frames per second, but once screen sharing kicks in – it drops to 2-4 frames per second – which is to be expected in most scenarios

The interesting part? Appear.in made a decision to use the same video channel to send screen sharing. They don’t open an additional video channel or an additional peer connection to send screen sharing, preferring to repurpose an existing one (not all services behave like that).

Now let’s look at the video bitrate and number of packets graphs:

The video bitrate still runs at around 280 kbps, but it oscillates a lot more. BTW – I am using the mesh version of appear.in here with 4 participants, so it is going low on bitrate to accommodate for it.

The number of video packets per second on that incoming blue line goes down from around 40 to around 25. Probably due to the lower number of frames per second.

What else is new in testRTC?

Here’s a partial list of some new things you can do with testRTC

  • Manual testing service
  • Custom network profiles (more about it here)
  • Machine performance collection and visualization
  • Min/max bands on high level graphs
  • Ignore browser warnings and errors
  • Self service API key regeneration
  • Show elapsed time on running tests
  • More information in test runs on the actual script and run options used
  • More information across different tables and data views

Want to check screen sharing at scale?

You can now use testRTC to automate your screen sharing tests. And the best part? If you’re doing broadcast or multiparty, you can now test these scales easily for screen sharing related issues as well.

If you need a hand in setting up screen sharing in our account, then give us a shout and we’ll be there for you.

Join us to Learn More About WebRTC in Education

Education and E-learning are one of the largest market niches that are adopting WebRTC.

It probably has to do with the no-fuss approach that WebRTC has, coupled with the ability to hook it up to different business processes. This enables education and LMS vendors to integrate WebRTC into their products directly, reducing the need to ask customers to install 3rd party apps or having to deal with multiple systems.

What we’ve seen at testRTC is a large swath of education use cases:

  • Private 1:1 tutoring lessons
  • Class-type systems, where a single teacher facilitates the learning of multiple students
  • Webinar-type services, where a few active participants get broadcasted to a larger audience
  • MOOC (Massive Open Online Course)
  • Marketplace systems, brandable sites and widgets, aggerators of courses

We’d like to share our experiences with you and show you some of these use cases and the challenges they bring to developers of such systems.

Join our Webinar on WebRTC in Education

Join us on Wednesday, December 14 at 14:30 EDT to learn more about this fascinating new frontier in real time education.

If you already have questions for us – just register to the event and place your questions on the registration page – these questions will be saved until the webinar itself.

Reserve your spot now

Check out the enhancements we’ve made to testRTC

It has been a while since we released a version, so it is with great pleasure that I am writing this announcement.

Yes. Our latest release is now out in the wild. We’ve upgraded our service on Sunday, so it is about time we take you for a quick roundup of the changes we’ve made.

#1 – Support for projects and users

This one is long overdue. Up until today, if you signed up for testRTC, you had to share your credentials with whoever was on your team to work with him on the tests. This was impossible to work with, assuming you wanted QA, R&D and DevOps to share the account and work cooperatively with the tests and monitors that got logged inside testRTC.

So we did what we should have – we now support two modes of operation:

  1. A user can be linked to multiple projects
    • So if your company is running multiple projects, you can now run them separately, having people focused on their own environment and tests
    • This is great for those who run segregated services for their own customers
    • It also means that now, a user can switch between projects with a single set of credentials in the system
  2. A project can belong to multiple users
    • Need someone to work on writing the scripts and executing them? You got it
    • Have a developer working on a bug that got reported with a link to testRTC? Sure thing
    • The IT guy who just received a downtime alarm from the WebRTC monitor we run? That’s another user
    • Each user has his own place in the project, and each is distinguished by his own credentials

testRTC project selection

If you require multiple projects, or want to add more users to your account just contact our support.

#2 – Longer, bigger tests

While theoretically, testRTC can run any test at any length and size, things aren’t always that easy.

There are usually two limitations to these requirements:

  1. The time they take to prepare, execute, run and collect results
  2. The time it takes to analyze the results

We worked hard in this release on both elements and got to a point where we’re quite happy with the results.

If you need long tests, we can handle those. One of the main concerns with long tests is what to do if you made a mistake while configuring them? Now you can cancel such tests in the middle if necessary.

Canceling a test run

If you need to scale tests to a large number of browsers – we can do that too.

We are making sure we bubble up the essentials from the browsers, so you don’t have to work hard and rummage through hundreds of browser logs to find out what went wrong. To that end, the tables that show browser results have been reworked and are now sorted in a way that will show failures first.

#3 – Advanced WebRTC analysis

We’ve noticed in the past few months that some of our customers are rather hard core. They are technology savvy and know their way in WebRTC. For them, the graphs we offer of bitrates, latencies, packet losses, … – are just not enough.

Chrome’s webrtc-internals and getstats() offer a wealth of additional information that we offered up until now only in a JSON file download. Well… now we also visualize it upon request right from the report itself:

Advanced WebRTC graphs

These graphs are reachable by clicking the webrtc_internals_dump.txt link under the Logs tab of a test result. Or by clicking the Advanced WebRTC Analytics button located just below the channels list:

Access advanced WebRTC graphs

I’d like to thank Fippo for the work he did (webrtc-dump-importer) – we adopted it for this feature.

#4 – Simulation of call drops and dynamic network changes

This is something we’ve been asked more than once. We have the capability of modeling the network of our probes, so that the browser runs with a specific configuration of a firewall or via a specific type of simulated network. We’re modifying and tweaking the profiles we have for these from time to time, but now we’ve added a script command so that you can change this configuring in runtime.

What can you do with it? Run two minutes of a test with 2 Mbps, then close virtually everything for 20-30 seconds, then open up  the network again – and see what happens. It is a way to test WebRTC in your application in dynamic network conditions – ones that may require ICE restarts.

Dynamically changing network profile in testRTC

In the test above, we dynamically changed the network profile in mid-call to starve WebRTC and see how it affects the test.

How do you use this new capability? Use our new command rtcSetNetworkProfile(). Read all about it in our knowledge base: rtcSetNetworkProfile()

#5 – Additional test expectations

We had the basics covered when it came to expectations. You could check the number and types of channels, validate that there’s some bits going on in there, validate packet loss. And that’s about it.

To this list of capabilities that existed in rtcSetTestExpectations() we’ve now added the ability to add expectations related to jitter, video resolutions, frame rate, and call setup time. We’ve also taken the time to handle expectations on empty channels a lot better.

There’s really nothing new here, besides an enhancement of what rtcSetTestExpectations() can do.

#6 – Additional information in Webhook responses

testRTC can notify your backend whenever a test or a monitor run ends on the status of that run – success or failure. This is done by configuring a webhook that is called at the end of the test run. We’ve had customers use it to collect the results to their own internal monitoring systems such as Splunk and Elastic Search.

What we had on offer in the actual payload that was passed with the webhook was rather thin, and while we’re still trying to keep it simple, we did add the leading error in that response in cases of failure:

testRTC webhook test failure response

#7 – API enabled to all customers

Yes. We had APIs in the past, but somehow, there was friction involved, with customers needing to ask for their API key in order to use the API for their continuous integration plans. It worked well, but the number of customers asking for API keys – both customers and prospects under evaluation – has risen to a point where it was ridiculous to continue doing this manually. Especially when our intent is for customers to use our APIs.

So we took this one step forward. From now on, every account has an API key by default. That API key is accessible from the account’s dashboard when you login, so there’s no need to ask for it any longer.

testRTC API key

For those of you who have been using it – note that we’ve also reset your key to a new value.

Your turn

This has been quite a big release for us, and I am sure to miss an enhancement or two (or more).

Now back to you. How would you want to test WebRTC in your product?