watchRTC is our most recent addition to the testRTC product portfolio. It is a passive monitoring service that collects events information and metrics from WebRTC clients and analyzes, aggregates and visualizes it for you. It is a powerful WebRTC monitoring and troubleshooting platform, meant to help you improve and optimize your service delivery.
It’s interesting how you can start building something with an idea of how your users will utilize it, to then find out that what you’ve worked on has many other uses as well.
This is exactly where I am finding myself with watchRTC. Now, about a year after we announced its private beta, I thought it would be a good opportunity to look at the benefits our customers are deriving out of it. The best way for me to think is by writing things down, so here are my thoughts at the moment:
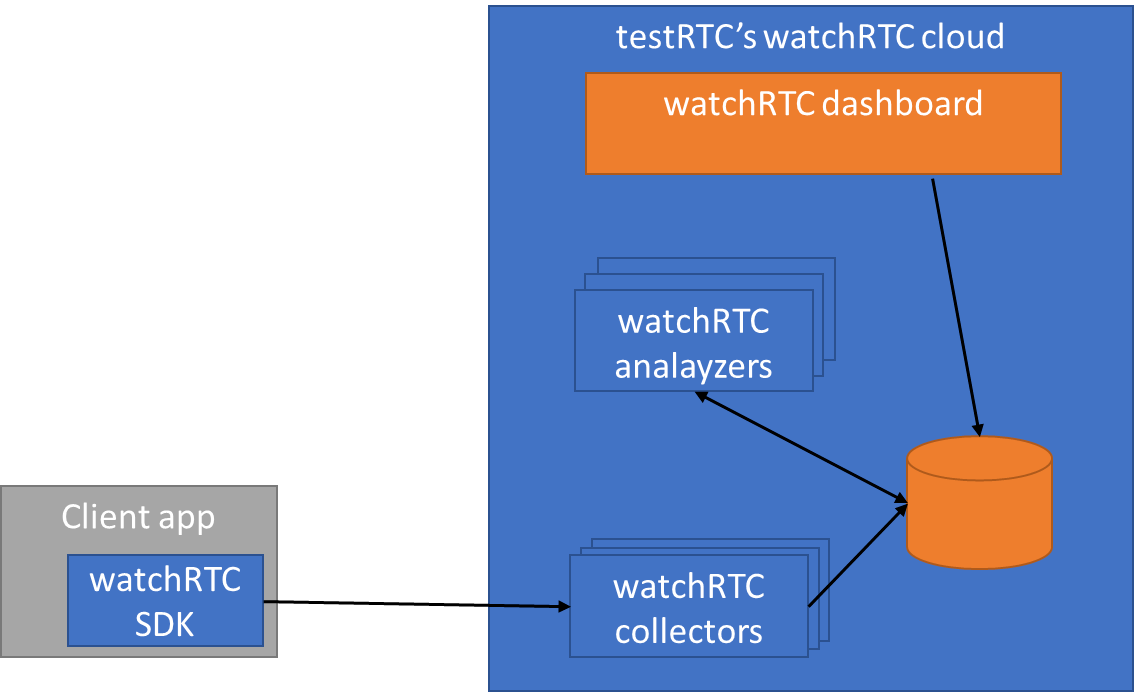
watchRTC collects WebRTC related telemetry data from end users, making it available for analysis in real time and in aggregate.
For this to work, you need to integrate the watchRTC SDK into your application. This is straightforward integration work that takes an hour or less. Then the SDK can collect relevant WebRTC data in the background, while using as little CPU and network resources as possible.
On the server side, we have a cloud service that is ready to collect this telemetry data. This data is made available in real-time for our watchRTC Live feature. Once the session completes and the room closes, the collected data can get further analyzed and aggregated.
Here are 3 objectives we set out to solve, and 6 more we find ourselves helping with:
#1- Bird’s eye view of your WebRTC operations
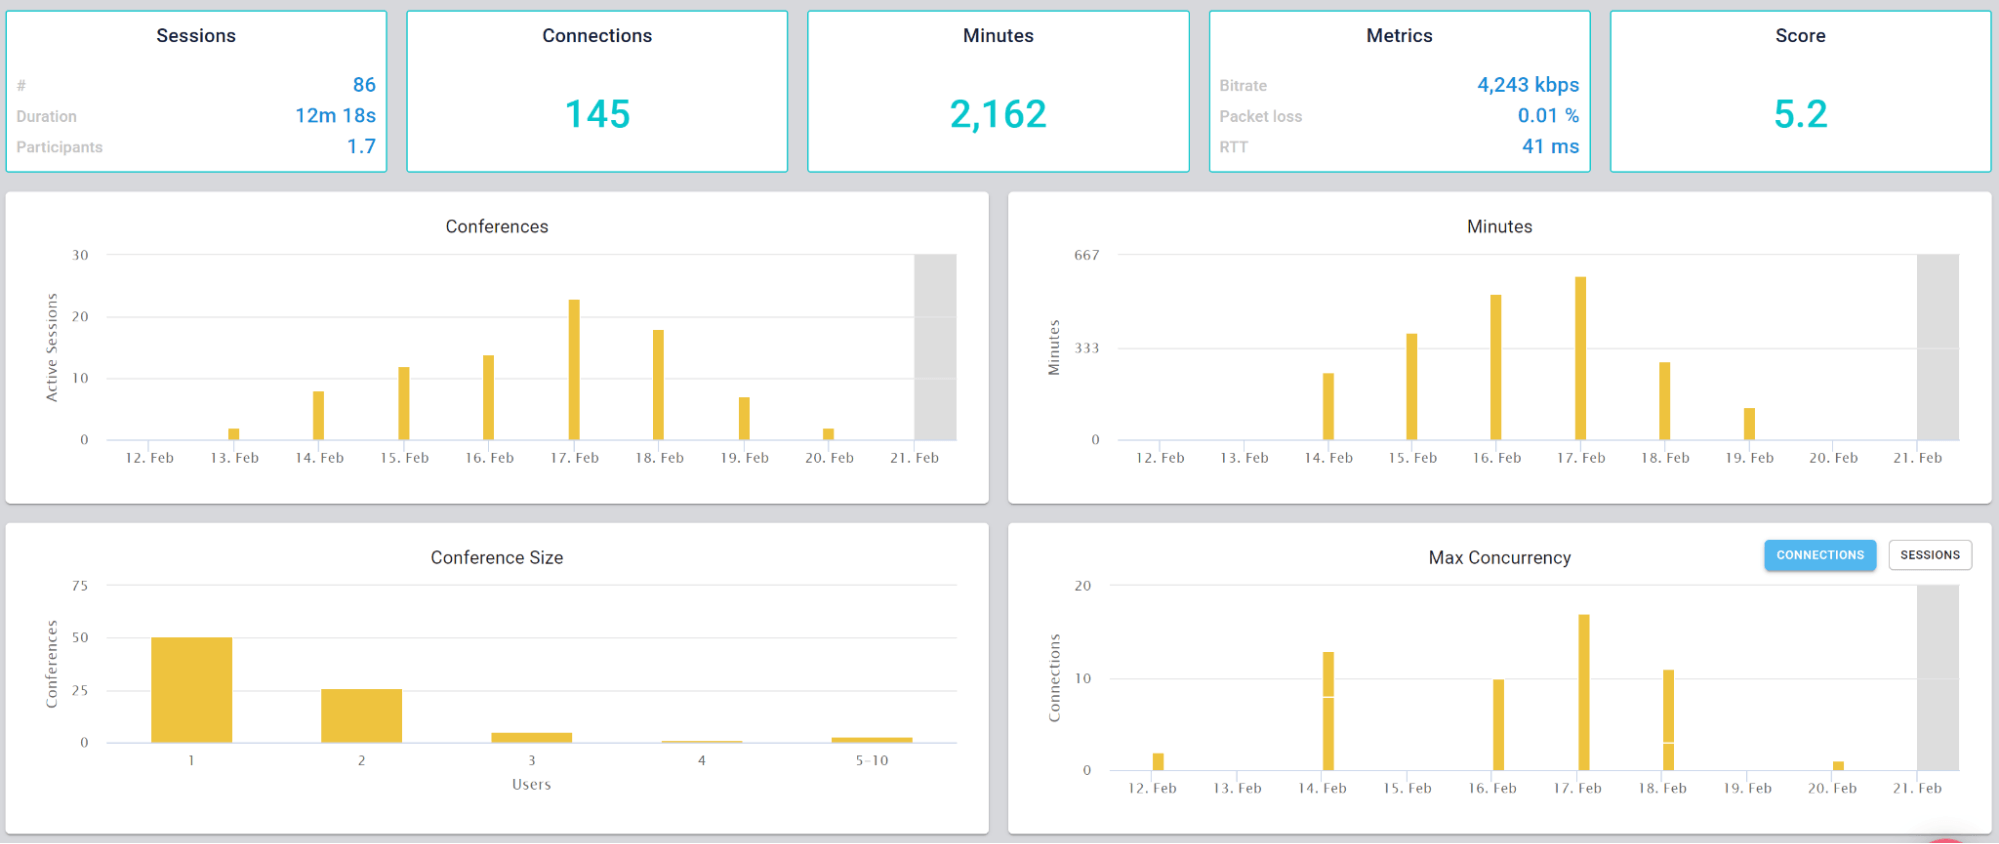
This is the basic thing you want from a WebRTC passive monitoring solution. It collects data from all WebRTC clients, aggregates and shows it on nice dashboards:
The result offers powerful overall insights into your users and how they are interacting with your service.
#2- Drilldown for debugging and troubleshooting WebRTC issues
watchRTC was built on the heels of other testRTC services. This means we came into this domain with some great tooling for debugging and troubleshooting automated tests.
With automated testing, the mindset is to collect anything and everything you can lay your hands on and make it as detailed as possible for your users to use it. Oh – and be sure to make it simple to review and quick to use.
We took that mindset to watchRTC with a minor difference – some limits on what we collect and how. While we’re running inside your application we don’t want to interrupt it from doing what it needs to do.
What we ended up with is the short video above.
From a history view of all rooms (sessions) you can drill down to the room level and from there to the peer (user) level and finally from there to the detailed WebRTC analytics domain if and when needed.
In each layer we immediately highlight the important statistics and bubble up important notifications. The data is shown on interactive graphs which makes the work of debugging a lot simpler than any other means.
#3 – Monitoring WebRTC at scale
Then there’s the monitoring piece. Obvious considering this is a monitoring service.
Here the intent is to bubble up discrepancies and abnormal behavior to the IT people.
We are doing that by letting you define the thresholds of various metric values and then bubbling up notifications when such thresholds are reached.
Now that we’re past the obvious, here are 5 more things our clients are doing with watchRTC that we didn’t think of when we started off with watchRTC:
#4 – Application data enrichment and insights
There’s WebRTC session data that watchRTC collects automatically, and then there’s the application related metadata that is needed to make more sense out of the WebRTC metrics that are collected.
This additional data comes in different shapes and sizes, and with each release we add more at our clients request:
Share identifiers between the application and watchRTC, and quickly switch from one to the other across monitoring dashboards
Add application specific events to the session’s timeline
Map the names of incoming channels to other specific peers in a session
Designate different peers with different custom keys
The extra data is useful for later troubleshooting when you need to understand who the users involved are and what actions have they taken in your application.
#5 – Deriving business intelligence
Once we started going, we got these requests to add more insights.
We already collect data and process it to show the aggregate information. So why not provide filters towards that aggregate information?
Starting with the basics, we let people investigate the information based on dates and then added custom keys aggregation.
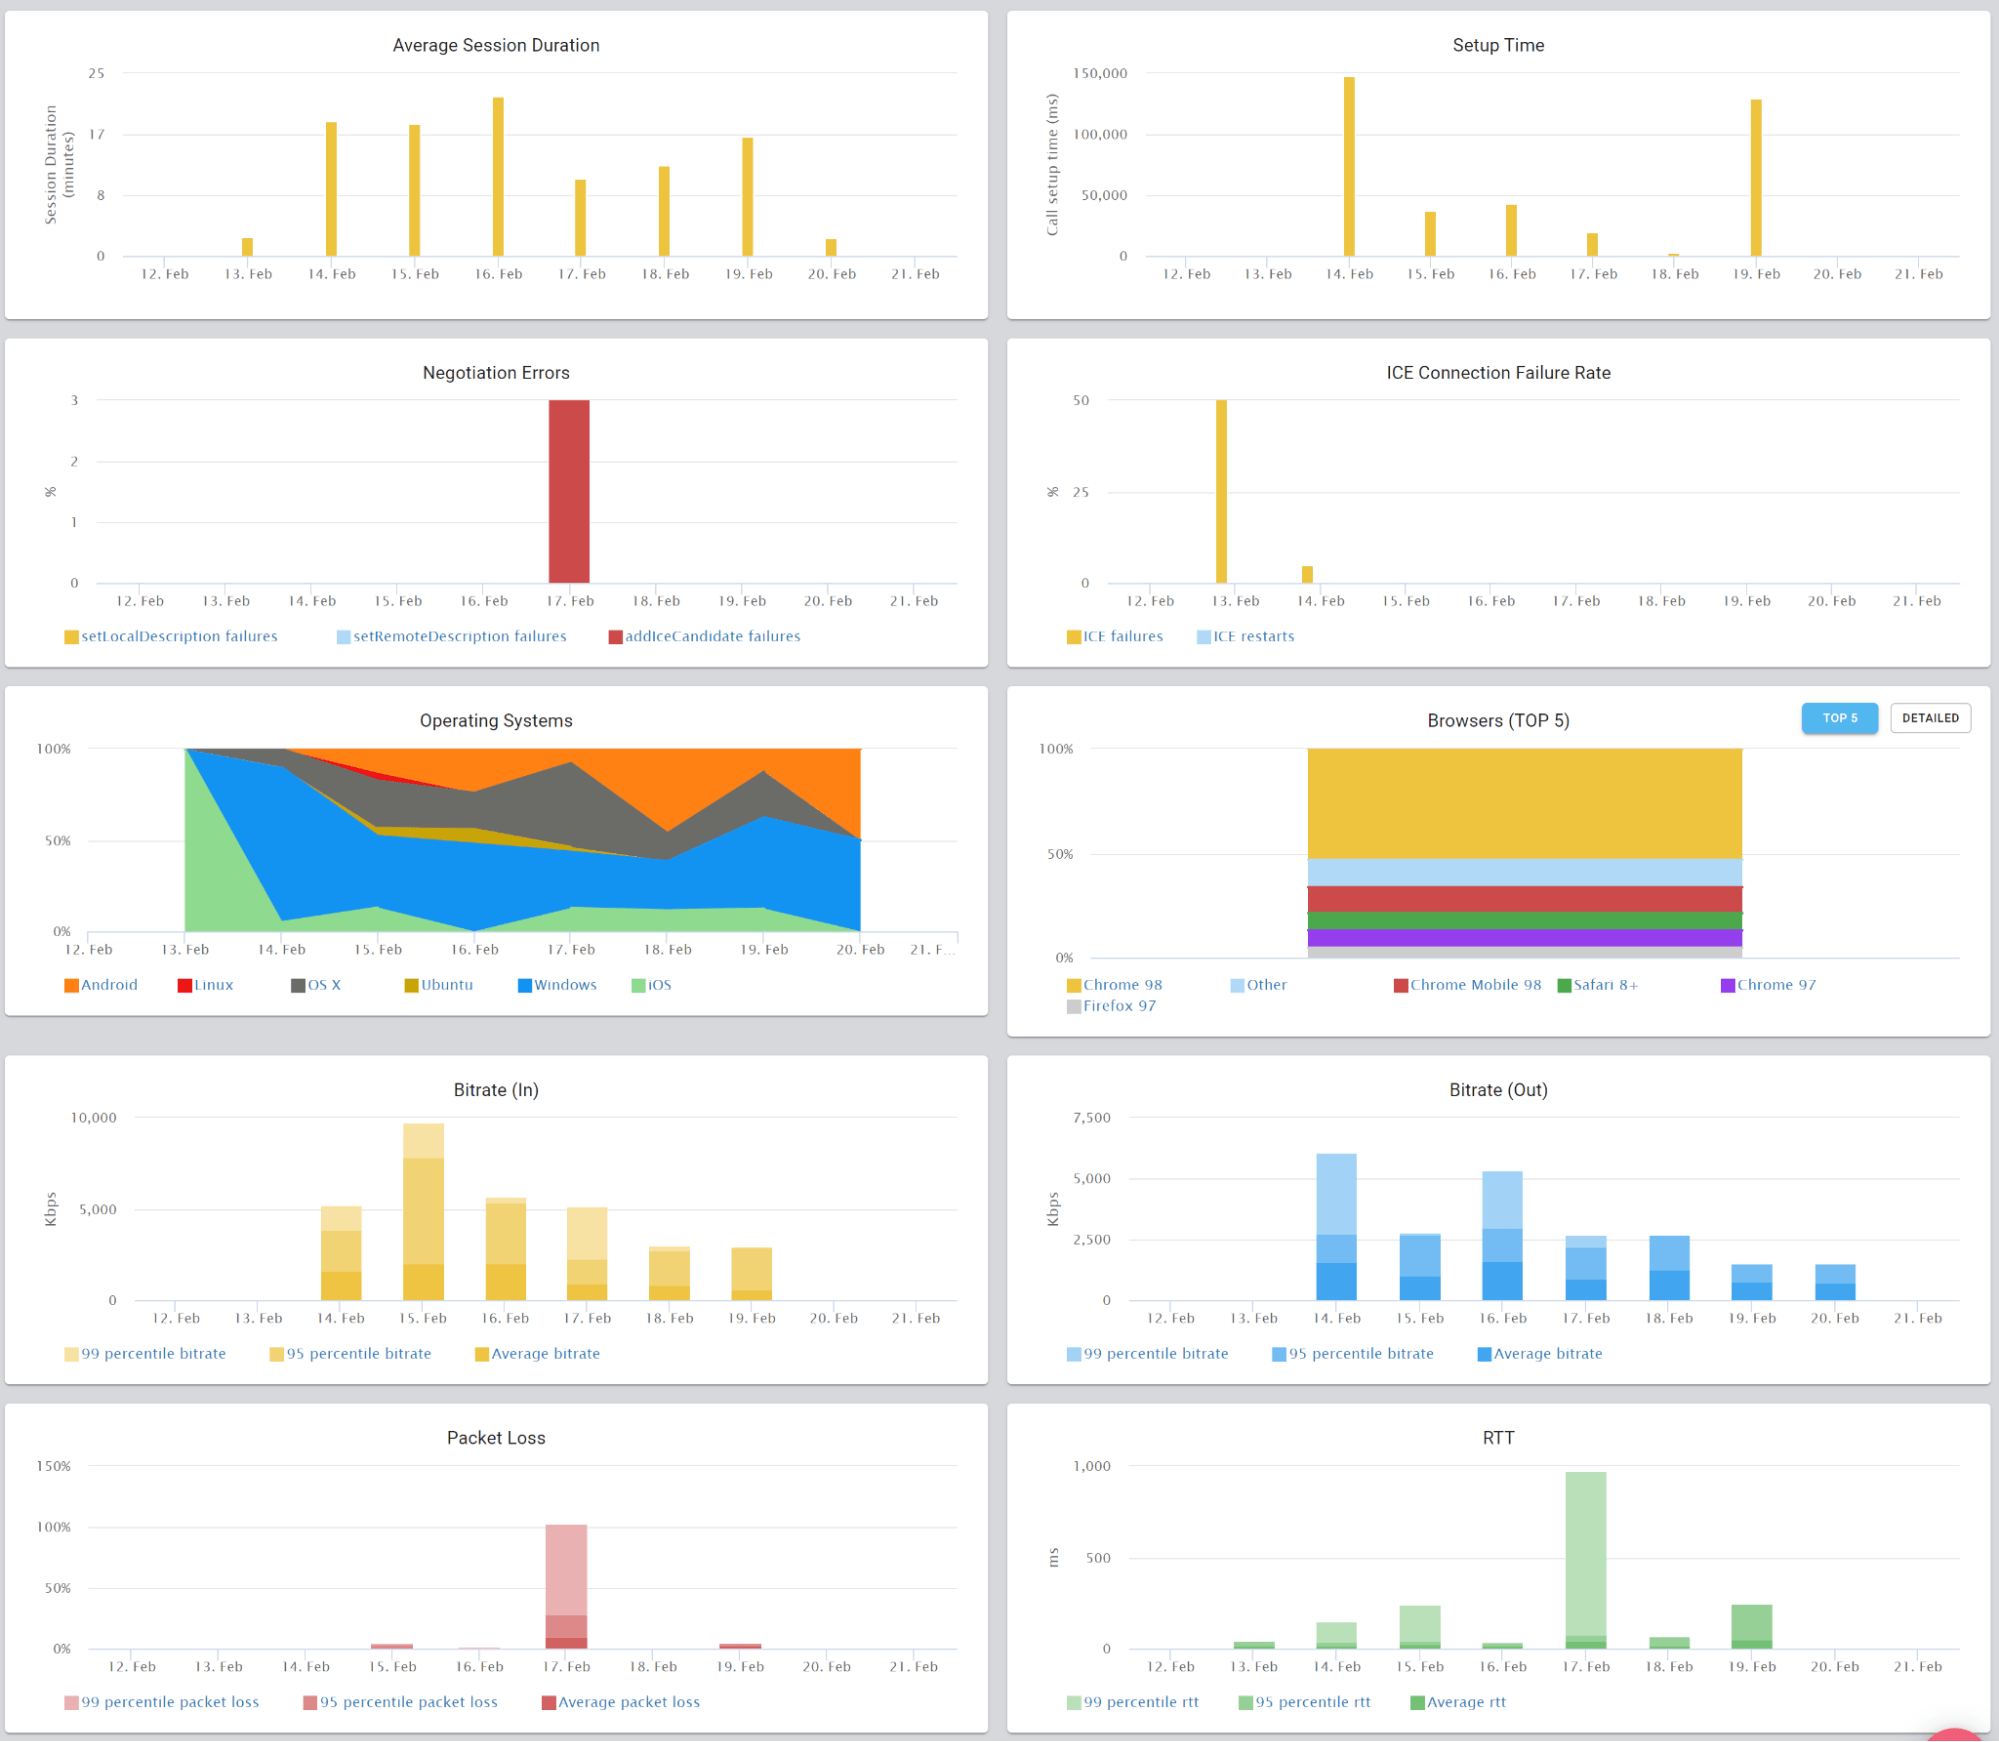
Now? We’re full on with high level metrics – from browsers and operating systems, to score values, bitrates and packet loss. Slice and dice the metrics however you see fit to figure out trends within your own custom population filters.
On top of it all, we’re getting ready to bulk export the data to external BI systems of our clients – some want to be able to build their own queries, dashboards and enrichment.
#6 – Rating, billing and reporting
Interestingly, once people started using the dashboards they then wanted to be able to make use of it in front of their own customers.
Interestingly, not all vendors are collecting their own metrics for rating purposes. Being able to use our REST API to retrieve highlights for these, and base it on the filtering capabilities we have, enables exactly that. For example, you can put a custom key to denote your largest customers, and then track their usage of your service using our APIs.
Download information as PDFs with relevant graphs or call our API to get it in JSON format.
#7 – Optimization of media servers and client code
For developers, one huge attraction of watchRTC is their ability to optimize their infrastructure and code – including the media servers and the client code.
By using watchRTC, they can deploy fixes and optimizations and check “in the wild” how these affect performance for their users.
watchRTC collects every conceivable WebRTC metric possible, optimization work can be done on a wide range of areas and vectors as the results collected capture the needed metrics to decide the usefulness of the optimizations.
#8 – A/B testing
With watchRTC you can A/B test things. This goes for optimizations as well as many other angles.
You can now think about and treat your WebRTC infrastructure as a marketer would. By creating a custom key and marking different users with it, based on your own logic, you can A/B test the results to see what’s working and what isn’t.
It is a kind of an extension of optimizing media servers, just at a whole new level of sophistication.
#9 – Manual testing
If you remember, our origin is in testing, and testing is used by developers.
These same developers already use our stress and regression testing capabilities. But as any user relying on test automation will tell you – there are times when manual testing is still needed (and with WebRTC that happens quite a lot).
The challenge with manual testing and WebRTC is data collection. A tester decided to file a bug. Where does he get all of the information he needs? Did he remember to keep his chrome://webrtc-internals tab open and download the file on time? How long does it take him to file that bug and collect everything?
Well, when you integrate with watchRTC, all of that manual labor goes away. Now, the tester needs only to explain the steps that caused the bug and add a link to the relevant session in watchRTC. The developer will have all the logs already there.
With watchRTC, you can tighten your development cycles and save expensive time for your development team.
watchRTC – run your WebRTC deployment at the speed of thought
One thing we aren’t compromising with watchRTC is speed and responsiveness. We work with developers and IT people who don’t have the time to sit and wait for dashboards to load and update, therefore, we’ve made sure and are making it a point for our UI to be snappy and interactive to the extreme.
From aggregated bird’s eye dashboard, to filtering, searching and drilling down to the single peer level – you’ll find watchRTC a powerful and lightning fast tool. Something that can offer you answers the moment you think of the questions.
If you’re new to testRTC and would like to find out more we would love to speak with you. Please send us a brief message, and we will be in contact with you shortly.
Conducting a WebRTC test is challenging, but the devil is in the details. testRTC’s cloud WebRTC testing and validation platform that scales with ease.
Testing WebRTC applications is challenging. From simple 1:1, through figuring out how to optimize for large group video calls to live broadcasts to thousands of participants or more; what you will immediately notice is the need for simple and powerful automation. Unlike other web technologies, WebRTC brings with it three unique characteristics:
WebRTC is a resource hog. This translates into complexities in allocating resources when conducting large scale tests
Highly interactive. A scenario involving multiple people requires multiple people, making scaling tests with a single human tester virtually impossible
Deciding success or failure using common web metrics is useless. WebRTC comes with its own set of metrics that needs to be gathered and analyzed
With the increasing demand of remote communications and collaboration, the use of WebRTC has significantly grown and skyrocketed. From a niche technology it is now mission critical for many organizations and people around the world.
testRTC has identified this need in 2015, investing in the creation of a self service, best in class platform for testing WebRTC at scale and on demand.
WebRTC testing is part web part VoIP in nature. On the one hand, you need to test a web-based application. On the other hand, you need to test a VoIP service.
This intersection of worlds brings with it a need to use innovative testing techniques that merge the best of both worlds.
As with any other kind of software testing, you will need to adopt the use of both manual and automated testing.
Manual testing offers the flexibility and intelligence of humans. This makes a lot of sense in WebRTC application augmen testing, simply because humans are the ones that directly interact with the service being tested autm. With manual testing it is important to use tools that enable us to easily collect and analyze WebRTC metrics. These speed up the testing process as well as make it more effective.
Automated testing offers the power of speeding up the testing process considerably and to evaluate scenarios that are impossible to achieve with manual testing, such as instantiating and validating hundreds or thousands of participants in a session. Without the use of automated testing, you end up relying mostly on your users to tell you what is broken with your application.
How to test WebRTC?
You can conduct WebRTC tests manually or in an automated fashion. In both approaches, there are a lot of moving parts you need to take into account.
Device resources
The most obvious aspect of testing WebRTC is the client side. WebRTC runs on various browsers and devices. Depending on your application, you will need to write down the list of combinations of devices your users might be using and focus on testing on these devices.
On each device, make sure to look at the CPU and memory consumption of your WebRTC application in real life scenarios. This will give you an indication of how your users are going to experience your service.
When growing the number of participants in a single group video call for example, it is important to test these, since in many cases, that is where your bottleneck of scalability is going to be.
👉 Validate that you dynamically change your application’s behavior to cater for the many different devices and the available resources they have.
Server-side infrastructure
With WebRTC, there are different types of servers that are used: signaling servers, media servers and STUN/TURN servers.
You need to make sure to test how these servers operate under stress and over long periods of time, conducting soak tests. Make sure to test for CPS – how many “calls” per second your service can handle. In most cases, trying to connect 1,000 users to your service in the exact same second is going to fail.
Find out what is the breaking point of your infrastructure – it might be CPU utilization, but in many cases, it will be pure network traffic – the number of packets certain servers can process (see also our article: Network Jitter).
👉 Check out below how convenient stress testing can be:
Network conditions
Networks aren’t static. They vary and fluctuate over time. You can start a session with a great network with pristine conditions only to see it degrade a minute later.
Some of the tests you will need to conduct are in these areas exactly. Figuring out if your application can cope with the dynamic nature of the network. Here you should check how quickly your media servers return to high bitrate and high frame rate operation after having some rough time of low bitrate or high packet loss.
Check how does the media server cope with different types of networks – multiple users joining over different network conditions – does each get the treatment and video streams he needs or does the service degrade to lowest common denominator?
👉 Your WebRTC application may work great at peak network performance, but you need to make sure it operates well where packet losses and bandwidth restrictions are a fact of life.
User behavior
There are two aspects here.
The first one, is that no matter the amount of automation and sophistication you plan on using, human behavior with an interactive WebRTC service is going to surprise you. You will need real people to test your service. Sad but true.
That said, there are areas where human testers don’t cut it for your testing. Consider this: In a session of 10 users, each user enters the session at his own laisure. Usually not at exactly the same time. What happens when meetings are larger? Or when your service grows?
There will be times when multiple users will actually try to join simultaneously. At the same time. To the same session. Or to separate sessions.
Test and validate for that. WebRTC services that seem to work really well often break if 100 or more browsers are trying to connect to them at the exact same instance in time.
Tools for WebRTC testing
For the most part, you will need to use more than a single WebRTC testing tool to provide better coverage of the necessary tests.
When you decide on which WebRTC testing tool to use, take into consideration the following aspects of the tool:
#1 – WebRTC traffic generation
First and foremost, a WebRTC testing tool should be able to generate WebRTC traffic.
Since WebRTC relies on external signaling protocols, this can be tricky at times.
Make sure that your testing tool is:
Capable of supporting the signaling protocol you use for WebRTC
Generates traffic that is as close as possible to the way your application behaves. This usually boils down to a tool that automates a browser instead of generates its own synthetic, pre-encoded traffic
Simulates various network conditions, to be able to test your WebRTC media servers and TURN servers properly, and as close as possible to real-life conditions
Grows dynamically to meet your needs as the size of the tests grow on your end. Especially when you conduct sizing or stress testing
Up to date when it comes to its WebRTC implementation. WebRTC behavior gets updated once a month or two, with each browser version release. Your WebRTC traffic generation tool needs to keep pace with these changes
Generating traffic is where many of the WebRTC testing tools focus today. This is done in one of two main techniques:
Using browser automation, building on top of Selenium for example, and relying on the browsers to handle and manage all WebRTC traffic on its own
Creating synthetic, pre-encoded traffic (or just echoing back what is received). A technique that is used mostly in large scale tests where hundreds of thousands of streams need to be tested and it becomes too expensive to use browsers
#2 – Users simulation
When you generate WebRTC traffic, be sure to think about user behavior as well.
In many cases, WebRTC sessions aren’t symmetric: one user takes the role of a lecturer, while the others are students. In other cases, you may have a few speakers in a discussion that is being streamed to a larger audience.
The tool you use should be powerful enough to handle different roles in a test scenario. Even within a symmetric WebRTC group video call, you will want to test screen sharing, which means there is now a role of a presenter within that group.
Giving roles should be an available option not only in what the user “does”, but also in how the user’s “machine” behaves and of how data is analyzed.
👉 At testRTC we offer powerful role assignment and synchronization mechanisms across the users that join a test, making orchestrating scenarios simple to manage.
#3 – Data collection
Now that we’ve generated traffic in WebRTC, designated roles to the various streams, the time has come to collect the data.
With WebRTC, there are a lot of data points that can be useful:
Console logs
WebRTC internal dumps
WebRTC metrics
Machine performance statistics
Screenshots
…
The more the tool you use is capable of collecting, the higher the possibility that you will be able to pinpoint and troubleshoot potential problems faster.
👉 At testRTC we collect everything and anything that we believe is useful for your debugging and analysis of WebRTC sessions. This include all WebRTC API calls and metrics, as well as console logs, machine performance data, screenshots and even optional trace routes and network log files
#4 – Analysis and visualization of WebRTC metrics
Have you ever tried looking at a webrtc-internals dump file?
This file is the first line of defence developers have in their bug squashing efforts with WebRTC. And yet, reading it is challenging.
Make sure the tool you use makes a better job of analyzing and visualizing WebRTC metrics. Things to look for in a WebRTC testing tool:
Collect and visualize webrtc-internals dumps
Ability to collect WebRTC metrics and analyze them without webtrc-internals (they aren’t always available)
Aggregate as well as drill down analysis of data from large number of users
Mechanisms to pinpoint outliers and failed streams easily
Define failure criteria to figure out easily pass/fail status of your tests
Drill down capabilities, going from a high level view down to the minute details of the results captured
👉 The more data at your disposal, the better suited you will be to debug and solve issues, but the harder it will be to read and analyze the results without a testing tool’s guidance.
#5 – Level of maintenance
As stated earlier, WebRTC is a work in progress. It is always changing.
Be sure that the WebRTC testing tool you use is well maintained and gets frequently updated and upgraded.
Today’s requirements are vastly different than last year’s requirements, as we are working with a technology that is currently in high demand with a lot of market focus and competition.
Things to consider when it comes to the maintenance work necessary for a WebRTC testing environment:
Upgrading browsers frequently
Dealing with browser automation tools upgrades (they should be aligned with the browser releases)
WebRTC depracations, changes and additions
👉 With testRTC these are things you won’t need to be dealing with, as it is part of our job to stay up to date with the most recent developments of WebRTC technology.
Types of WebRTC tests
When conducting tests of WebRTC applications, there are certain areas we need to be aware of – certain test types we should consider covering in our test plan. Here are the major areas.
End-to-end WebRTC testing
In most cases, you won’t need to test the WebRTC implementation itself. That’s up to the browser vendors to handle, along with their own WebRTC interoperability testing.
If you are using third party media servers or a CPaaS vendor, then you may or may not find focusing on testing that layer important to you. I find that different vendors and individuals have different opinions here.
What you should do is make sure to do end-to-end testing. Such tests encompass your whole application logic, and your focus there should be in validating the intersection points between WebRTC and the application logic.
P2P testing
If your application supports peer-to-peer, then there are no media servers to contend with. It makes some of the tests simpler to manage and conduct.
Things to validate with P2P:
Sizing and stress for your TURN servers and signaling servers
Different firewall configurations
For mesh based group scenarios (if you do them), you’ll want to invest a lot of time on testing, polishing and optimizing the experience
Call center WebRTC testing
Call centers require special care and attention when it comes to WebRTC testing. There are many reasons for this:
One leg of the calls reside in WebRTC while the other in PSTN or SIP
Stress testing is prime focus, as call centers already operate at scale and just need to validate that WebRTC doesn’t mess things up. This is doubly true for those who transcode Opus to G.711 or G.729 in the process
Stress testing for WebRTC
An important aspect of testing in WebRTC is stress testing. This is done to figure out the answer to one of the following 3 questions:
How much load can my server handle? This question is asked mainly about media servers and TURN servers
Does my load balancer work properly? This is the second order question, as many services require to load balance across multiple media servers
Can my application handle X users/rooms/sessions in parallel? This goes to check the service as a whole
Depending on how you operate your service and its scale, you will be asking one or more of these questions.
If you are interested to learn more on how our clients use our service, read these case studies:
A big chunk of what vendors do with WebRTC is group calls. Be it video or voice only calls, these are quite challenging to test. Getting enough real people to join a group call to be able to test it takes time and synchronization, and then being able to figure out and troubleshoot issues is close to impossible – especially when you can’t really know what is the quality of the network or the device the users have.
When dealing with WebRTC group calls, you will need to work hard on optimizing for the size of the group you wish to support – be it 10 users, 49 users in a gallery view, 100 users or larger groups.
Towards that goal, you need to use automation tools capable of the following:
Stable and predictable machines and networks to run with
Configurable networks, to test in varying conditions, dynamically controllable by you
Detailed visual analysis of the results, to ease your understanding of the test results
Test users coming in from different locations
Live broadcast testing
With live broadcasts you have a small number of broadcasters (publishers) and a larger number of viewers (subscribers). The challenge with many solutions is that they don’t offer video transcoding in the cloud and even if they do, you need to validate that it is being used properly.
In such a case, the following types of tests are necessary:
Stress the media servers at scale, with many viewers
Bring viewers from different geographies
Configure viewers with different network conditions
Dynamically change network conditions for some of the viewers
What you are looking for here is to understand the overall quality of the solution and to validate that viewers with poor connections don’t cause other viewers to have a poor experience as well.
Mobile testing for WebRTC
Mobile testing in WebRTC poses quite a challenge. The main problem here is the lack of proper automation – using cloud based solutions means that what’s in front of the mobile device’s camera is a static image at best or too dark to be useful. That’s because mobile devices are placed in racks inside data centers for this purpose.
You will be able to automate some of your testing, but the nuanced parts of media quality will be hard to achieve with automation.
There are 3 areas of testing you will need to handle:
Network. Understanding how mobile networks and devices affect your infrastructure. These types of tests can be simulated and automated without the use of actual mobile devices
Devices. Test against different devices and brands. Either through cloud automation or crowdsourced testing
Application. This can use cloud automation in the same way that other mobile applications use
Browser testing
Browser testing with WebRTC can either be done manually or automated locally.
There are 4 main browsers: Chrome, Safari, Firefox and Edge.
Many vendors resort to manual testing of the applications across browsers due to the frequent UI changes they are making or because of the complexity of automating testing of WebRTC across browsers. At testRTC, we offer automated testing for Chrome and Firefox at the moment – especially since our focus to date has been infrastructure testing.
Things to keep in mind while testing browsers:
Test multiple versions of each browser, as you will bump into them in the wild
Make sure to test in front of the beta releases to catch upcoming issues
Component testing
WebRTC has many moving parts: browsers, devices, application servers, web servers, TURN servers, media servers. And we haven’t even gotten to listing other infrastructure components such as databases and load balancers.
At times it is important to test each component separately. With WebRTC, that is mostly focused on TURN servers or media servers.
In such cases, you may even want to create simple dedicated web pages that can be used to test these components so as not to have to go through your whole application logic.
Advantages of WebRTC test automation
Testing WebRTC applications is different from testing other web applications:
WebRTC requires considerably more resources on the client and server side than most web applications
A WebRTC application is more sensitive and susceptible to network conditions and available device resources
In most WebRTC applications, there needs to be high synchronization of a test scenario across multiple devices and browsers
Metrics required to understand if a test is successful or not are very different in WebRTC than in other web applications
Relying on manual testing means that a lot of the predictability and observability of the tests conducted is lost. Automation of WebRTC tests, if done correctly and with the appropriate tools can greatly enhance the stability of your application.
Designing WebRTC tests that scale
There are several things you need to take care of when designing your application for WebRTC tests that scale. If you don’t do them early on, then adding them later can be challenging.
Here are some best practices for designing scale into your WebRTC automation testing:
Have the ability to configure test accounts for mock users with no captcha, OTP or 2FA on them. These are challenging to automate
Create scripts that can generate as many pre-configured test accounts as needed. Doing this manually is going to be daunting, time consuming and error prone
Prepare in advance an option to reduce the number of steps required in the UI to reach the media testing itself. Scheduling, form filling, and excessive selections and button clicking can all increase false positives in large stress tests for WebRTC
Design your test script to scale in 2 axis: number of total participants and number of participants in a single session. This will give you more flexibility in your testing
Have the ability to define different CPS (Calls Per Second) values, so that you can throttle and pace the entry of participants in large tests to fit your requirements
Make it easy to run stress tests. If it takes you more than a few minutes to prepare and start running for a large stress test then you are doing it wrong
Collect the metrics important to you from the test. You want to be able to understand the results quickly and be able to easily compare them with past test runs
testRTC service and how we can help
testRTC offers a self service platform for conducting WebRTC testing.
Our clients use us in a myriad of ways, anywhere from assisting them in manual testing, through continuous integration & regression testing up to large scale stress testing.
At the heart of the WebRTC testing service of testRTC there are 3 main technologies:
Geographically spread browser automation at scale
WebRTC metrics collection capabilities
Visual and programmable analysis of WebRTC test results
We are continuously investing in each of these areas to make sure our clients can efficiently create, run and analyse their test scenarios in the quickest and simplest way.
You can create an evaluation account and start testing your WebRTC application now:
WebRTC has grown in recent years from a niche technology to an important piece of the fabric of the internet and of our communication toolkit. If you are developing products with WebRTC, it is paramount that you treat it like the first class citizen that it is in your testing as well.
This time, I want to do a quick recap on a webinar we hosted last week. It dealt with monitoring WebRTC applications, and as is usual, we took the approach of doing a demo.
For this one, I’ve prepared for over a month. I’ve created 3 separate monitors, running on AppRTC, appear.in and Jitsi Meet.
Why did I pick these 3 services?
They are all public, and don’t throttle or cap you in how they work (a lot of demos out there do that)
They are quite different from one another, yet similar at the same time (not sure if that means anything, but it feels that way)
AppRTC is used by many to build their first application, and it is Google’s “hello world” application for WebRTC (it is also unstable, which is a lot of fun monitoring)
appear.in and Jitsi are widely known and quite popular. They are also treated as real services (where AppRTC is merely a demo)
What was the scenario I used?
Create a meeting URL (either ad-hoc or predefined)
Join the URL
Wait for 2 full minutes so we have data to chew on
Run the above every 15 minutes for a period of a bit over a month
Connecting the dots
I wanted to show a bit more than what you see in the testRTC dashboard. Partly out of curiosity but also because many of our monitoring customers do just that – connect the results they get from testRTC’s monitor runs in their own applications.
So I took this approach:
I’ve created a Google Sheet to collect all the results.
In Zapier, I then created a Webhook that collected the results into that Google Sheet.
In testRTC, I’ve configured a webhook to connect to Zapier.
10,000 monitor runs later… there was enough data to chew on.
Initial insights
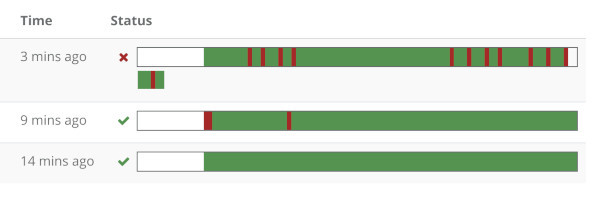
Here’s how the data looks like on the testRTC dashboard:
The first row? AppRTC. It fails every once in awhile for 2+ hours at a time.
Jitsi had a few hiccups. appear.in was almost flawless.
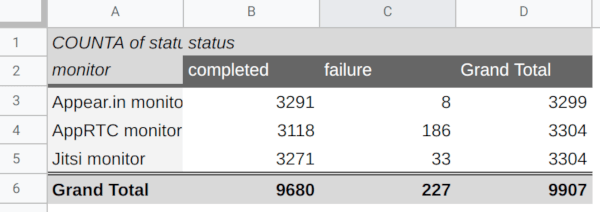
Here’s what happened when I created a quick pivot table of it on my Google Sheet:
I’ve showed that during the webinar as well, checking out the various services fair with maintaining stable quality throughout the month. Interestingly, they behaved rather differently from one another.
Watch the webinar to learn more about it.
The webinar and demo
Most of the webinar was a long demo session. You can view it all here:
Lots of the work our customers do involved automation. They write scripts to automate testing and then they want to automate running these scripts when needed. This usually means running a nightly build, on code check in, etc.
testRTC caters to that through a simple to use API, which is what I’ll be demoing in the next webinar. And I won’t be doing it alone – I’ll be joined by Gustavo Garcia of Houseparty. Gustavo was one of our first customers to make use of our APIs in such a way.
Earlier this week, we hosted our first webinar in 2019, something we hope to do a lot more (once a month if we can keep it up). This time, we focused on network behavior of SFU media servers.
One of the things we’ve seen with our customers is that different SFUs differ a lot in how they behave. You might not see that much when the network is just fine, but when things get tough, that’s when this will be noticed. This is why we decided to dedicate our first webinar this year to this topic.
There was another reason, and that’s the fact that testRTC is built to cater exactly to these situations, where controlling and configuring network conditions is something you want to do. We’ve built into testRTC 4 main capabilities to give you that:
#1 – Location of the probes
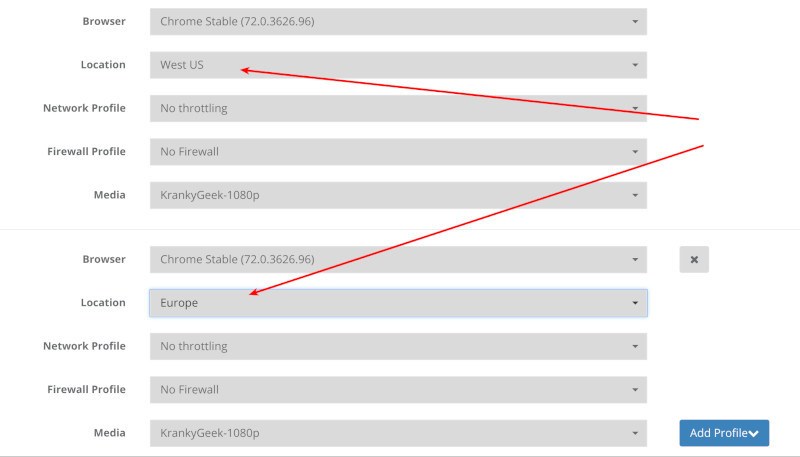
With testRTC, you can decide where you want the probes in your test to launch from.
You can use multiple locations for the same test, and we’re spread wider than what you see in the default UI (we give more locations and better granularity for enterprise customers, based on their needs).
Here’s how it looks like when you test and launch a plan:
In the above scenario, I decided to use probes coming from West US and Europe locations.
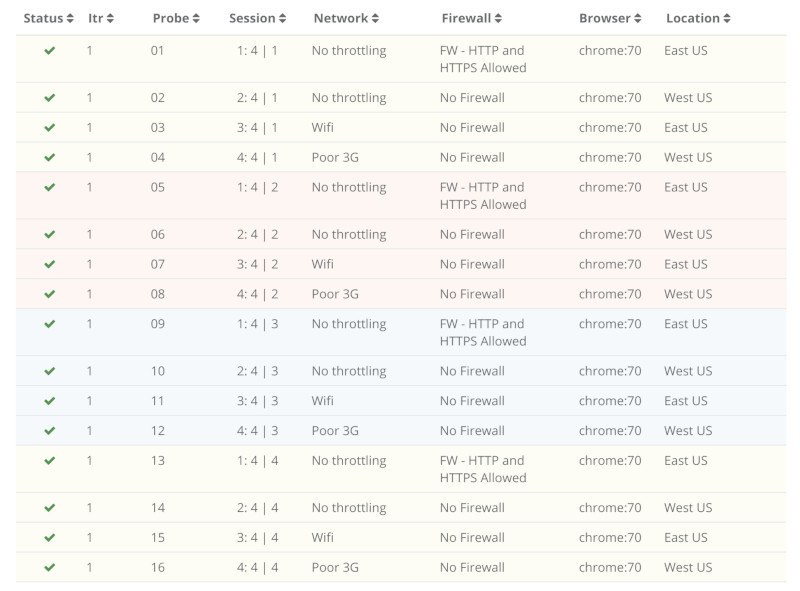
Here’s how I’ve spread a 16-browsers test in the webinar yesterday:
This allows you to test your service from different locations and see how well you’ve got your infrastructure laid out across the world to meet the needs of your customers.
It also brings us to the next two capabilities, since I also configured different networks and firewalls there:
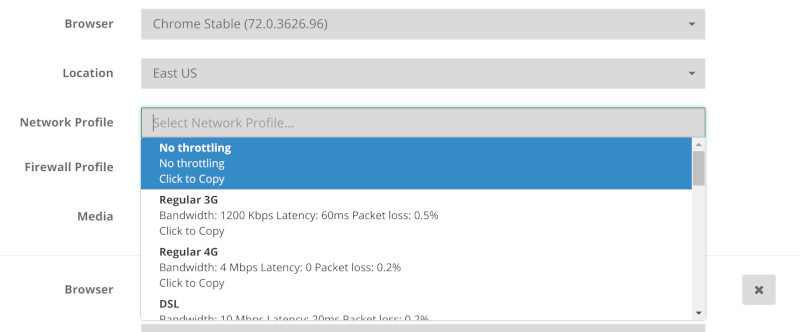
#2 – Configuration of the probe’s network
Need to check over Wifi? 3G? 4G? Add some packet loss to the network indicating you want a bad 4G network connection? How about ADSL?
We’ve got that pre-configured and ready in a drop down for you.
I showed how this plays out when using various services online.
#3 – Configuration of the probe’s firewall
You can also force all media to be relayed via TURN servers by blocking UDP traffic or even block everything that isn’t port 443.
This immediately gives you 3 things:
Know if you’ve got TURN configured properly
The ability to stress test your TURN servers
See what happens when media gets routed over TCP (it is ugly)
#4 – Dynamically controlling the probe’s network conditions
Sometimes what you want is to dynamically change network conditions. The team at Jitsi dabbled with that when they looked at Zoom (I’ve written about it on BlogGeek.me).
We do that using a script command in testRTC called .rtcSetNetworkProfile() which I’ve used during the webinar – what I did was this:
Have multiple users join the same room
They all stay in the room for 120 seconds
The first user gets throttled down to 400kbps on his network after 30 seconds
That lasts for 20 seconds, and then he goes back to “normal”
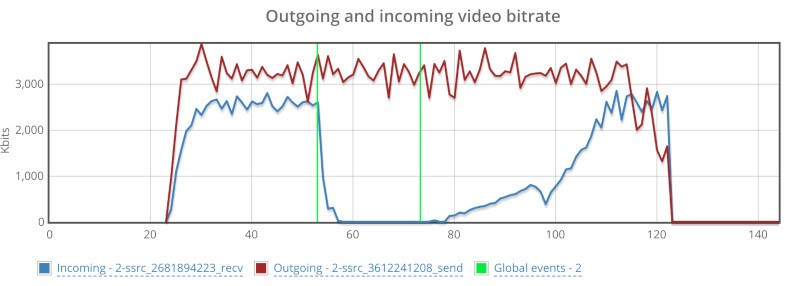
It looks something like this when see from one of the other user’s graphs:
The red line represents the outgoing bitrate, which is just fine – it runs in front of the SFU and there’s no disturbance there on the network. The blue line drops down to almost zero. And takes some time to recuperate.
The webinar and demo
Most of the webinar was a long demo session. You can view it all here:
Here’s a kicker – I’ve started working on our next webinar about a month ago. It was to do with monitoring and the things we can do there. I even have 3 monitors running for that purpose only for a month now:
That first one with the reds in it? That’s AppRTC… and it failed. At the time that we did our webinar on network testing. And I planned to use it to show some things. So I reverted to showing results of test runs from a day earlier.
Anyways, monitoring is what our next webinar is about.
I am going to show you how to set it up and how to connect it to third party services. In this case, it will be Zapier and Google Sheet where more analysis will take place.
As we head into 2019, I noticed that we haven’t published much around here. We doubled down on helping our customers (and doing some case studies with them) and on polishing our service.
In the recent round of updates, we added 3 very powerful capabilities to testRTC that can be used in both monitoring and testing, but make a lot of sense for our monitoring customers. How do I know that? Because the requests for these features came from our customers.
Here’s what got added in this round:
1. HAR files support
HAR stands for HTTP Archive. It is a file format that browsers and certain viewer apps support. When your web application gets loaded by a browser, all network activity gets logged by the browser and can be collected by a HAR file that can later be retrieved and viewed.
Our focus has always been WebRTC, so collecting network traffic information that isn’t directly WebRTC wasn’t on our minds. This changed once customers approached us asking for assistance with sporadic failures that were hard to reproduce and hard to debug.
In one case, a customer knew there’s a 502 failure due to the failure screenshot we generate, but it wasn’t that easy to know which of his servers and services was the one causing it. Since the failure is sporadic and isn’t consistent, he couldn’t get to the bottom of it. By using the HAR files we can collect in his monitor, the moment this happens again, he will have all the network traces for that 502, making it easier to catch.
Here’s how to enable it on your tests/monitors:
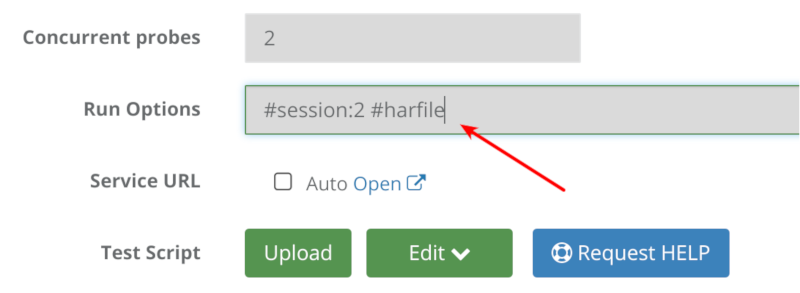
Go to the test editor, and add to the run options the term #har-file
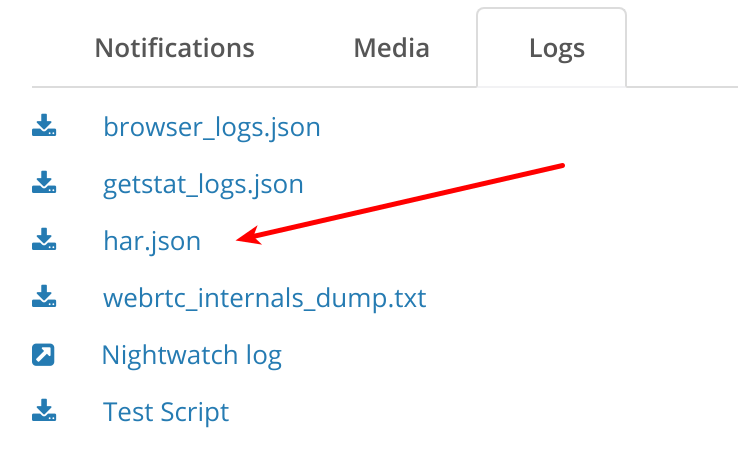
Once there and the test/monitor runs next, it will create a new file that can be found under the Logs tab of the test results for each probe:
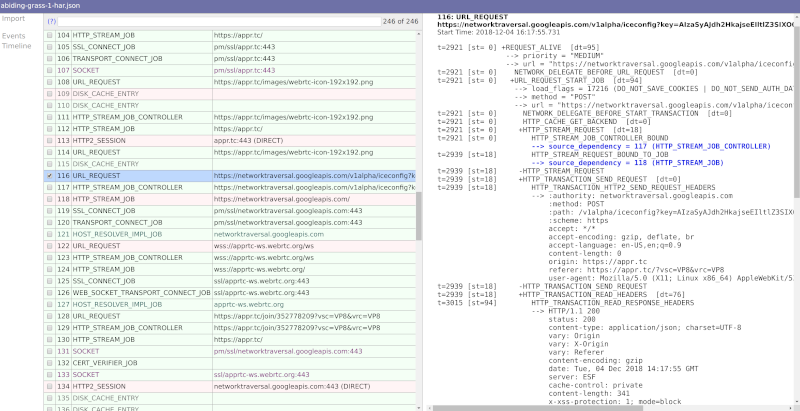
We don’t handle visualization for HAR files for the moment, but you can download the file and place it on a visual tool.
There are times when tests just fail with no good reason. This is doubly true for automating web UI, where minor time differences may cause problems or when user behavior is just different than an automated machine. A good example is a person who couldn’t login – usually, he will simply retry.
When running a monitor, you don’t want these nagging failures to bog you down. What you are most interested in isn’t bug squashing (at least not everyone) it is uptime and quality of service. Towards that goal, we’ve added another run option – #try
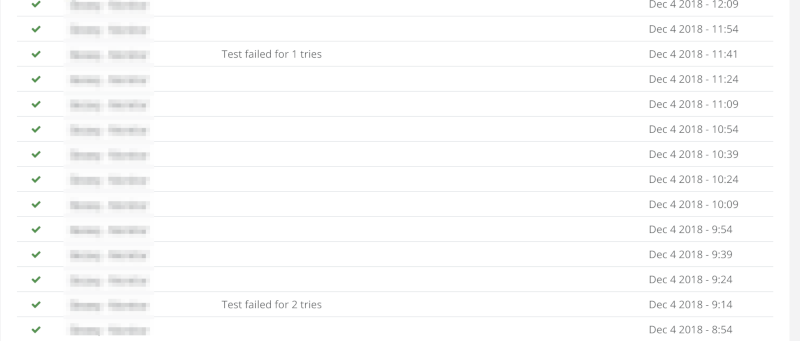
If you add this run option to your monitor, with a number next to it, that monitor will retry the test a few more times before reporting a failure. #try:3 for example, will retry twice the same script before reporting a failure.
What you’ll get in your monitor might be something similar to this:
The test reports a success, and the reason indicates a few times where it got retried.
3. Scoring of monitor runs
We’ve started to add a scoring system to our tests. This feature is still open only to select customers (want to join in on the fun? Contact us)
This scoring system places a test based on its media metrics collected on a scale of 0-10. We decided not to go for the traditional MOS scoring of 1-5 because of various reasons:
MOS scoring is usually done for voice, and we want to score video
We score the whole tests and not only a single channel
MOS is rather subjective, and while we are too, we didn’t want to get into the conversation of “is 3.2 a good result or a bad result?”
The idea behind our scores is not to look at the value as good or bad (we can’t tell either) but rather look at the difference between the value across probes or across runs.
Two examples of where it is useful:
You want to run a large stress test. Baseline it with 1-2 probes. See the score value. Now run with 100 or 1000 probes. Check the score value. Did it drop?
You are running a monitor. Did today’s runs fair better than yesterday’s runs? Worse? The same?
What we did in this release was add the score value to the webhook. This means you can now run your monitors and collect the media quality scores we create and then trendline them in your own monitoring service – splunk, elastic search, datadog, whatever.
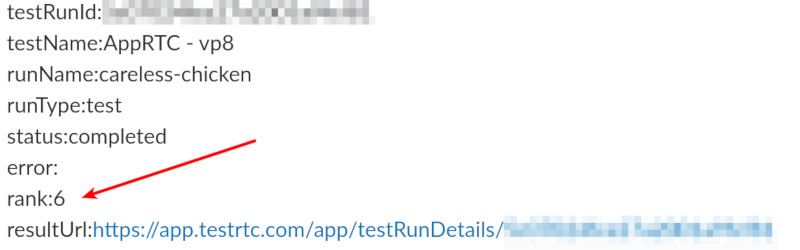
Here’s how the webhook looks like now:
The rank field in the webhook indicates the media score of this session. In this case, it is an AppRTC test that was forced to run on simulated 3G and poor 4G networks for the users.
–
As with any release, a lot more got squeezed into the release. These are just the ones I wanted to share here this time.
If you are interested in a monitoring service that provides predictable synthetics WebRTC clients to run against your service, checking for uptime and quality – check us out.
When we started a couple of years ago, we started receiving requests from contact center vendors to support scenarios that involve both WebRTC and PSTN.
Most of these were customers calling from a regular phone to an agent sitting in front of his browser and accepting the call using WebRTC. Or the opposite – contact center agents dialing out from their browser towards a regular phone.
That being the case, we thought it was high time we took care of that and give a better, more thorough explanation on how to get that done. So we partnered with Twilio on this one, took their reference application of a contact center from github, and wrote the test scripts in testRTC to automate it.
Along the way, we’ve made use of Twilio to accept calls and dial out calls; dabbled with AWS Lambda; etc.
It was a fun project, and Twilio were kind enough to share our story on their own blog.
If you are trying to test or monitor your contact center, and you need to handle scenarios that require PSTN automation mangled with WebRTC, then this is mandatory reading for you:
A few weeks ago, we’ve hosted a webinar on creating an active monitoring system for your WebRTC application. Obviously, we’ve used testRTC for that.
We went through the following topics:
Why is WebRTC monitoring different than VoIP or Web monitoring? (that’s because it is a bit of both)
What do we mean when we say active monitoring? (checking for uptime and service quality in a predictable and reproducible fashion, and without violating user privacy or data compliance)
How to actually write and configure a monitor in testRTC. And then connect it to Slack for its alerts (did that as a live demo on our platform)
When and for what scenarios to use testRTC (there are quite a few that we see customers aiming for)
The recording is now available on YouTube:
If you are looking to improve the stability, quality and uptime of your WebRTC application, then we’re here to help you. Contact us to learn more
Philipp Hancke is not new here on our blog. He has assisted us when we wrote the series on webrtc-internals. He is also not squeamish about writing his own testing environment and sharing the love. This time, he wanted to share a piece of code that takes device availability test automation in WebRTC to a new level.
Obviously… we said yes.
We don’t have that implemented in testRTC yet, but if you are interested – just give us a shout out and we’ll prioritize it.
Both Chrome and Firefox have quite powerful mechanisms for automating getUserMedia with fake devices and skipping the permission prompt.
In Chrome this is controlled by the use-fake-device-for-media-stream and use-fake-ui-for-media-stream command line flags while Firefox offers a preferences media.navigator.streams.fake. See the webdriver.js helper in this repository for the gory details of how to use this with selenium.
However there are some scenarios which are not testable by this:
getUserMedia returning an error
restricting the list of available devices
While most of these are typically handled by unit tests sometimes it is nice to test the complete user experience for a couple of use-cases
test the behaviour of a client with only a microphone
test the behaviour of a client with only a camera
test the behaviour of a client with neither camera or microphone
combine those tests with screen sharing which in some cases replaces the video track on appear.in
test audio-only clients interoperating with audio-video ones. The test matrix becomes pretty big at some point.
Those tests are particularly important because as developers we tend to do some manual testing on our own machines which tend to be equipped with both devices. Automated tests running on a continuous integration server help a lot to prevent regressions.
Manipulating APIs with an extension
In order to manipulate both APIs I wrote a chrome extension (which magically works in Firefox and Edge because both support webextensions) that makes them controllable.
An extension can inject javascript into the page on page load as a content script. This has been used in the webrtc-externals extension described on webrtchacks to wrap the whole RTCPeerConnection API.
In our case, the content script replaces the getUserMedia and enumerateDevices functions with wrappers that can be modified at runtime. For example, the enumerateDevices wrapper calls the original function and then uses Javascript to modify the result before returning it to the caller:
The full extension can be found on github. The behaviour is dynamic and can be controlled via sessionStorage flags. With Selenium, one would typically navigate to a page in the same domain, execute a small script to set the session storage flags as desired and then navigate to the page that is to be tested.
We will walk through two examples now:
Use-case: Have getUserMedia return an error and change it at runtime
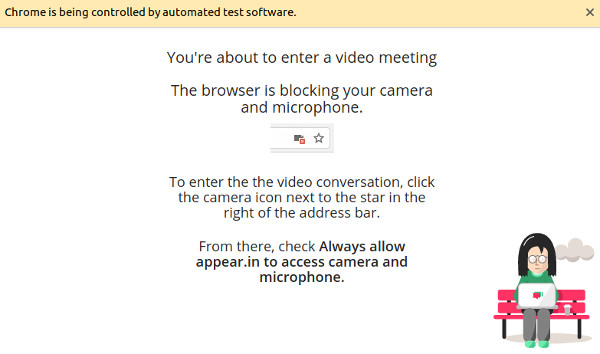
Let’s say we want to test the case that a user has denied permission. For appear.in this leads to a dialog that attempts to help them with the browser UX to change that.
The full test can be found here. As most selenium tests, it consists of a series of simple and straightforward steps:
build a selenium webdriver instance that allows permissions and loads the extension
go to the appear.in homepage
set the List of fake devices in Chrome WebRTC testing flag to cause a NotAllowedError (i.e. the user has denied permission) as well as an appear.in specific localStorage property that says the visitor is returning — this ensures we go into the flow we want to test and not into the “getUserMedia primer” that is shown to first-time users.
join an appear.in room by loading the URL directly.
the next step would typically be asserting the presence of certain DOM elements guiding the user to change the denied permission. This is omitted here as those elements change rather frequently and replaced with a three second sleep which allows for a visual inspection. It should look like this:
the List of fake devices in Chrome WebRTC testing flag is deleted
this eventually leads to the user entering the room and video showing up. We do some magic here in order to avoid having to ask the user to refresh the page.
Watch a video of this test running below:
Incidentally, that dialog had a “enter anyway” button which, due to the lack of testing, was not visible for quite some time without anyone noticing because the visual regression tests could not access this stage. Now that is possible.
Restricting the list of available devices
The fake devices in both Chrome and Firefox return a stream with exactly those properties that you ask for and they always succeed (in Chrome there is a way to make them always fail too). In the real world you need to deal with users who don’t have a microphone or a camera attached to their machine. A call to getUserMedia would fail with a NotFoundError (note the recent change in Chrome 64 or simply use adapter.js and write spec-compliant code today).
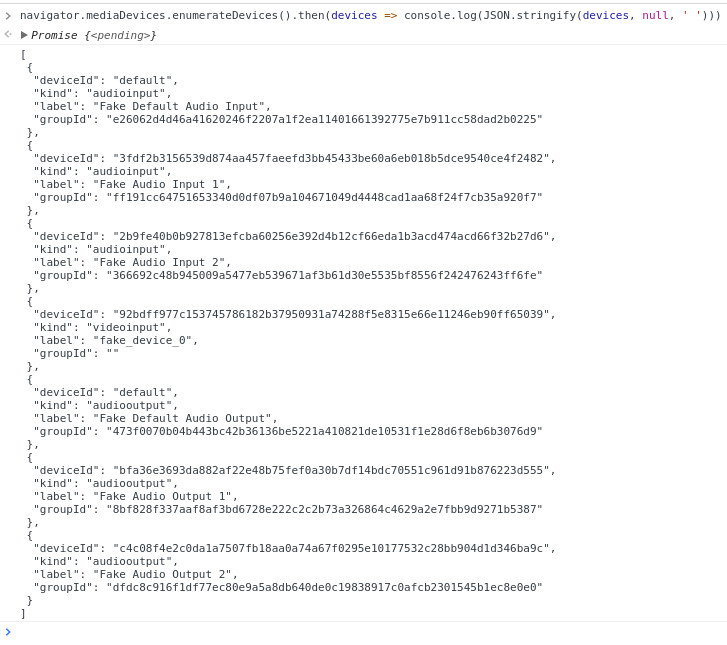
The common way to avoid this is to enumerate the list of devices to figure out what is available using enumerateDevices by pasting this into the javascript console:
When you run this together with the fake device flag you’ll notice that it provides two fake microphones and one fake camera device:
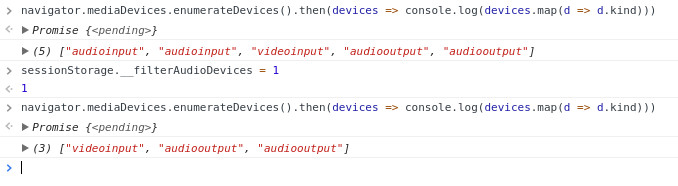
When the extension is loaded (which for manual testing can be done on chrome://extensions; see above for the selenium ways to do it) one can manipulate that list:
sessionStorage.__filterAudioDevices = true;
Paste the enumerateDevices into the console again and the audio devices no longer show up:
At appear.in we used this to replace a couple of audio-only and video-only tests that used feature flags in the application code with more realistic behaviour. The extension allows a much cleaner separation between the frontend logic and the test logic.
Summary
Using a tiny web extension we could easily extend the already powerful WebRTC testing capabilities of the browsers and cover more advanced test scenarios. Using this approach it would even be possible to simulate events like the user unplugging the microphone during the call.
I took part this week in Twilio’s Signal event in London.
As with the previous Signal event I attended, this one was excellent (but that’s for some other post).
Twilio were kind enough to invite me to talk at their event, which resulted in the recorded session below:
In the first part of this session, I tried explaining the challenges that WebRTC testing and automation brings with it. I ended up talking about these 5 challenges:
WebRTC being a brand new technology (=always changing)
Browser based (=you don’t control your whole tech stack)
Resource intensive (=need to factor that in when allocating your testing machines)
Network sensitive (=need to be able to test in different network conditions)
It takes two to tango (=need to synchronize across browsers during a test)
The second part was going through some of the results we’ve collected in our recent Kurento experiment, where we tried to see how much can we scale a deployed Kurento media server in different scenarios.
After the session everyone asked me how was the session. Frankly – I don’t know. I wasn’t sitting and listening there. I was talking (enjoying myself while doing so). I hope the audience in the room found the session useful. You can check it out on your own and make your own judgement.
Oh – and if you need to test your WebRTC application then you know where to find us 🙂
–> And if you don’t, then here’s our contact page.
Yesterday, we hosted a webinar on testRTC. This time, we were really focused on showing some live demos of our service.
I wanted this one to be useful, so I sat down earlier this week, working on a general story outline with the idea of showing live how you can write a test script from scratch, building more and more capabilities and functionality into it as I went along.
It was real fun.
If you missed it, I’d like to invite you to watch the replay:
One of the things I was asked is to share the scripts used throughout the session.
So I cleaned up the scripts a bit and placed them on our Google Drive. I am sharing them here in two forms:
The GDoc file of the script – open it to read, copy+paste it to wherever
The JSON file of the script – you can import this one directly into your testRTC account (you’ll need to reconfigure the probe profiles before you run it):