Category Archives for "Stories"

1

WebRTC Video Diagnostics for your application (done properly)

WebRTC video diagnostics should be tackled with a holistic approach that offers an end-to-end solution for your users and your support team.

Let’s go through this rabbit hole of network testing – and what testRTC has to offer.

Dev Tools: Build vs Buy

Build vs. Buy

What I find fascinating about developer tools is the discussions you get into. Developers almost always underestimate the effort needed to do things and overestimate their skills. This is why 12 years later, the post by Jeff Atwood about copying Stackoverflow still resonates with me (read it – it is golden).

In our line of business at testRTC we get it a lot. Sentences like “we have something like this, but not as nice” or “we are planning on developing it ourselves”. Sometimes they make sense. Other times… not so much.

Over time though, the gap between an in-house tool to a 3rd party commercial alternative tends to grow. Why? Because in-house tools are bound to be neglected while 3rd party ones get care and attention on a regular basis (otherwise, who would adopt them?)

You see this also with WebRTC video API vendors (CPaaS): Most of them up until recently provided media server infrastructure with client side SDKs to connect to them. Anything else was a bonus. In the last year or two though, many of these API vendors are building more of the application layer and giving it to their customers in various ways: from ready-made iframe widgets, through UI libraries to group calling SDKs and fully built reference applications.

Twilio took it a step further with their RTC Diagnostics SDK last year and then this month the Video Diagnostics App. Both of these packages are actually reference code that Twilio offers for developers so they can write their own network testing / diagnostics / precall / preflight implementation a bit more easily.

This begs the question – what makes diagnostics such an issue that it needs an SDK and an app as references for developers to us?

Our WebRTC diagnostics and troubleshooting interaction pyramid

If we map out our users and their WebRTC configuration/network issues, we can place that in a kind of a pyramid diagram, where the basis of the pyramid are users that have no issues, and the more we go up the pyramid, the more care and attention the users need.

WebRTC diagnostics

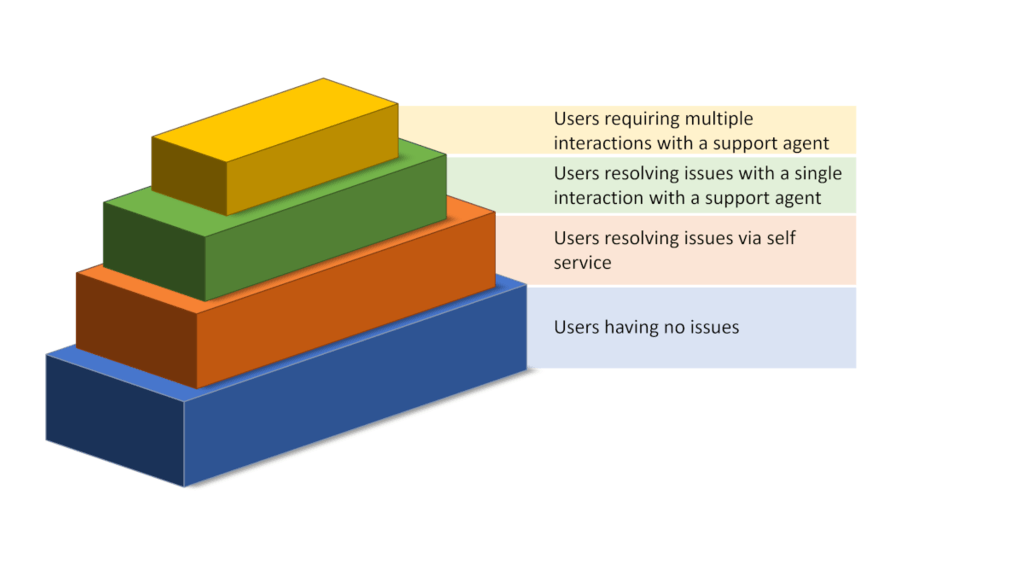
Our purpose in life would be to “push” as many users as we can down the pyramid so that they would be able to solve their connectivity issues faster. That would reduce the energy and strain from the support organization and will also result in happier customers.

Pushing users down the pyramid requires better tooling used by both our end users AND our support team.

The components of WebRTC diagnostics

When you are thinking of assisting end users with their connectivity or quality issues over WebRTC, you’re mainly thinking about peripheral devices and networks.

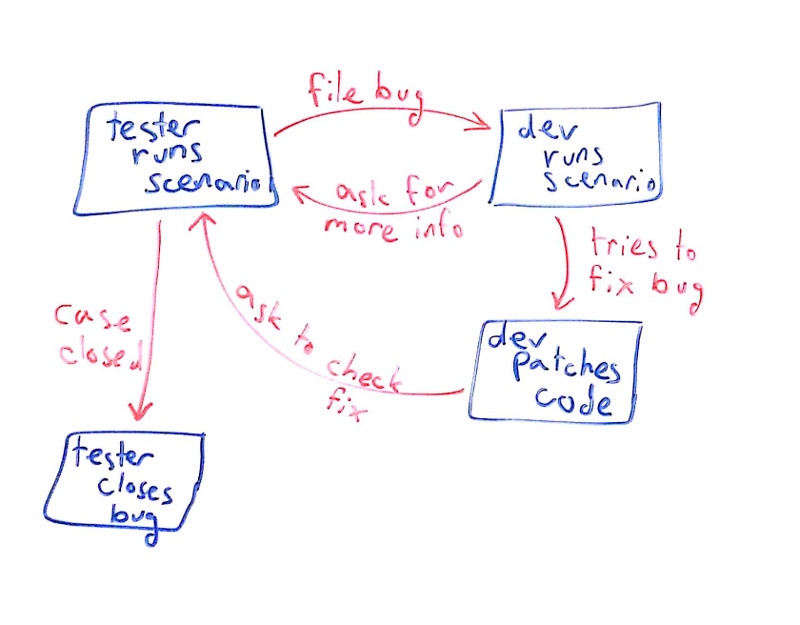
There’s this dance that is going to happen. A back and forth play where you’re going to ask users to do something, they will do it, you’ll look at what they did – rinse and repeat. Until the problem is solved or the user goes away frustrated.

Objective of WebRTC diagnostics

What we want to do is to reduce the amount of back and forth interactions and if possible make it go away entirely.

Here are the things the user will be interested in knowing:

  1. Are my peripherals (microphone and camera) set up correctly?
  2. Can I connect to the service?
  3. Am I getting a good quality connection?

But then there are the things our support would like to understand as well:

  1. Can the microphone or camera the user has cause issues?
  2. What machine is he running on exactly, and with what middleware?
  3. Where is he coming from?
  4. How is the user’s network behaving in general?
  5. Does he have a stable connection with a “clean” network?
  6. Did anyone configure their firewall in any restrictive way?

As you can see, there’s a slight difference in the requirements of the end users while they tries to solve the problem versus what support would need to help them out.

Oh, and then there are the differences between just voice services and video services, where WebRTC video diagnostics are a bit trickier in nature.

Let’s review what components we’re going to need here.

1. A/V Setup/configuration

Setup

You want to let the users understand if their microphone and camera work. And for that, you need to add some settings screen – one that will encompass the use of these devices and enable users to pick and choose out of the selection of devices they have connected. It is not unheard of to have users with multiple microphones and/or cameras (at any given point in time, my machine here shows 3 cameras (don’t ask why) and 4 different microphone alternatives.

This specific configuration is also tricky – you need to be able to handle it in two or three different places within your application: at the very least, on the first time someone uses your service and then again inside a session, if users want to switch between devices mid-session.

For the most part, I’d suggest you take care of this setup on your own – you know best how your UI/UX should be and what experience you’re after for your users.

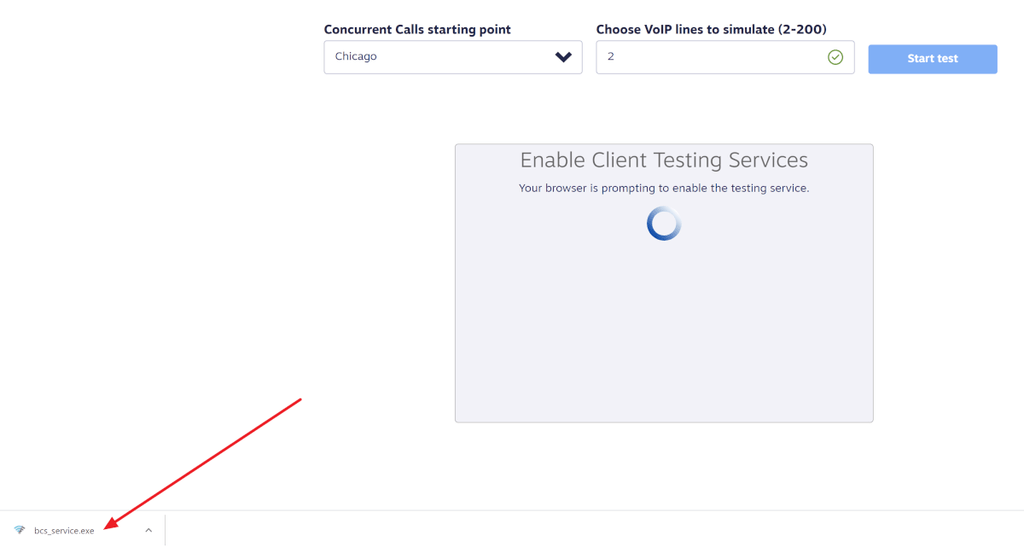
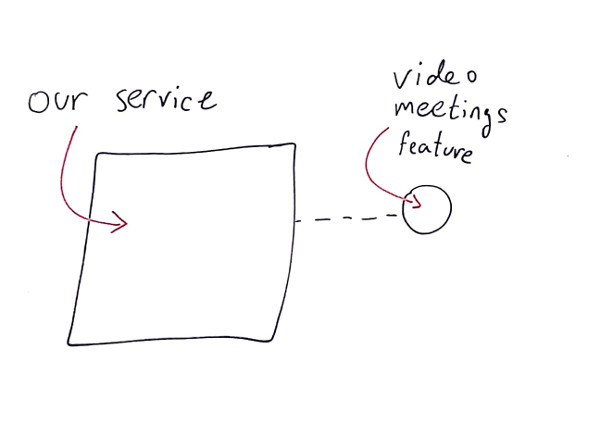
2. Precall/preflight connectivity check(s)

Connectivity Checks

Some like it, others don’t. The idea here is to have the user go through an actual short session in front of the media server, to see if they can get connected and understand the quality of the connection. This obviously takes time (30+ seconds to get a meaningful reading usually).

It is quite useful in the sense of preparation:

  • When the session is important enough to have people join a wee bit earlier;
  • Or when the user can be forced to go through the hoops of waiting for this

Bear in mind that such a connectivity check should better happen in front of the media server or at the very least the data center that the user will get connected to in his actual session.

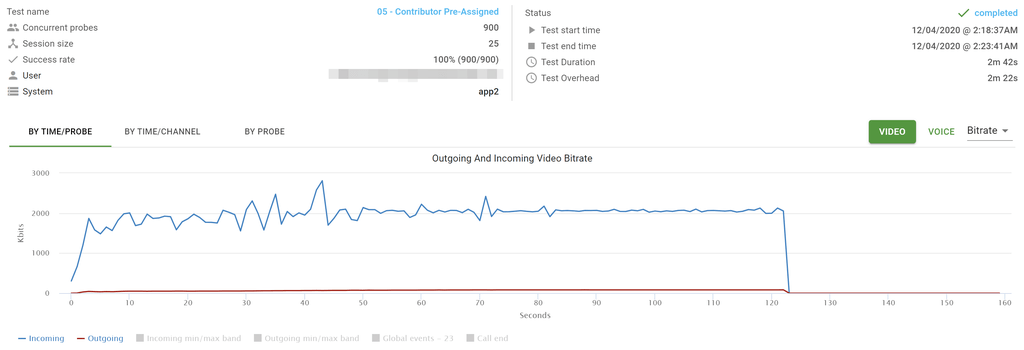
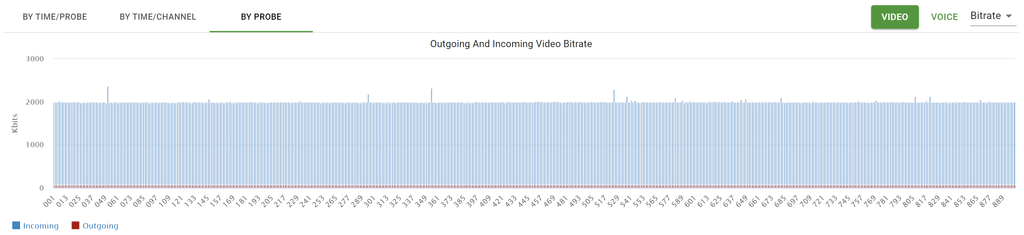
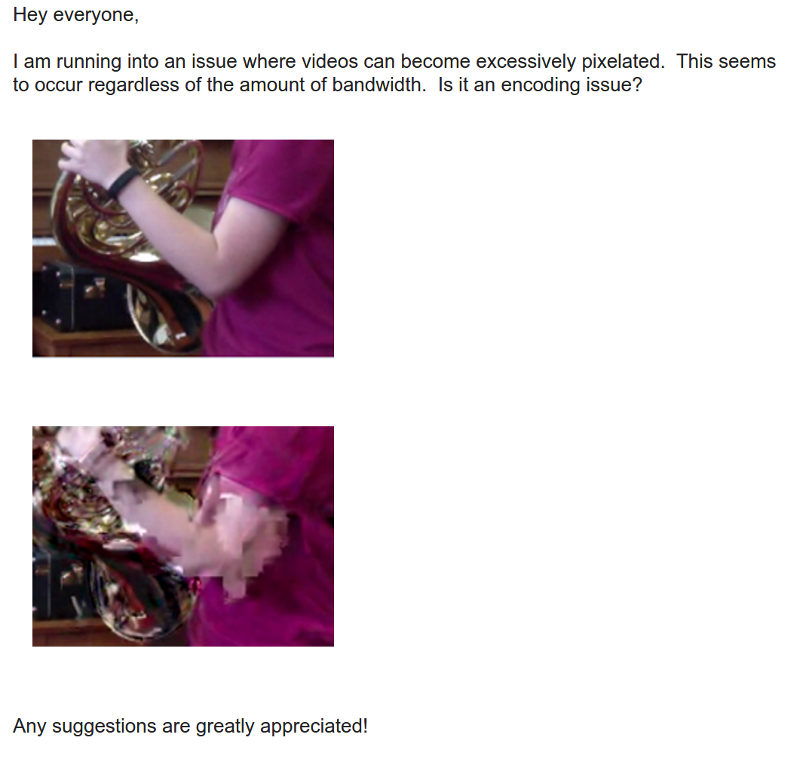
Also note that for WebRTC video diagnostics, the tests here are a bit different and more rigorous, especially since we need to test for much higher bitrates (and usually for slightly longer periods of time).

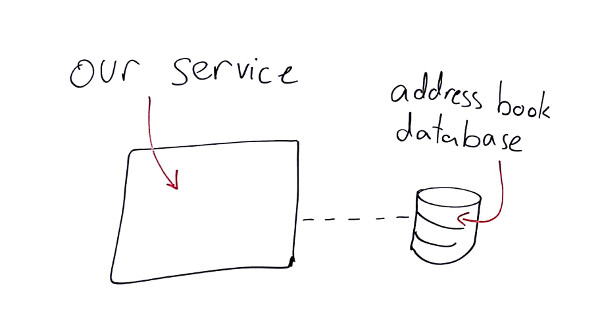
3. Automated data collection

Automated Data collection

We’re getting to the part that is important to the support team more than it is to the end user.

Here what we’re after is to collect anything and everything that might be remotely useful to our needs. Things like:

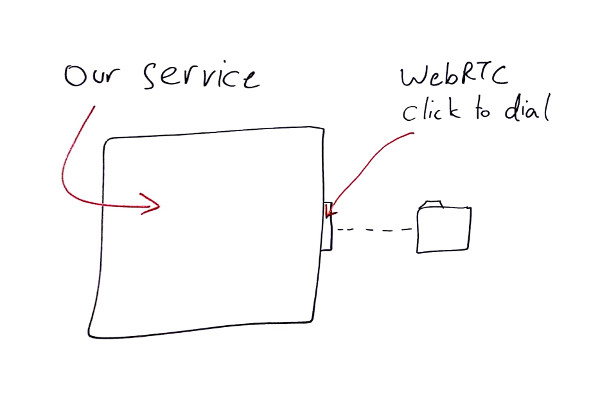
  • The type of network the user is on
  • How is he connected to the service?
  • What are the names of the devices they have?
  • Where is the user located geographically?
  • Do we know what specific microphone and camera they are using?
  • What operating system and browsers do they use?

Lots and lots of questions that can come in handy to figure out certain types of breakages and behaviors.

We can ask the user, but:

  1. They might not know, or have hard time finding that information (and we don’t want to burden them at this point any further)
  2. They might be lying to us, usually because they aren’t certain (and sometimes because they just lie)

Which means automating that collection of information somehow, which means being able to glean that information with as little work and effort as possible on the user’s side.

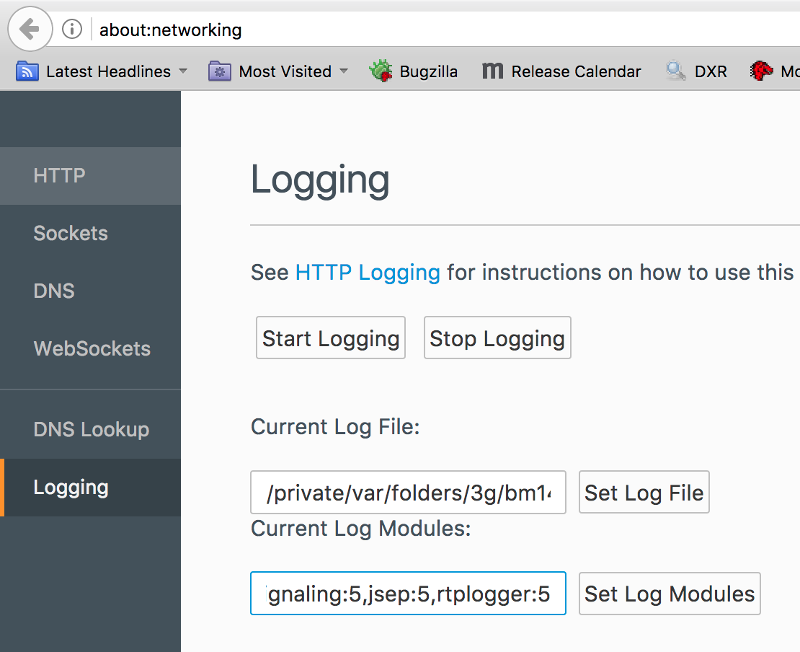
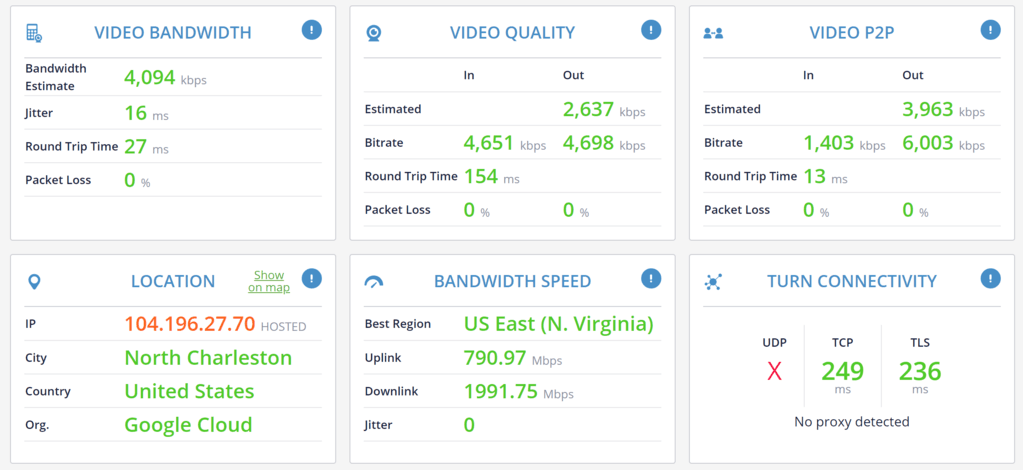
4. 360 network testing

Network testing

Let’s assume the user can’t connect to your service or even that they experience poor quality due to some bandwidth limitations or high packet loss. Is that because of your infrastructure or their home/office network?

Hard to say. Especially if all you have to go with is the metrics on your server or the webrtc-internals dump file from the user’s device. Why? Because the story you will find there will be about what happens in front of your service alone.

What you really need is a 360 view of your user’s network. And for that, you need a more rigorous approach. Something that would intentionally test for network connectivity on various protocols, try to understand the bandwidth available, connect elsewhere for “comparison” – the works.

The hard thing here is that to properly conduct such tests and collect the data you will need to install and configure your own specialized servers for some of the tasks. These aren’t going to be the ones your WebRTC application infrastructure uses for the day to day operations – just ones that are used for troubleshooting such user issues.

You can do without this, but then, your results and the information you will have won’t be as complete, which means figuring out the trickiest user issues will be… trickier… and will take more time… and will cause more frustrations for said user.

5. Workflow

Workflow

Then there’s the workflow.

A user comes in. complains.

What now?

Do you wing it each time? Whenever a user complains – do the people in support know what to do? Do they have the process well documented? Do you guide or hint to users how they can solve the issues themselves?

Thinking of that workflow, assuming you have templated emails and responses readily available, how do you deal with the user’s responses? How do you make sense of the data they send back? What if the user goes off your script?

And while we’re at it, are you collecting the complaints and analysis and storing it for later analysis? Something you can use to understand what types of typical issues and complaints exist and how you can improve your infrastructure and your workflow?

This part is often neglected.

Our qualityRTC solution for WebRTC diagnostics

We’ve got a solution for the WebRTC audio or WebRTC video diagnostics challenge. One that takes care of the network testing in ways that build your self service and hands on support for users – in a way that fits virtually any workflow.

If you want to really up your game in WebRTC diagnostics – for either voice or video scenarios – with Twilio, some other CPaaS vendor or with your own infrastructure – let us know. We can help using our qualityRTC network testing solution.

VoIP Network Tests in the era of WebRTC

Not sure what got to me last week, but I wanted to see what type of network testing for VoIP exists out there. This got me down memory lane to what felt like the wild west of the 90’s world wide web.

You can do that yourself! Just search for “voip network test” on Google and check what the tests look like. They come in exactly two shapes and sizes:

  1. A generic speed test
  2. Download a test app

None of these methods are good. They are either incorrect or full of friction.

The ones hosting these network tests are UCaaS vendors, trying to entice customers to come their way. The idea is, you run a test, and they nicely ask you how many phone lines you’d like a quote for…

So what’s wrong with that?

1. Generic speed tests aren’t indicative of ability to conduct VoIP calls

Most of the solutions I’ve found out there were just generic speed tests. Embedding a network test page of a third party or going to the length of installing your own speed testing machine, which is fine. But does it actually answer the question the user wants answered?

Here’s an interesting example where bandwidth speeds are GREAT but support for VoIP or WebRTC – not so much:

Great bandwidth, but no UDP available – a potential for bad VoIP call quality

I’ve used our Google Cloud machines to try with. It passes the speed test beautifully. What does that say about the quality I’ll get with it for VoIP? Not much.

For that same device on the same network, I am getting blocked over UDP. VoIP is conducted over UDP to maintain low latency and to handle packet losses (which happen on any network at one point or another).

This isn’t limited only to wholesale blocking of UDP traffic. Other aspects such as the use of a VPN, throttling of UDP, introduction of latency, access to the media devices – all these are going to affect the user’s experience and in many cases his ability to use your VoIP service.

👉 Relying only on a generic speed test is useless at best and misleading at worst.

2. Downloading test apps is not what you expect to do in 2021

In some cases, speed test services ask you to download and install an application.

There’s added friction right there. What if the user doesn’t have permission to install applications on his device? What if he is running on Linux? What if the user isn’t technically savvy?

I tried out one out one of these so called downloaded speed tests.

I clicked the “Start test” button. After some 10 seconds of waiting, it downloaded an executable to my machine. No further prompts of explanations given.

That brought the Windows 10 installation screen, with a name different than that of the vendor whose site I am on.

Deciding to install, I clicked again, only to be prompted by another installation window.

Next clicks? EULA, Opt-in, Folder selection, Finish

So… I had to agree to an EULA, actively remove an opt-in, select the folder to install (had a default there), reminded that it is running in the background now (WHY? For what purpose?), and then click on Finish.

It got me results, but at what cost and at what friction level for the end user?

In this specific case – before I even made a decision to use that service provider. And I had to:

  • Click on 6 buttons to get there
  • Sign a legal document (EULA)
  • Opt out from something (so it won’t leave ghosts on my machine)
  • Remember to go and delete what was downloaded

And there’s the challenge here of multiple popups and screen focus changes that took place throughout the experience.

The results might be accurate and useful, but there are better ways.

👉 Having a downloadable installed test adds friction and limit usability for your users.

What to look for in a VoIP network test?

There’s a dichotomy between the available solutions out there: they are either simple to use and grossly inaccurate, or they are accurate and complex to use.

Then there’s the fact that they answer only a single question – is there enough bandwidth. Less so to other network aspects like firewall and VPN configurations.

From our own discussions with clients and users, here’s what we learned in the last two years about how VoIP network tests should look like:

  • Simple to use
    • Simple for the end user to start the test
    • Simple for the support/IP person to see the results
    • Simple to read and understand the results
  • Specific to your infrastructure
    • A generic test is great, but isn’t accurate
    • Something that tests the network needs to test your infrastructure directly. If that’s impossible, then the best possible approximation to it
  • Supports your workflow
    • Ability to collect data you need about the user
    • Easily see the results on your end, to assist the client
    • Customizable to your business processes and use cases

Check qualityRTC

In the past two years or so we’ve been down this rabbit hole of VoIP network testing in testRTC. We’ve designed and built a service to tackle this problem, with a lot of help from our customers, we’ve improved on it and still are, to the point where it is today:

A simple to use, customizable solution that fits to your infrastructure and workflow

Within minutes, the user will know if his network is good enough for your service, and your support will have all the data points it needs to assist your user in case of connectivity issues.

Check out our friction-free solution, and don’t forget to schedule a demo!

Let's talk about you

Get a personalized demo of the testRTC Platform

Testing large scale WebRTC events on LiveSwitch Cloud

If you are developing WebRTC applications that target large scale events – think hundreds of users in a single “room”, then you should continue reading.

LiveSwitch Cloud by Frozen Mountain is a modern CPaaS offering focused around video communications. Naturally it makes use of WebRTC and relies on the long heritage and capabilities of Frozen Mountain in this space. Frozen Mountain has transitioned from a vendor that specializes in SDKs and media servers you can host on your own to providing also their managed cloud service. In essence, dogfooding their technology.

One of the strong markets that Frozen Mountain operates in is the entertainment industry, where large scale online virtual events are becoming the norm. A recent such testRTC client used our WebRTC stress testing capabilities to validate their scenario prior to a large event.

This client’s scenario included segmenting the audience of a live event into groups of 25 viewers that could easily be monitored by producers in a studio control room and displayed to performers as a virtual audience that they could see, hear, and interact with during the event. We settled on 36 such segments, totalling 900 viewers in this WebRTC stress test.

Here is a sample test run from the work done:

The graph above shows the 900 WebRTC probes that were used in one of these tests. The blue line denotes the incoming average bitrate over time of the main event as seen by each of the viewers. The redline is the outgoing bitrate. Since these viewers are used to convey an atmosphere to the event, there was no need to have them stream high bitrates – having 900 of them meant a lot of pixels in aggregate even at their low bitrate. You can see how the incoming bitrate stabilizes at around 2mbps for all the viewers.

This graph shows for each individual probe out of the 900 WebRTC browsers that we had what was the average bitrate they had throughout the test. It is a slightly different view towards the same data that is meant to find outliers.

There are slight variations to a few of the probes there, which shows a stable system overall.

What was great about this one, is the additional work Frozen Mountain did on their end: The viewers were split into segments that had to be filled randomly, as they would in real life. Each user joining in, coming in at his own pace, as opposed to packing the segments one after the other with people like automatons.

The above animation was created by Frozen Mountain to illustrate the audience. Each square is a user, and each segment/pool has 25 users in it. You can see how the 900 probes from testRTC randomly fill out the audience to capacity.

Testing for live WebRTC events at scale

We are seeing a different approach to testing recently.

As we are shifting from nice-to-have and proof-of-concepts to production systems, there is a bigger need to thoroughly test the performance and scale of WebRTC applications. This is doubly true for large events. Ones that are broadcasted live to audiences. Such events take place in two different industries: entertainment and enterprise.

Within the entertainment industry, it is about working alongside the pandemic. Being able to bring the audiences back to the stadiums and theatre halls, alas remotely. With enterprises it is a lot about virtual town halls, sales kickoffs and corporate team building where everyone is sheltered at home.

In both these industries the cost of a mistake is high since there is no second chance. You can’t really rerun that same match or reschedule that town hall. Especially not with so many people and planning involved to make this event happen.

End-to-end stress testing is an important milestone here. While media server frameworks and CPaaS vendors do their own testing, such solutions need to be tested end-to-end for scale. Bottlenecks can occur anywhere in the system and the only real way to find these bottlenecks is through rigorous stress testing.

Being able to create a test environment quickly and scale it to full capacity is paramount for the success of the platform used for such events, and it is where a lot of our efforts have been going to these recent months, as we see more vendors approaching us to help them with these challenges.

What we did on our end was solve some bottlenecks in our infrastructure that “held us back” and enabled us to assist our clients only up to 2,000 probes in a single test. We can now do more of it and with higher flexibility.

WebRTC Application Monitoring: Do you Wipe or Wash?

UPDATE: Recording of this webinar can be found here.

If you are running an application then you are most probably monitoring it already.

You’ve got New Relic, Datadog or some other cloud service or on premise monitoring setup handling your APM (Application Performance Management).

What does that mean exactly with WebRTC?

If we do the math, you’ve got the following servers to worry about:

  • STUN/TURN servers, deployed in one or more (probably more) data centers
  • Signaling server, at least one. Maybe more when you scale the service up
  • Web server, where you actually host your application and its HTML pages
  • Media servers, optionally, you’ll have media servers to handle recording or group calls (look at our Kurento sizing article for some examples)
  • Database, while you might not have this, most services do, so that’s another set of headaches
  • Load balancers, distributed memory datagrid (call this redis), etc.

Lots and lots of servers in that backend of yours. I like to think of them as moving parts. Every additional server that you add. Every new type of server you introduce. It adds a moving part. Another system that can fail. Another system that needs to be maintained and monitored.

WebRTC is a very generous technology when it comes to the variety of servers it needs to run in production.

Assuming you’re doing application monitoring on these servers, you are collecting all machine characteristics. CPU use, bandwidth, memory, storage. For the various servers you can go further and collect specific application metrics.

Is that enough? Aren’t you missing something?

Here are 4 quick stories we’ve heard in the last year.

#1 – That Video Chat Feature? It Is Broken

We’re still figuring out this whole embeddable communications trend. The idea of companies taking WebRTC and shoving voice and video calling capabilities into an existing product and workflow. It can be project management tools, doctor visitations, meeting scheduler, etc.

In some cases, the interactions via WebRTC are an experiment of sorts. A decision to attempt embedding communications directly to the existing product instead of having users find how to communicate directly (phone calls and Skype were the most common alternatives).

Treated as an experiment, such integrations sometimes were taken somewhat out of focus, and the development teams rushed to handle other tasks within the core product, as so often happens.

In one such case, the company used a CPaaS vendor to get that capability integrated with their service, so they didn’t think much about monitoring it.

At least not until they found out one day that their video meetings feature was malfunctioning for over two weeks (!). Customers tried using it and failed and just moved on, until someone complained loud enough.

The problem ended up being the use of deprecated CPaaS SDK that had to be upgraded and wasn’t.

#2 – But Our Service is Working. Just not the Web Calling Part

In many cases, there’s an existing communication product that does most of its “dealings” over PSTN and regular phone numbers. Then one day, someone decides to add browser dialing. Next thing that happens, you’ve got a core product doing communications with a new WebRTC-based feature in there.

Things are great and calls are being made. Until one day a customer calls to complain. He embedded a call button to his website, but people stopped calling him from the site. This has gone for a couple of days while he tried tweaking his business and trying to figure out what’s wrong. Until finding out that the click to call button on the website just doesn’t work anymore.

Again, all the monitoring and health check metrics were fine, but the integration point of WebRTC to the rest of the system was somewhat lost.

The challenge here was that this got caught by a customer who was paying for the service. What the company wanted to do at that point is to make sure this doesn’t repeat itself. They wanted to know about their integration issues before their customers do.

#3 – Where’s My Database When I Need it?

Here’s another one. A customer of ours has this hosted unified communications service that runs from the browser. You login with your credentials, see a contacts list and can dial anyone or receive calls right inside the browser.

They decided to create a monitor with us that runs at a low frequency doing the exact same thing: two people logging in, one calls and the other answers. Checking that there’s audio and video and all is well.

One time they contacted us complaining that our monitor is  failing while they know their system is up and running. So we opened up a failed monitor run, looked at the screenshot we collect automatically upon failure and saw an error on the screen – the browser just couldn’t get the address book of the user after logging in.

This had nothing to do with WebRTC. It was a faulty connection to the database, but it ended up killing the service. They got that pinpointed and resolved after a couple of iterations. For them, it was all about the end-to-end experience and making sure it works properly.

#4 – The Doctor Won’t See You Now

Healthcare is another interesting area for us. We’ve got customers in this space doing both testing and monitoring. The interesting thing about healthcare is that doctor visitations aren’t a 24/7 thing. For that particular customer it was a 3-hour day shift.

The service was operating outside of the normal working hours of the doctor’s office, with the idea of offering patients a way to get a doctor during the evening hours.

With a service running only part of the day, the company wanted to be certain that the service is up and running properly – and know about it as early on as possible to be able to resolve any issues prior to the doctors starting their shift.

End-to-End Monitoring to the Rescue

In all of these cases, the servers were up and running. The machines were humming along, but the service itself was broken. Why? Because application metrics tell a story, but not the whole story. For that, you need end-to-end monitoring. You need a way to run a real session through the system to validate that all of its pieces – all of its moving parts – are working well TOGETHER.

Next week, we will be hosting a webinar. In this webinar, we will show step by step how you can create a killer monitor for your own WebRTC application.

Oh – and we won’t only focus on working/not working type of scenarios. We will show you how to catch quality degradation issues of your service.

I’ll be doing it live, giving some tips and spending time explaining how our customers use our WebRTC monitoring service today – what types of problems are they solving with it.

Join me:

Creating a Kickass WebRTC Monitor Using testRTC
recording can be found here


Do Browser Vendors Care About Your WebRTC Testing?

It is 2017 and it seems that browser vendors are starting to think of all of us WebRTC developers and testers. Well… not all the browser vendors… and not all the time – but I’ll take what I am given.

I remember years ago when I managed the development of a VoIP stack, we decided to rewrite our whole test application from scratch. We switched from the horrible “native” Windows and Unix UI frameworks to a cross platform one – Tcl/Tk (yes. I know. I am old). We also took the time to redesign our UI, trying to make it easier for us and our developers to test the APIs of the VoIP stack. These were the good ol’ days of manual testing – automation wasn’t even a concept for us.

This change brought with it a world of pain to me. I had almost daily fights with the test manager who had her team file bugs that from my perspective were UI issues and not the product’s issues. While true, fixing these bugs and even adding more tooling for our testing team ended up making our product better and more developers-friendly – an important factor for a product used by developers.

Things aren’t much different in WebRTC-land and browsers these days.

If I had to guess, here’s what I’d say is happening:

  • Developers are the main customers of WebRTC and the implementation of WebRTC in browsers
  • Browser vendors are working hard on getting WebRTC to work, but at times neglected this minor issue of empowering developers with their testing needs
  • Testing tools provided by browsers specifically for WebRTC are second class citizens when it comes to… well… almost everything else in the browser

The First 5 Years

Up until now, Chrome was the most accommodating browser out there when it came to us being able to adopt it and automate it for our own needs. It was never easy even with Chrome, but it is working, so it is hard to complain.

Chrome gives us out of the box the following set of capabilities:

  1. Support for Selenium and WebDriver, which allows us to automate it properly (for most versions, most of the times, when things don’t go breaking up on us suddenly). Firefox has similar capabilities
  2. The webrtc-internals Chrome tab with all of its goodness and data
  3. Ability to easily replace raw inputs of camera and microphone with media files (even if at times this capability is buggy)

We’ve had our share of Chrome bugs that we had to file or star to get specific features to work. Some of it got solved, while others are still open. That’s life I guess – you win some and you lose some.

Firefox was not that fun, to say the least. We’ve been struggling for a long time with it trying to get it to behave with Selenium inside a Docker container. The end result never got beyond 5 frames per second. Somehow, the combination of technologies we’ve been using didn’t work and never got the attention of Mozilla to take a look at – it may well be our own ignorance of how and where to nag the Mozilla team to get that attention 🙂

Edge? Had nothing – or at least not close to the level that Chrome and Firefox have on offer. We will get there. Eventually.

This has been the status quo for quite some time. Perhaps the whole 5 years of WebRTC’s existence.

But now things are changing.

And they are becoming rather interesting.

Mozilla Wiresharking

Mozilla introduced last month the ability to log RTP headers in Firefox WebRTC sessions.

While Chrome had something similar for quite some time, Firefox took this a step further:

“Bug 1343640 adds support in Firefox version 55 to log the RTP header plus the first five bytes of the payload unencrypted. RTCP will be logged in full and unencrypted.”

The best thing though? It also shared a script that can convert these logs to PCAP files, making them readable in Wireshark – a popular open source tool for analyzing network traffic.

The end result? You can now analyze with more clarity what goes on the network and how the browser behaves – especially if you don’t have a media server in the middle (or if you haven’t invested in tools that enable you to analyze it already).

This isn’t a first for Mozilla. It seems that lately, they have been sharing some useful information and pieces of code on their new Advancing WebRTC blog – a definite resource you should be following if you aren’t already.

Edge Does BrowserStack

Microsoft has been on a very positive streak lately. For over a year now, most of the Microsoft announcements are actually furthering the cause of their customers and developers without creating closed gardens – something that I find refreshing.

When it comes to WebRTC, Microsoft recently released a new version of Edge (in beta still) that is interoperable with Chrome and Firefox – on the codec level. While that was a rather expected move, the one we’ve seen last week was quite surprising and interesting.

An Edge testing partnership with BrowserStack: If you want to test your web app on the Edge browser, you can now use BrowserStack for free to do that (there are a few free plans there for it).

How does WebRTC comes to play here? As an enabler to a new feature that got introduced there:

See how that Edge window inside a Chrome app running on a Mac looks?

Guess what – BrowserStack are using WebRTC to enable this screen casting feature. While the original Microsoft announcement removed any trace of WebRTC from it, you can still find that over the web (here, here and here for example). For the geeks, we have a webrtc-internal dump!

The feature is called “Live Testing” at BrowserStack and offers the ability to run a cloud machine running Windows 10 and the Edge browser – and have that machine stream its virtual screen to your local machine – all assuming the local browser you are using for it all supports WebRTC.

In a way, this is a replacement of VNC (which is what we use at testRTC to offer this capability).

Is this coming from Microsoft? From BrowserStack?

I don’t really think it matters. It shows how WebRTC is getting used in new ways and how browser vendors are a major part of this change.

Will Google even care?

Google has been running along with WebRTC, practically on their own.

Yes. Mozilla with Firefox was there from the beginning. Microsoft is joining with Edge. Apple is slowly being dragged into it if you follow the rumormill.

But Google has been setting the tone through the initial acquisitions it made and the ongoing investment in it – both in engineering and in marketing. The end result for Google’s investments (not only in WebRTC but in everything HTML5 related)? Desktop browsers market share dominance

With these new toys that other browser vendors are giving us developers and testers – may that be something to reconsider and revisit? We are the early adopters of browsers, and we usually pick and choose the ones that offer us the greater power and enable us to speed our development efforts.

I wonder if Google will answer in turn with its own new tools and initiatives or continue in their current trajectory.

Should we expect better tooling?

Yes. Definitely.

WebRTC is hard to develop compared to other HTML5 technologies and it is a lot harder to test. Test automation frameworks and commercial offerings tend to focus on the easier problems of browser testing and they often neglect WebRTC, which is where we try to fill in these gaps.

I for once, would appreciate a few more trinkets from browser vendors that we could adopt and use at testRTC.

Shocking – most apps are dealing with production bugs

I am not sure about you, but I get bored easily when people tell me a bug costs more in production than it does earlier on in the development lifecycle. It sounds correct, but usually it comes with product managers and sales people throwing out $$$ amounts trying to make a point of it.

Being in a company offering testing and monitoring puts me in an awkward when I am supposed to actually use such tactics with customers. And I hate it. So I try to stick to fact. Real hard facts. This is why I found ClusterHQ’s recent survey about application testing so interesting. I do know this information comes in part from a company selling testing products. I am also aware that this is a survey that is rather small and not coming from the academia (a place where real products don’t get made). But it still resonates with me.

I liked the questions ClusterHQ asked, and wanted to share here two of these:

Cost of bugs in production

I guess there are no surprises here, besides maybe the people who think finding bugs in development is expensive.

There are two issues that make production bugs really expensive:

  1. If customers find them, then it means you have someone complaining already. This can lead to churn – customers leaving your service. If it something critical that affects a large number of your customers, then you’re screwed already
  2. To fix a bug in production takes time. You usually want to recreate it in on of your internal environments, then fix it, then test the whole damn application again to see that nothing else broke and then upgrade production again. This time eats resources – development, testing and management

It always happens. There is no way to really get away from bugs in production – the question though, is the frequency in which they occur. Which brings us to the next question in this survey.

How often are bugs found in production

The frequency in which bugs are found in production. At these high rates, I wonder how things ever get solved.

With agile development, you can argue that these are non-issues. You are going to fix things on a daily or weekly basis, so anything found in production get squashed away rather fast and without too much of a hassle.

I am no expert in agile, but from looking at how WebRTC products are built, I think there are three areas where this approach is going to come back and bite you:

#1 – WebRTC relies on the browser

If your WebRTC product runs in a browser, then you relinquish some of your control to the browser vendors. And they are known to release their versions quite frequently (once every 6-8 weeks in an automated upgrade process). When it comes to WebRTC, they do tend to make changes that affect behavior and these may end up breaking your service.

How do you make sure you are not caught surprised by this? Do you test with the beta browser versions that are available? Do you make it a point to test this continuously or do you limit yourself to testing only when you release a new version?

#2 – More often than not, you rely on 3rd party frameworks (open source or commercial)

You use Kurento? Some other open source framework? Maybe a commercial product that acts as a media server or a gateway? A signaling framework you found on github? Or maybe it is a CPaaS vendors you opted for who is taking care of all communications for you.

Guess what – these things also need testing. Especially since you are using them in your own special way. I’ve been there, so I know it is hard to test every possible use case and every different way an API can be called. So thinks fall between the cracks.

When dealing with such issues and finding them in YOUR production – how long will it take that framework or product to be fixed so you can roll it out to your customers? Will it be at your development speeds or someone else’s?

#3 – Stress and Scale is devilishly hard to get right

Whenever someone starts using our service to test at scale, things break down. It can be minor things, like the fact that most services aren’t designed or built to get 10 people into the same session at the exact same moment (something that is hard to test so we rely on users just refreshing their browser). But it goes to serious issues, like degradation in bit rates and increase in packet losses the more people you throw on the service.

Finding these issues is one thing. Fixing it… that’s another one. Fixing large scale bugs is tough. It is tough because you need a way to reproduce them AND you need to find the culprit causing them.

If you don’t have a good way to reproduce large scale tests, then how are you supposed to be able to fix them?

What’s next?

If you end up using testRTC or not I leave for you to decide. We do have a product that takes care of many of the challenges when you test WebRTC products. So I invite you to try us out.

If you don’t – just do me a favor and take testing your product more seriously. When we work through evaluations, we almost often find bugs in production, and usually more than one. And that’s just from a single basic script we start with. It is time to look at WebRTC as more than a hobby.

Have you found serious bugs in production that you could have found and fixed if you tested WebRTC during development?

WebRTC: To Mechanical Turk or NOT to Mechanical Turk

I’ve seen this a few times already. People look at an automated process – only to replace it with a human one. For some reason, there’s a belief that humans are better. And grinding the same thing over and over and over and over and over again.

They’re not. And there’s a place for both humans and machines in WebRTC product testing.

WebRTC, Mechanical Turk and the lack of consistency

The Amazon Mechanical Turk is a great example. You can easily take a task, split it between many people, and have them do it for you. Say you have a list of a million songs and you wish to categorize them by genre. You can get 10,000 people in Amazon Mechanical Turk to do 100 lines each from that list and you’re done. Heck, you can have each to 300 lines and for each line (now with 3 scores), take the most common Genre defined by the people who classified it.

Which brings us to the problem. Humans are finicky creatures. Two people don’t have the same worldview, and will give different Genre indication to the same song. Even worse, the same person will give a different Genre to the same song if enough time passes (enough time can be a couple of minutes). Which is why we decided to show 3 people the same song to begin with – so we get some conformity in the decision we end up with on the Genre.

Which brings us to testing WebRTC products. And how should we approach it.

Here’s a quick example I gleaned from the great discuss-webrtc mailing list:

discuss-webrtc bug report

There’s nothing wrong with this question. It is a valid one, but I am not sure there’s enough information to work off this one:

  • What “regardless of the amount of bandwidth” is exactly?
  • Was this sent over the network or only done locally?
  • What resolution and frame rate are we talking about?
  • Might there be some packet loss causing it?
  • How easy is it to reproduce?

I used to manage the development of VoIP products. One thing we were always challenged by is the amount of information provided by the testing team in their bug reports. Sometimes, there wasn’t enough information to understand what was done. Other times, we had so many unnecessary logs that you either didn’t find what was needed or felt for the poor tester who spent so much time collecting this stuff together for you with no real need.

The Tester/Developer grind cycle

Then there’s that grind:

Test-Dev grind cycle

We’ve all been there. A tester finds what he believes is a bug. He files it in the bug tracking system. The developer can’t reproduce the bug, or needs more information, so the cycle starts. Once the developer fixes something, the tester needs to check that fix. And then another cycle starts.

The problem with these cycles is that the tester who runs the scenario (and the developer who does the same) are humans. Which makes it hard for repeated runs of the same scenario to end up the same.

When it comes to WebRTC, this is doubly so. There are just too many aspects that are going to affect how the test scenario will be affected:

  • The human tester
  • The machine used during the test
  • Other processes running on said machine
  • Other browser tabs being used
  • How the network behaves during the test

It is not that you don’t want to test in these conditions – it is that you want to be able to repeat them to be able to fix them.

My suggestion? Mix and match

Take a few cases that goes through the fundamental flows of your service. Automate that part of your testing. Don’t use some WebRTC Mechanical Turk in places where it brings you more grief than value.

Augment it with human testers. Ones that will be in charge of giving the final verdict on the automated tests AND run around with their own scenarios on your system.

It will give you the best of both worlds, and with time, you will be able to automate more use cases – covering regression, stress testing, etc.

I like to think of testRTC as the Test Engineer’s best companion – we’re not here to replace him – just to make him smarter and better at his job.

2

Why we are Using Real Browsers to Test WebRTC Services?

The most important decision we made was one that took place before testRTC became a company. It was the decision to use a web browser as the agent/probe for our service instead of building something on top of WebRTC directly or god forbid GStreamer.

Here are a few things we can do because we use real browsers in WebRTC testing:

#1 – Time to Market

Chrome just released version 49.

How long will it take for you to test its behavior against your WebRTC service if you are simulating traffic instead of using this browser directly?

For us, the moment a browser gets released is almost the moment we can enable it for our customers.

To top it off, we enable access to our customers to the upcoming  browser versions as well – beta and unstable. This helps those who need to test their service check and get some confidence in their service when running them against future versions of browsers.

Even large players in the WebRTC industry can be hit by browser updates – TokBox did some time ago, so being able to test and validate such issues earlier on is imperative.

#2 – Pace of Change

VP9? H.264? ORTC APIs? Deprecation of previous APIs? Replacement of the echo canceler?  Addition of local recording APIs? Media forwarding?

Every day in WebRTC brings with it yet another change.

Browsers get updated in 6-8 weeks cycles, and the browser vendors aren’t shy about removing features or adding new ones.

Maintaining such short release cycles is hellishly tough. For an established vendors (testing or otherwise), it is close to impossible – they are used to 6-12 months release cycles at best. For startups it is just too much of a hassle to run at these speeds – what you are trying to achieve at this point is leverage others and focus on the things you need to do.

So if the browser is there, it gets frequently updated, and it is how the end users end up running the service, why can’t we use it ourselves to leverage both automated and manual testing?

It was stupidly easy for me to test VP9 with testRTC even before it was officially released in the browser. All I had to do was pick the unstable version of the browser testRTC supports and… run the test script we already had.

The same is true for all other changes browsers make in WebRTC or elsewhere – they become available to us ad our customers immediately. And in most cases, with no development at all on our part.

#3 – Closest to Reality

You decided to use someone who simulates traffic and follows the WebRTC spec for your testing.

Great.

But does it act like a browser?

Chrome and Firefox act different through the API calls and look different on the wire. Hell – the same browser in two different versions acts differently.

Then why the hell use a third party who read the WebRTC spec and interpreted it slightly different than the browser used at the end of the day? Count the days. In each passing day, that third party is probably getting farther away from the browsers your customers are using (until someone takes the time and invests in updating it).

#4 – Signaling Protocols

When we started this adventure we are on with testRTC, we needed to decide what signaling to put on top of WebRTC.

Should it be SIP over WebSocket? Covering the traditional VoIP market.

Maybe we should to for XMPP. Over BOSH. Or Comet. Or WebSocket. Or not at all.

Should we add an API on top that the customer integrates with in order to simulate the traffic and connect to his own signaling?

All these alternatives had serious limitations:

  • Picking a specific signaling protocol would have limited our market drastically
  • Introducing an integration API for any signaling meant longer customer acquisition cycles and reducing our target market (yet again)

A browser on the other hand… that meant that whatever the customer decided to do – we immediately support. The browser is going to drive the interaction anyway. Which is why we ended up using browsers as the main focus of our WebRTC testing and monitoring service.

#5- Functional Testing and Business Processes

WebRTC isn’t tested in vacuum. When you used to use VoIP – things were relatively easy. You have the phone system. It is a service. You know what it does and how it works. You can test it and any of its devices and building blocks – it is all standardized anyway.

WebRTC isn’t like that. It made VoIP into a feature. You have a dating site. In that site people interact in multiple ways. They may also be doing voice and video calls. But how they reach out to each other, and what business processes there are along the way – all these aren’t related to VoIP at all.

Having a browser meant we can add these types of tests to our service. And we have customers who check the logic of their site and backend while also checking the media quality and the WebRTC traffic. It means there’s more testing you can do and more functionality of your own service you can cover with a single tool.

Thinking of Testing Your WebRTC Service?

Make sure a considerable part of the testing you do happens with the help of browsers.

Simulators and traffic generators are nice, but they just don’t cut it for this tech.