Category Archives for "How to"

1

How to Prepare Your WebRTC Application for a Surge in Traffic

OK, this is the moment you’ve been waiting for: there’s a huge surge in traffic on your WebRTC application. Success! You even had the prescience to place all of your web application’s assets on a CDN and whatever uptime monitoring service you use, be it New Relic, Datadog or a homegrown Nagios solution – says all is fine. But there’s just one nagging problem – users are complaining. More than they used to. Either because the service doesn’t work at all for them or the quality of the media just doesn’t cut it for them. What The–?!

We recently hosted a webinar about preparing for that big WebRTC launch. You might want to check the suggestions we made there as well.

Register now for free: WebRTC – How NOT to Fail in Your Big Launch

Let’s start by focusing on the positives here. Your service is being used be people. Then again, these people aren’t getting the real deal – the quality they are experiencing isn’t top notch. What they are experiencing is inability to join sessions, low bitrates or inexplicable packet losses. These are different than your run of the mill 500 and 502 errors, and you might not even notice something is wrong until a user complains.

So, what now?

Here’s what I’m going to cover today:

  1. Learn how to predict service hiccups
  2. Prepare your WebRTC application in advance for growth

Learn How to Predict Service Hiccups

While lots of users is probably what you are aiming for in your business, the effects they can have on your WebRTC application if unprepared for it can be devastating. Sure, sometimes they’ll force your service to go offline completely, but in many other times, the service will keep on running but it will deliver bad user experience. This can manifest itself by having users wait for long times to connect, requiring them to refresh the page to connect or just having poor audio and video quality.

Once you get to that point, it is hard to know what to do:

  • Do you throw more machines on the problem?
  • Do you need to check your network connections?
  • How do you find the affected users and tell them things have been sorted out?

This mess is going to take up a lot of your time and attention to resolve.

Here is something you can do to try and predict when these hiccups are about to hit you:

Establish a Baseline

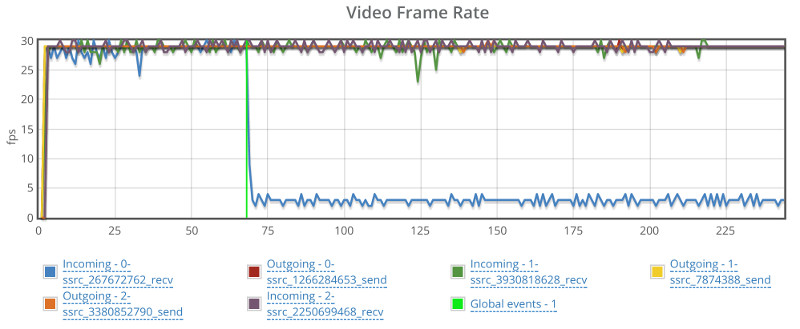
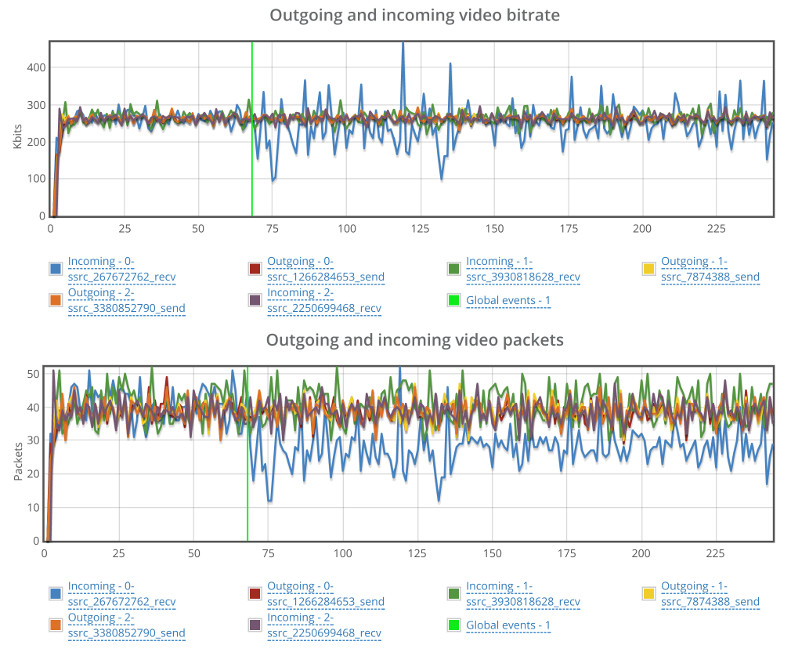
I’ve said it before and I’ll say it again. You need to understand the performance metrics of your WebRTC service. In order to do that, the best thing is to run it a bit with the acceptable load that you have and writing down for yourself the important metrics.

A few that come to mind:

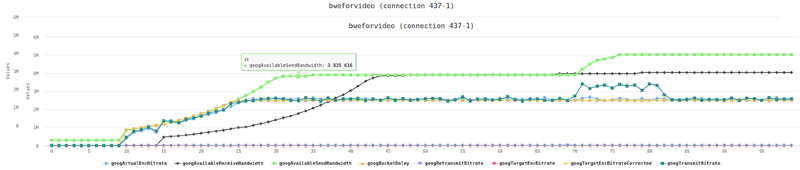
  • Bitrate of the channels
  • Average packet loss
  • Jitter

Now that you have your baseline, take the time to gauge what exactly your WebRTC application is capable of doing in terms of traffic. How much load can it carry as you stack up more users?

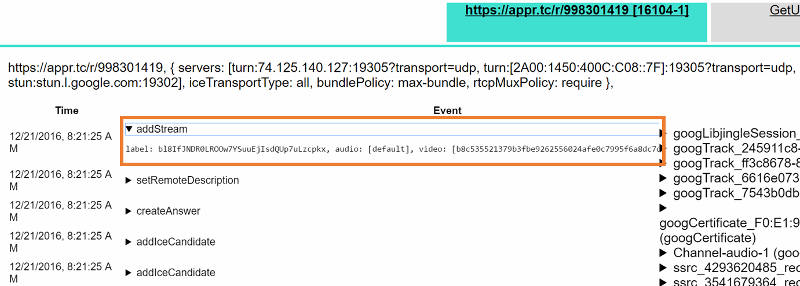
One neat trick you can do is place a testRTC monitor and use rtcSetTestExpectation() to indicate the thresholds you’ve selected for your baseline. Things like “I don’t expect more than 0.5% packet loss on average” or “average bitrate must be above 500kbps”. The moment these thresholds are breached – you’ll get notified and able to see if this is caused by growth in your traffic, changes in usage behavior, etc.

Prepare Your WebRTC Application in Advance for Growth

There aren’t always warning signs that let you know when a rampaging horde of users may come at your door. And even when there is, you better have some kind of a solution in place and be prepared to react. This preparation can be just knowing your numbers and have a resolution plan in place that you can roll out or it can be an automated solution that doesn’t require any additional effort on your end.

To get there, here are some suggestions I have for you.

Find Your System’s Limits

In general, there are 3 main limits to look at:

  1. How big can a single session grow?
  2. How many users can I cram into a single server?
  3. How many users can my service serve concurrently?

You can read more on strategies and planning for stress testing and sizing WebRTC services. I want to briefly touch these limits though.

1. How big can a single session grow?

Being able to handle 500 1:1 sessions doesn’t always scale to 100 groups of 10 users sessions. The growth isn’t linear in nature. On top of it, the end result might choke your server or just provide bitrates that are just too low above a certain number of users.

Make sure you know what’s the biggest session size you are willing to run.

Besides doing automated testing and checking the metrics against the baseline you want, you can always run an automated test using testRTC and at the same time join from your own browser to get a real feeling of what’s going on. Doing that will add the human factor into the mix.

2. How many users can I cram into a single server?

Most sizing testing are about understanding how many sessions/users/whatever can you fit in a single server. Once you hit that number, you should probably launch another server and use a load balancer to scale out.

Getting that number figured out based on your specific scenario and infrastructure is important.

3. How many users can my service serve concurrently?

Now that you know how to scale out from a single server, growing can be thought of as linearly (up to a point). So it is probably time to put in place automatic scale out and scale down and test that this thing works nicely.

Doing so will greatly reduce the potential and destruction that a service hiccup can cause.

CDN and Caching

Make sure all of the HTML assets of your WebRTC application that static are served through a CDN.

In some cases, when we stress test services, just putting 200 browsers in front of an HTML page that serves a WebRTC application can cause intermittent failures in loading the pages. That’s because the web serving part of the application is often neglected by WebRTC developers who are focusing their time and energy on the bigger resource hogs.

We’ve had numerous cases where the first roadblock we’ve hit with a customer was him forgetting to place a minor javascript file in the CDN.

Don’t be that person.

Geographically Distributed Deployment

The web and WebRTC are global, but traffic is local.

You don’t want to send users to the other side of the globe unnecessarily in your service. You want your media and NAT traversal servers to be as close to the users as possible. This gives you the flexibility of optimizing the backend network when needed.

Make sure your deployment is distributed along multiple datacenters, and that the users are routed to the correct one.

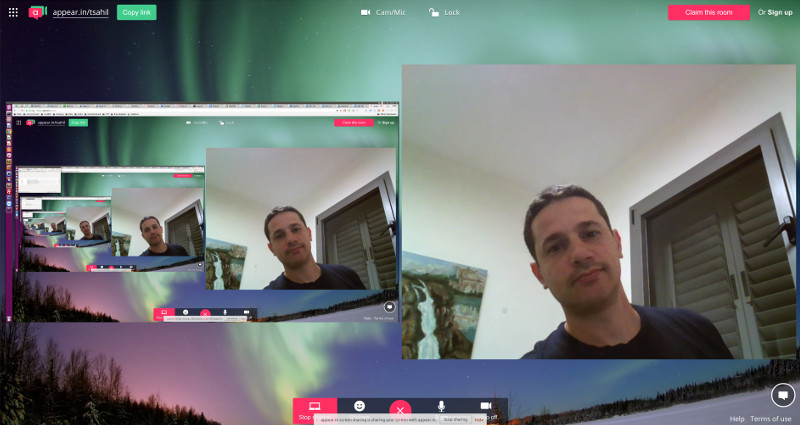
Philipp Hancke wrote how they do it at appear.in for their TURN servers.

Monitor Everything

CPU. Memory. Storage. Network. The works.

Add application metrics you collect from your servers on top of it.

And then add a testRTC monitor to check media quality end-to-end to make sure everything run consistently.

Check across large time spans if there’s an improvement or degradation of your service quality.

Stress Testing

Check your system for the load you expect to be able to handle.

Do it whenever you upgrade pieces of your backend, as minor changes there may cause large changes in performance.

Don’t Let Things Out of Your Control

WebRTC has a lot of moving parts in it so deploying it isn’t as easy as putting up a WordPress site. You should be prepared for that surge in traffic, and that means:

  1. Understanding the baseline quality of your service
  2. Knowing where you stand with your sizing and scale out strategy
  3. Monitoring your service quality so you can react before customers start complaining

Do it on your own. Use testRTC. Use whatever other tool there is at your disposal.

Just make sure you take this seriously.

We recently hosted a webinar about preparing for that big WebRTC launch. You might want to check the suggestions we made there as well.

Register now for free: WebRTC – How NOT to Fail in Your Big Launch

5

Just Landed: Automated WebRTC Screen Sharing Testing in testRTC

Well… this week we had a bit of a rough start, but we’re here. We just updated our production version of testRTC with some really cool capabilities. The time was selected to fit with the vacation schedule of everyone in this hectic summer and also because of some nagging Node.js security patch.

As always, our new release comes with too many features to enumerate, but I do want to highlight something we’ve added recently because of a couple of customers that really really really wanted it.

Screen sharing.

Yap. You can now use testRTC to validate the screen sharing feature of your WebRTC application. And like everything else with testRTC, you can do it at scale.

This time, we’ve decided to take appear.in for a spin (without even hinting anything to Philipp Hancke, so we’ll see how this thing goes).

First, a demo. Here’s a screencast of how this works, if you’re into such a thing:

Testing WebRTC Screen Sharing

There are two things to do when you want to test WebRTC screen sharing using testRTC:

  1. “Install” your WebRTC Chrome extension
  2. Show something interesting

#1 – “Install” your WebRTC Chrome extension

There are a couple of things you’ll need to do in the run options of the test script if you want to use screen sharing.

This is all quite arcane, so just follow the instructions and you’ll be good to go in no time.

Here’s what we’ve placed in the run options for appear.in:

#chrome-cli:auto-select-desktop-capture-source=Entire screen,use-fake-ui-for-media-stream,enable-usermedia-screen-capturing #extension:https://s3-us-west-2.amazonaws.com/testrtc-extensions/appearin.tar.gz

The #chrome-cli thingy stands for parameters that get passed to Chrome during execution. We need these to get screen sharing to work and to make sure Chrome doesn’t pop up any nagging selection windows when the user wants to screen share (these kills any possibility of automation here). Which is why we set the following parameters:

  • auto-select-desktop-capture-source=Entire screen – just to make sure the entire screen is automatically selected
  • use-fake-ui-for-media-stream – just add it if you want this thing to work
  • enable-usermedia-screen-capturing – just add it if you want this thing to work

The #extension bit is a new thing we just added in this release. It will tell testRTC to pre-install any Chrome extensions you wish on the browser prior to running your test script. And since screen sharing in Chrome requires an extension – this will allow you to do just that.

What we pass to #extension is the location of a .tar.gz file that holds the extension’s code.

Need to know how to obtain a .tar.gz file of your Chrome extension? Check out our Chrome extension extraction guide.

Now that we’ve got everything enabled, we can focus on the part of running a test that uses screen sharing.

#2 – Show something interesting

Screen sharing requires something interesting on the screen, preferably not an infinite video recursion of the screen being shared in one of the rectangles. Here’s what you want to avoid:

And this is what we really want to see instead:

The above is a screenshot that got captured by testRTC in a test scenario.

You can see here 4 participants where the top right one is screen sharing coming from one of the other participants.

How did we achieve this in the code?

Here are the code snippets we used in the script to get there:

var videoURL = "https://www.youtube.com/tv#/watch?v=INLzqh7rZ-U";

client
   .click('.VideoToolbar-item--screenshare.jstest-screenshare-button')
   .pause(300)
   .rtcEvent('Screen Share ' + agentSession, 'global')
   .rtcScreenshot('screen share ')
   .execute("window.open('" + videoURL + "', '_blank')")
   .pause(5000)

   // Switch to the YouTube
   .windowHandles(function (result) {
       var newWindow;
       newWindow = result.value[2];
       this.switchWindow(newWindow);
   })
   .pause(60000);
   .windowHandles(function (result) {
       var newWindow;
       newWindow = result.value[1];
       this.switchWindow(newWindow);
   });

We start by selecting the URL that will show some movement on the screen. In our case, an arbitrary YouTube video link.

Once we activate screen sharing in appear.in, we call rtcEvent which we’ve seen last time (and is also a new trick in this new release). This will add a vertical line on the resulting graphs so we know when we activated screen sharing (more on this one later).

We call execute to open up a new tab with our YouTube link. I decided to use the youtube.com/tv# URL to get the video to work close to full screen.

Then we switch to the YouTube in the first windowHandles call.

We pause for a minute, and then go back to the appear.in tab in the browser.

Let’s analyze the results – shall we?

Reading WebRTC screen sharing stats

Screen sharing is similar to a regular video channel. But it may vary in resolution, frame rate or bitrate.

Here’s how the appear.in graphs look like on one of the receiving browsers in this test run. Let’s start with the frame rate this time:

Two things you want to watch for here:

  1. The vertical green line – that’s where we’ve added the rtcEvent call. While it was added to the browser who is sending screen sharing, we can see it on one of the receiving browsers as well. It gets us focused on the things of interest in this test
  2. The incoming blue line. It starts off nicely, oscillating at 25-30 frames per second, but once screen sharing kicks in – it drops to 2-4 frames per second – which is to be expected in most scenarios

The interesting part? Appear.in made a decision to use the same video channel to send screen sharing. They don’t open an additional video channel or an additional peer connection to send screen sharing, preferring to repurpose an existing one (not all services behave like that).

Now let’s look at the video bitrate and number of packets graphs:

The video bitrate still runs at around 280 kbps, but it oscillates a lot more. BTW – I am using the mesh version of appear.in here with 4 participants, so it is going low on bitrate to accommodate for it.

The number of video packets per second on that incoming blue line goes down from around 40 to around 25. Probably due to the lower number of frames per second.

What else is new in testRTC?

Here’s a partial list of some new things you can do with testRTC

  • Manual testing service
  • Custom network profiles (more about it here)
  • Machine performance collection and visualization
  • Min/max bands on high level graphs
  • Ignore browser warnings and errors
  • Self service API key regeneration
  • Show elapsed time on running tests
  • More information in test runs on the actual script and run options used
  • More information across different tables and data views

Want to check screen sharing at scale?

You can now use testRTC to automate your screen sharing tests. And the best part? If you’re doing broadcast or multiparty, you can now test these scales easily for screen sharing related issues as well.

If you need a hand in setting up screen sharing in our account, then give us a shout and we’ll be there for you.

5

Cross Platform WebRTC Browser Testing: Chrome, Firefox, Edge & Safari

This is a guest post by Philipp Hancke. He was kind enough to share the work he’s done already in automating his own WebRTC Safari tests.

Now that Apple added WebRTC to its Safari browser, it is time to ask –

How do you test WebRTC four browsers on different operating systems? Using Selenium Grid it is surprisingly easy, learn how.

Webkit recently joined the WebRTC ship which means we now have 5 major browsers to test:

  • Chrome, any operating system
  • Firefox, any operating system
  • Microsoft Edge, Windows 10
  • Safari (Technology Preview), OSX

Until a few days ago it was feasible to run tests all WebRTC supported browsers only on a single operating system (Getting Chrome, Firefox and Edge tested on Windows 10). With Safari, that has changed. Sounds like a big problem, no?

This kind of testing is typically done using Selenium which is used to remotely control the browser. And if it is remotely controlled it can be done with selenium’s grid functionality. Which is surprisingly easy.

Say we want to test Edge and Safari from a Windows machine. First step is to download the selenium standalone jar file. I am still sticking to version 3.3.1. Next, set up a selenium grid hub on one machine by running:

java -jar selenium-server-standalone-3.3.1.jar -role hub

This will start a hub which is where you connect your selenium nodes as well as test clients to. It will also tell you the URL that you need to connect your nodes to.

Next, start a node on your OSX machine by running:

java -jar selenium-server-standalone-3.3.1.jar -role node -hub http://where-your-hub-tells-you-it-is-running -browser “browserName=safari”

This will start a node that will run your Safari instance.

Now, in the code running selenium you need to instruct it to do two things:

  • Use Safari Technology Preview as shown in this PR
  • Make it use the hub as shown here

Next run your test code. If it works out of the box, great. If it does not you will probably spend a lot of time figuring out the issues. The most common issue here is forgetting to include the respective WebDriver binary in a path where it is found.

9

The Missing chrome://webrtc-internals Documentation

There’s a wealth of information tucked into the chrome://webrtc-internals tab, but there was up until recently very little documentation about it. So we set out to solve that, and with the assistance of Philipp Hancke wrote a series of articles on what you can find in webrtc-internals and how to make use of it.

The result? The most up to date (and complete) webrtc-internals documentation.

To make sure it doesn’t get lost, here are the links to the various articles:

  1. webrtc-internals and getstats parameters – a detailed view of webrtc-internals and the getstats() parameters it collects
  2. active connections in webrtc-internals – an explanation of how to find the active connection in webrtc-internals – and how to wrap back from there to find the ICE candidates of the active connection
  3. webrtc-internals API trace – a guide on what to expect in the API trace for a successful WebRTC session, along with some typical failure cases

Enjoy!

1

Your best WebRTC debugging buddy? The webrtc-internals API trace

This time, we take you through the webrtc-internals API trace to see what can you learn from it.

To make this article as accurate as possible, I decided to go to my source of truth for the low level stuff related to WebRTC – Philipp Hancke, also known as fippo or hcornflower. This in a way, is a joint article we’ve put together.

Before we do, though, you should probably check out the other articles in this series:

  1. Parameter’s meaning in webrtc-internals
  2. Finding the current active connection in webrtc-internals

Now back to the API trace.

WebRTC is asynchronous

Here’s something you probably already noticed. WebRTC is asynchronous to the extreme. It almost painstakingly makes sure that whatever you are trying to achieve – you won’t be able to without multiple calls in different contexts of your JavaScript app in the browser.

It isn’t because the authors of WebRTC are mean. It is because the nature of communications is asynchronous. It is made worse by the various network topologies that require the use of curses like STUN, TURN and ICE and by the fact that we require the user to authorize things like accessing his camera.

This brings us to the tricky situation of error handling. With WebRTC, it takes place everywhere. Anything you do can fail twice:

  1. When you call the API and it returns
  2. When the callback/promise/event handler/whatever returns back with the result of your API call

This means that in many cases, you are going to be left with a half baked solution that looks at some of the error cases (did you ever see a sample that takes care of edge cases or failure scenarios?).

It also means that often times you’ll need to be able to debug them. And that’s what the API trace in webrtc-internals can help you with.

The webrtc-internals API trace

If you open chrome://webrtc-internals while in an active WebRTC session, you will immediately see the API trace:

WebRTC API trace sample

This is the list of API calls and events done on the peer connection, informing you of the progress and state of the connection.

You can click on any of these APIs to see its parameters.

WebRTC API trace click to expand

Before we look at what kind of analysis we can derive from these traces, let’s look at what some of the connection methods and events do.

    • addStream: if this method was called, the Javascript code has added a MediaStream to the peerconnection. You can see the id of the stream as well as the audio and video tracks. onAddStream shows a remote stream being added, including the audio and video track ids, it is called between the setRemoteDescription call and the setRemoteDescriptionOnSuccess callback
    • createOffer shows any calls to this API including the options such as offerToReceiveAudio, offerToReceiveVideo or iceRestart. createOfferOnSuccess shows the results of the createOffer call, including the type (which should be ‘offer’ obviously) and the SDP resulting from it. createOfferOnFailure could also be called indicating an error but that is quite rare
    • createAnswer and createAnswerOnSuccess and createAnswerOnFailure are similar but with no additional options
    • setLocalDescription shows you the type and SDP used in the setLocalDescription call. If you do any SDP munging between createOffer and setLocaldescription you will see this here. This results in either a setLocalDescriptionOnSuccess or setLocalDescriptionOnFailure callback which shows any errors. The same applies to the setRemoteDescription and its callbacks, setRemoteDescriptionOnSuccess and setRemoteDescriptionOnFailure
    • onRenegotiationNeeded is the old chrome-internal name for the onnegotiationneeded event. If your app uses this you might want to look for it
    • onSignalingStateChange shows the changes in the signaling state as a result of calls to setLocalDescription and setRemoteDescription. See the wonderful diagram in the specification for the gory details. At the end of the day, you will want to be in the stable state most of the time
    • iceGatheringStateChange is the little brother of the ice connection state. It will show you the state of the ice gatherer. It will change to gathering after setLocalDescription if there are ICE candidates to gather
    • onnicecandidate events show all candidates gathered, with information for which m-line and MID. Likewise, the addIceCandidate method shows that information from the other side. Typically you should see both event types. See below for a more detailed discussion of these events
    • oniceconnectionstate is one of the most important event handlers. It tells you whether a peer-to-peer connection succeeded or not. From here, you can start searching for the active candidate as we explained in the previous post

The two basic flows we can see are that of something offering connections and answering. The offerer case will typically consist of these events:

WebRTC API Trace - offer side

  • (addStream if the local side wants to send media)
  • createOffer
  • createOfferOnSuccess
  • setLocalDescription
  • setLocalDescriptionOnSuccess
  • setRemoteDescription
  • (onaddstream if the remote end signalled media streams in the SDP)
  • setRemoteDescriptionOnSuccess

While the answerer case will have:

WebRTC API Trace - answer side

  • setRemoteDescription
  • (onaddstream if the remote end signalled media streams in the SDP)
  • createAnswer
  • createAnswerOnSuccess
  • setLocalDescription
  • setLocalDescriptionOnSuccess

In both cases there should be a number of onicecandidate events and addIceCandidate calls along with signaling and ice connection state changes.

Let us look at two specific cases next.

Example #1 – My WebRTC app works locally but not on a different network!

This is actually one of the most frequent questions on the discuss-webrtc list or on stackoverflow. Most of the time the answer is “you need a TURN server” and “no, you can not use some TURN server credentials that you found somewhere on the internet”.

So it works locally. That means that you are creating an offer, sending it to the remote side, calling setLocalDescription() and are getting an answer that you feed into setRemoteDescription(). It also means that you are getting candidates in the onicecandidate() event, sending them to the remote side and getting candidates from there which you call the addIceCandidate() method with.

And locally you get a oniceconnectionstatechange() event to connected or completed:

WebRTC API trace - ICE state changes

Great! You probably just copied and pasted these pieces of code from somewhere on github.

Now… why does it not work when you’re on a different network? On different networks, you need both a STUN and a TURN server. Check if your app is using a STUN and TURN server and that you’re passing them correctly at the top of webrtc-internals:

NAT configuration in webrtc-internals

As you can see (assuming you have good eyes), there are a number of ice servers used here. In the case of our screenshot, it’s Google’s apprtc sample. There is a stun server, stun:stun.l.google.com:19302. There are also four TURN servers:

  1. turn:64.233.165.127:19305?transport=udp
  2. turn:[2A00:1450:4010:C01::7F]:19305?transport=udp
  3. turn:64.233.165.127:443?transport=tcp
  4. turn:[2A00:1450:4010:C01::7F]:443?transport=tcp

As you can see, apprtc uses TURN over both UDP and TCP and is running TURN servers for both IPv4 and IPv6.

Now just because you configured a TURN server does not mean there won’t be any errors. The TURN server might not be reachable. Or your credentials might not work (this will happen if you “found” the credentials on a list of “free public servers”). In order to verify that the STUN and TURN servers you use actually work you need to look at the onicecandidate() events.

If you use a STUN or a TURN server, you should see a onicecandidate() event with a candidate that has a ‘typ srflx’.

Similarly, if you use a TURN server, you need to check if you get an onicecandidate() event where the candidate has a ‘typ relay’.

Note that Chrome stops gathering candidates once it establishes a connection. But if your connection gets established you are probably not going to debug this issue.

If you get both of these you’re fine. But you also need to check what candidates your peer sent you with which addIceCandidate() was called.

Example #2 – The network is blocking my connection

Networks that block UDP traffic are quite common. TURN/TCP and TURN/TLS (as well as ICE-TCP even though we mention this mostly to make Emil Ivov happy) provide a way to enable calls even on those networks. This has some effect on the media quality as we discussed previously but let us see how we can detect whether we are on a network that is blocking UDP traffic to begin with.

If you want to follow along, open webrtc-internals and the webrtc candidate gathering demo page and start gathering. By default, it uses one of Google’s STUN servers. To keep things simple, uncheck the “gather IPv6 candidates” and “gather RTCP candidates” boxes before clicking on the “gather candidates” button:

Uncheck ICE gathering candidates

On webrtc-internals you will see a createOffer call with offerToReceiveAudio set to true (this is to create an m-line and gather candidates for it):

WebRTC ICE gathering receive audio

Followed by a createOfferOnSuccess and a setLocalDescription call. After that there will be a couple of onicecandidate events and an icegatheringstatechange to completed, followed by a stop call.

There should be an onicecandidate with a candidate that has a “typ srflx” in it:

ICE candidate types

It shows your public ip. If you don’t get such a candidate but only host candidates, either the STUN server is not working (which in the case of Google’s STUN server is somewhat unlikely) or your network is blocking UDP.

Now block UDP on your network (but mind you, do not block port 53 for DNS). If you don’t know a quick way to block UDP, lets try to simulate that by changing the stun server to something that will not respond, in this case Google’s well-known DNS server running at 8.8.8.8:

Fudging STUN configuration for WebRTC

Click “gather candidates” again. After around 10 seconds you will see a gathering state change to completed in webrtc-internals. But you will not see a server-reflexive candidate:

ICE negotiation with no STUN connectivity

You can try the same thing with a TURN UDP server. Make sure your credentials are valid (again, the “public TURN server list” is not a thing). This will show both a srflx and a relay candidate.

One of the nice tricks you can do here is to change the password to something invalid. Then you will only get a srflx but no relay candidate. Which is a nice and easy way to detect if your credentials are invalid — the candidates page even suggests this.

You can repeat this with TURN/TCP and TURN/TLS servers. You can even add all kinds of TURN servers and then use the priority trick we have shown in the last blog post to figure out from which servers you gathered candidates.

If you don’t get anything but host candidates you might be on a network which blocks both UDP traffic and is successful at blocking TURN/TCP and TURN/TLS. One scenario where that might happen currently is if there is a proxy that requires authentication which is not yet supported by Chrome.

Now let us take a step back. When is this useful? In a real-world scenario you will want to run with all kinds of STUN and TURN servers, otherwise you will get high failure rates. If you need to debug a failure to establish a connection, you should look for the onicecandidate and addIceCandidate events. They will allow you to figure out if the local or remote client was on a network that blocked it from establishing a connection to any peer outside the network.

What’s next?

So this time around, we’ve focused on the API traces:

  • We’ve acquainted with the fact that this is something that webrtc-internals does us a great service just by capturing all of these WebRTC API calls
  • We even went through the typical API calls and flows that are expected to appear in the WebRTC API trace
  • We’ve looked at two examples where the WebRTC API trace can help us debug the problems we’re seeing (there are more)
    • #1 – misconfiguration of NAT traversal servers
    • #2 – network blocking and the forgotten TURN/TCP configuration

We’re not done yet with this series. We still have one or more articles in the pipeline to close the basics of what webrtc-internals got up its sleeves.

If you are interested in keeping up with us, you might want to consider subscribing.

Huge thanks for Fippo in assisting with this series!

6

How do you find the current active connection in webrtc-internals?

Today, we want to help you find the current active connection in webrtc-internals.

To make this article as accurate as possible, I decided to go to my source of truth for the low level stuff related to WebRTC – Philipp Hancke, also known as fippo or hcornflower. This in a way, is a joint article we’ve put together.

Before we do, though, make sure that you know what the parameters in chrome://webrtc-internals mean.  If you don’t, then you should start with our previous article, which explains the meaning of the parameters in webrtc-internals (and getstats).

First things first:

Why is this of any importance?

While you can always go and check the statistics on your connection and channels, there are times when what you really want to do is understand HOW you got connected.

WebRTC allows connections to take one of 3 main routes:

  1. Direct P2P
  2. By making use of STUN (to find a public IP address)
  3. By making use of TURN (to relay all of your media through it)

WebRTC connection types

Which one did you use for this connection? Did this call end up going via TURN over TCP?

There are two times when this will be useful to us:

  1. When trying to understand what occurred in this call, how the ICE negotiation took place, which candidate ended up being used, did we need to renegotiate or switch between candidates – we need to know how to find the active connection
  2. When we want to know this programmatically – especially if we are collecting these WebRTC stats and trying to ascertain the test results from it or how our network behaves in production with live users

What is an active connection in WebRTC?

WebRTC uses the ICE protocol (described in RFC 5245 if you are really keen on the details) to find a way to connect two peers which may be behind NAT routers. To establish a connection, each peer gathers a number of candidates.

There are host candidates which represent local ip addresses and ports. These have a “typ host” when you expand the onicecandidate or addIceCandidate events in webrtc-internals.

onIceCandidate

Similarly, there are serverreflexive candidates where the peer asked a STUN server for its public ip address. These will have a “typ srflx” and an additional raddr field that shows the local ip address where this originated.

Last but not least there are relay candidates. Here, the peer asked a TURN server to open a port and relay traffic. These will show up in the onicecandidate and addIceCandidate with a “typ relay”. To make things more difficult, WebRTC clients can use either UDP, TCP or TLS to connect to the TURN server.

Let’s assume that you see a number of onicecandidate and addIceCandidate calls in webrtc-internals. There are conditions where this does not happen but typically WebRTC will use a technique known as “trickle ice”.

Once candidates have been exchanged, the WebRTC engine forms pairs of local and remote candidates and starts sending STUN packets to check if it gets a response. While the details of this are very much hidden from the application we can observe what is going on in webrtc-internals (and the getStats() API).

TURN in wireshark

The screenshot above was taken from Wireshark, a tool that can be used to sniff the local network. It shows a TURN message flowing in a session during the connection setup stage.

How do we find the current active connection in webrtc-internals?

Open one of the WebRTC samples that establishes a local peer-to-peer connection, mute your speaker and start a call. Also open chrome://webrtc-internals. Now let’s see if we can find out together the active connection.

Now that we’re running the “local peer-to-peer connection” sample off the WebRTC samples repository, there’s something to remember – it does not use STUN and TURN servers, so the number of candidates exchanged will be quite small. We’ve selected it on purpose, so we won’t have so much clutter to go over. What you will see is just four candidates in the onicecandidate event of the first connection (because of some rules about rtcp-mux and BUNDLE) and a single candidate in the addIceCandidate event.

An active connection in webrtc-internals

Now which of those candidate pairs is used? Fortunately webrtc-internals gives up a hint by showing the active candidate pair in bold. Typically the id of this will be Conn-audio-1-0 (with BUNDLE, the same candidate pair and connection is used also for the video). Let’s expand this and see why it is marked as bold:

WebRTC active connection statistics

The most important thing here is the googActiveConnection attribute which is true for the currently active connection and false for all others. We see quite a number of attributes here and while some of them have been discussed in the previous post let us repeat what we see here:

  1. bytesReceived, bytesSent and packetsSent specify the number of bytes and packets sent over this connection. packetsReceived is still MIA but since it is not part of the specification that probably will not change anymore
  2. googReadable specifies whether STUN packets were received on this pair, googWritable whether responses were sent. These google properties have been replaced by the requestsReceived, responsesSent, requestsReceived and responsesSent standard counters
  3. googLocalAddress and googRemoteAddress show the local IP and port. This is quite useful if you need to correlate the information in webrtc-internals with a Wireshark dump. googLocalCandidateType and googRemoteCandidateType give you more information about whether this was a local, serverreflexive or relayed candidate
  4. localCandidateId and remoteCandidateId give you the names of the local and remote candidate statistics. These allow you to get even more details

Lets search for the local and remote candidates specified in the localCandidateId and remoteCandidateId fields. Again this is pretty easy since there is only a single candidate pair.

WebRTC connection candidates

Despite having a different type (localcandidate and remotecandidate; the specification changed this slightly to local-candidate and remote-candidate; we imagine there was a lengthy discussion about the merits of the hyphen), the information in both candidates is the same:

  • the ipAddress is where packets are sent from or sent to
  • the networkType allows you to figure out the type of the network interface
  • the portNumber gives you the port that packets are sent to or from
  • the transport specifies the transport protocol of the candidate as shown in the candidate line. Typically this will be udp unless ICE-TCP is used
  • the candidateType shows whether this is a host, srflx, prflx or relay candidate. See the specification for further details
  • the priority is the priority of the candidate as defined in RFC 5245

The most interesting field here is the priority. When the implementation following the definition of the priority from RFC 5245, the highest 8 bit specify the type preference (= you’ll need to shift the priority attribute right >> 24 bits). This is of particular interest since for local candidates with a candidateType relay we can figure out the transport used between the client and the TURN server. Chrome uses a type preference of 2 for relay candidates allocated over TURN/UDP, 1 for TURN/TCP and 0 for TURN/TLS. Calculating priorities this way means that relayed connections will have a lower priority than any non-relayed candidates and that TURN servers will only be used as a fallback. As we have described previously, using TURN/TCP (or TURN/TLS) changes the behaviour of the WebRTC quite drastically. If you find this hard to understand do not worry, the specification is currently updated to address this!

What happens during an ICE restart?

So far we have been using a very simple example. Let’s make things more complicated with one of Philipp’s favorite topics, ICE restarts. Navigate away from the previous sample and go to this sample. Make a call. You will see an active candidate pair on chrome://webrtc-internals. Click on the “Restart ICE” button. Note how the data on the candidate pair Conn-audio-1-0 has changed, the ip addresses have changed and the STUN counters have been reset. And the data we have seen previously is now (usually) on a report with the identifier Conn-audio-1-1. The candidate pair is not used any longer but will stick around in getStats (and consequently webrtc-internals).

This is somewhat unexpected (and lead to filing an issue). It seems like the underlying webrtc.org library is renaming the reports in a way such that the active candidate always has the id Conn-audio-1-0. It has behaved like this for ages but this has some disadvantages. Among other things, it is not safe to assume that the number of bytesSent will always increase as it could reset, similar to a bug resetting the bytesSent counters on the reports with a type of ssrc that we have seen in the last post.

What’s next?

What have we learned so far?

  1. The meaning of parameters in webrtc-internals and getstats
  2. Active connections in WebRTC
    1. We saw why knowing and understanding the active connection is important (mainly for debugging purposes)
    2. We then went to look at how we find an active connection (it is in bold, and it’s googActiveConnection attribute is set to true
    3. We also reviewed the interesting attributes we can find on an active connection.
    4. We then linked back the active connection to its candidate pair using the candidates id’s, and found out the candidate type from it
    5. We even learned how to find over what transport protocol a candidate is allocated on a TURN server

We’ve only just started exploring webrtc-internals, and our plan is to continue working on them to create a series of articles that will act as the knowledge base around webrtc-internals.

If you are interested in keeping up with us, you might want to consider subscribing.

Huge thanks for Fippo in assisting with this series!

18

What do the Parameters in webrtc-internals Really Mean?

To make this one as accurate as possible, I decided to go to my source of truth for the low level stuff related to WebRTC – Philipp Hancke, also known as fippo or hcornflower. This in a way, is a joint article we’ve put together.

webrtc-internals is a great tool when you need to find issues with your WebRTC product. Be it because you are trying to test WebRTC and need to debug an issue or because you’re trying to tweak with your configuration.

How to obtain a webrtc-internals stats dump?

If you aren’t familiar with this tool, then open a WebRTC session in your Chrome browser, and while in that session, open another tab and direct it to this “internal” URL: chrome://webrtc-internals/

WebRTC Internals screenshot

Do it. We will be here waiting.

webrtc-internals allows downloading the trace as a large JSON thingy that you can layer look at, but when you do, you’ll see something like this:

WebRTC internals downloaded as JSON

Visualizing webrtc-internals stats

One of the first thing people start asking is – what exactly do these numbers say? It is what one of our own testers said the moment we’ve taken the code Fippo contributed to the community that enables shoving all these values into a time series graph and filtering them out.

This gives us graphs which are much larger than the 300×140 pixels from webrtc-internals:

Sample graph of WebRTC stats

The graphs are made using the HighCharts library and offer quite a number of handy features such as hiding lines, zooming into an area of interest or hovering to find out the exact value. This makes it much easier to reason about the data than the JSON dump shown above.

Back to the basic webrtc-internals page. At the top of this page we can see a number of tabs, one for all getUserMedia calls and one tab for each RTCPeerConnection.

Tabs in webrtc-internals

On the GetUserMedia Requests tab we can see each call to getUserMedia and the constraints passed to it. We don’t get to see the results unfortunately or the ids of the MediaStreams acquired.

RTCPeerConnection stats

For each peerconnection, we can see four things here:

webrtc-internals page structure

  1. How the RTCPeerConnection was configured, i.e. what STUN and TURN servers are used and what options are set
  2. A trace of the PeerConnection API calls on the left side. These API traces show all the calls to the RTCPeerConnection object and their arguments (e.g. createOffer) as well as the callbacks and event emitters like onicecandidate.
  3. The statistics gathered from the getStats() API on the right side
  4. Graphs generated from the getStats() API at the bottom

The RTCPeerConnection API traces are a very powerful tool that allows for example reasoning about the cause of ICE failures or can give you insights where to deploy TURN servers. We will cover this at length in a future blog post.

The statistics shown on webrtc-internals are the internal format of Chrome. Which means they are a bit out of sync with the current specification, some names have changed as well as the structure. At a high level, what we see on the webrtc-internals page is similar to the result we get from calling

RTCPeerConnection.getStats(function(stats) { console.log(stats.result()); )};

This is an array of (legacy) RTCStatsReport objects which have a number of keys and values which can be accessed like this:

RTCPeerConnection.getStats(function(stats) {

   var report = stats.result()[0];

   report.names().forEach(function(name) {

       console.log(name, report.stat(name));

   });

)}

Keep in mind that there are quite a few differences between these statistics (which chrome currently exposes in getStats) and the specification. As a rule of thumb, any key name that ends with “Id” contains a pointer to a different report whose id attribute matches the value of the key. So all of these reports are connected to each other. Also note that most values are string even if they look like numbers of boolean values.

The most important attribute of the RTCStatsReport is the type of the report. There are quite a few of them:

  • googTrack
  • googLibjingleSession
  • googCertificate
  • googComponent
  • googCandidatePair
  • localCandidate
  • remoteCandidate
  • ssrc
  • VideoBWE

Lets drill down into these reports.

googTrack and googLibjingleSession reports

The googTrack and googLibjingleSession don’t contain much information so we’ll skip them.

googCertificate report

The googCertificate report contains some information about the DTLS certificate used by the local side and the peer such as the certificate itself (encoded as DER and wrapped in base64 which means you can decode it using openssls x509 command if you want to), the fingerprint and the hash algorithm. This is mostly as specified in the RTCCertificateStats dictionary.

googComponent report

The googComponent report is acting as a glue between the certificate statistics and the connection. It contains a pointer to the currently active candidate pair (described in the next section) as well as information about the ciphersuite used for DTLS and the SRTP cipher.

googCandidatePair report

A report with a type of googCandidatePair describes a pair of ICE candidates, i.e. the low-level connection. From this report you can get quite some information such as:

  • The overall number of packets and bytes sent and received (bytesSent, bytesReceived, packetsSent; packetsReceived is missing for unknown reasons). This is the raw UDP or TCP bytes including RTP headers
  • Whether this is the active connection (googActiveConnection is “true” in that case and “false” otherwise). Most of the time you will be interested only in the statistics of the active candidate pair. The spec equivalent can be found here
  • The number of STUN request and responses sent and received (requestsSent and responsesReceived; requestsReceived and responsesSent) which count the number of incoming and outgoing STUN requests that are used in the ICE process
  • The round trip time of the last STUN request, googRtt. This is different from the googRtt on the ssrc report as we will see later
  • The localCandidateId and remoteCandidateId which point to reports of type localCandidate and remoteCandidate which describe the local and remote ICE candidates. You can still see most of the information in the googLocalAddress, googLocalCandidateType etc values
  • googTransportType specifies the transport type. Note that the value of this statistics will usually be ‘udp’, even in cases where TURN over TCP is used to connect to a TURN server. This will be ‘tcp’ only when ICE-TCP is used

There are a couple of things which are easily visualized here, like the number of bytes sent and received:

Bytes graph derived from WebRTC getstats data

localCandidate and remoteCandidate reports

The localCandidate and remoteCandidate are thankfully as described in the specification, telling us the ip address, port number and type of the candidate. For TURN candidates this will soon also tell us over which transport the candidate was allocated.

Ssrc report

The ssrc report is one of the most important ones. There is one for each audio or video track sent or received over the peerconnection. It is the old version of what the specification calls MediaStreamTrackStats and RTPStreamStats. The content depends quite a bit on whether this is an audio or video track and whether it is sent or received. Let us describe some common elements first:

  • The mediaType describes whether we are looking at audio or video statistics
  • The ssrc attribute specifies the ssrc that media is sent or received on
  • googTrackId identifies the track that these statistics describe. This id can be found both in the SDP as well as the local or remote media stream tracks. Actually this is violating the rule that anything named “…Id” is a pointer to another report. Google got the goog stats wrong 😉
  • googRtt describes the round-trip time. Unlike the earlier round trip time, this is measured from RTCP
  • transportId is a pointer to the component used to transport this RTP stream. Usually (when BUNDLE) is used this will be the same for both audio and video streams
  • googCodecName specifies the codec name. For audio this will typically be opus, for video this will be either VP8, VP9 or H264. You can also see information about what implementation is used in the codecImplementationName stat
  • The number of bytesSent, bytesReceived, packetsSent and packetsReceived (depending on whether you send or receive) allow you to calculate bitrates. Those numbers are cumulative so you need to divide by the time since you last queried getStats. The sample code in the specification is quite nice but beware that Chrome sometimes resets those counters so you might end up with negative rates.
  • packetsLost gives you an indication about the number of packets lost. For the sender, this comes via RTCP, for the receiver it is measured locally. This is probably the most direct indicator you want to look at when looking at bad call quality

Voice specific

For audio tracks we have the audioInputLevel and audioOutputLevel respectively (the specification calls it audioLevel) which gives an indication whether an audio signal is coming from the microphone (unless it is muted) or played through the speakers. This could be used to detect the infamous Chrome audio bug. Also we get information about the amount of Jitter received and the jitter buffer state in googJitterReceived and googJitterBufferReceived.

Video specific

For video tracks we get two major pieces of information. The first is the number of NACK, PLI and FIR packets sent in googNacksSent, googPLIsSent and googFIRsSent (and their respective Received) variants. This gives us an idea about how packet loss is affecting video quality.

More importantly, we get information about the frame size and rate that is input (googFrameWidthInput, googFrameHeightInput, googFrameRateInput) and actually sent on the network (googFrameWidthSent, googFrameHeightSent, googFrameRateSent).
Similar data can be gathered on the receiving end in the googFrameWidthReceived, googFrameHeightReceived statistics. For the frame rate we even get it split up between the googFrameRateReceived, googFrameRateDecoded and googFrameRateOutput.

On the encoder side we can observe difference between these values and get even more information about why the picture is scaled down. Typically this happens either because there is not enough CPU or bandwidth to transmit the full picture. In addition to lowering the frame rate (which could be observed by comparing differences between googFrameRateInput and googFrameRateSent) we get extra information about whether the resolution is adapted because of CPU issues (then googCpuLimitedResolution is true then — mind you that it is the string true, not a boolean value in Chrome’s current implementation) and if it is because the bandwidth is insufficient then googBandwidthLimitedResolution will be true. Whenever one of those conditions changes, the googAdaptionChanges counter increases.

We can see such a change in this diagram:

Checking WebRTC video width in getstats

Here, packet loss is artificially generated. In response, Chrome tries to reduce the resolution first at t=184 where the green line showing the googFrameWidthSent starts to differ from the googFrameWidthInput shown in black. Next at t=186 frames are dropped and the input frame rate of 30fps (shown in light blue) is different from the frame rate sent (blue line) which is close to 0.

In addition to these standard statistics, Chrome exposes a large number of statistics about the behaviour of the audio and video stack on the ssrc report. We will discuss them in a future post.

VideoBWE report

Last but not least the VideoBWE report. As the name suggests, it contains information about the bandwidth estimate that the peerconnection has. But there is quite a bit more useful information contained in this report:

  • googAvailableReceiveBandwidth – the bandwidth that is available for receiving video data
  • googAvailableSendBandwidth – the bandwidth that is available for sending video data
  • googTargetEncBitrate – the target bitrate of the the video encoder. This tries to fill out the available bandwidth
  • googActualEncBitrate – the bitrate coming out of the video encoder. This should usually match the target bitrate
  • googTransmitBitrate – the bitrate actually transmitted. If this is very different from the actual encoder bitrate, this might be due to forward error correction
  • googRetransmitBitrate – this allows measuring the bitrate of retransmits if RTX is used. This is usually an indication of packet loss.
  • googBucketDelay – is a measure for Google’s “leaky bucket” strategy for dealing with large frames. Should be very small usually

As you can see this report gives you quite a wealth of information about one of the most important aspects of the video quality – the available bandwidth. Checking the available send and receive bandwidth is often the first step before diving deeper into the ssrc reports. Because sometimes you might find behaviour like this which explains ‘bad quality’ complaints from users:

Bandwidth estimation graph for WebRTC

In this case “the bandwidth estimate dropped all the time” is a pretty good explanation for quality issues.

What’s next?

That’s a small part of what you can glean out of webrtc-internals. There’s more to it, which means Fippo and I will be churning out more posts in this serie of articles about webrtc-internals. If you are interested in keeping up with us, you might want to consider subscribing.

Huge thanks for Fippo in assisting with this one!

8 How to create a .Y4M video file that Chrome can use?

If you’ve ever tried to replace the camera feed for Chrome with a media file for the purpose of testing WebRTC, you might have noticed that it isn’t the most easy process of all.

Even if you got to the point of having a .Y4M file (the format used by Chrome) and finding which command line flags to run Chrome with – there is no guarantee for this to work.

Why? Chrome likes its .Y4M file in a very very specific way. One which FFmpeg fails to support.

We’ve recently refreshed the media files we use ourselves in testRTC – making them a bit more relevant in terms of content type and containing media that can hold high bitrates nicely. Since we have our own scars from this process, we wanted to share it here with you – to save you time.

Why is it so damn hard?

When you use FFmpeg to create a .Y4M file, it generates it correctly. If you try to open the .Y4M file with a VLC player, for example, it renders well. But if you try to give it to Chrome – Chrome will crash from this .Y4M file.

The reason stems in Chrome’s expectations. The header of the .Y4M file includes some metadata. Part of it is the file type. What FFmpeg has is C420mpeg2 to describe the color space used (or something of the sorts), but Chrome expects to see only C420.

Yes. 5 characters making all the trouble.

The only place we found that details it is here, but it still leaves you with a lot to do to get it done.


Here’s what you need to do:

Prerequisites:

  • The media file
    • We’ve used .mp4 but .webm is just as good
    • Make sure the origin resolution and frame rate is what you need – for the camera source – Chrome will scale down if and when needed
    • The source file should be of high quality – again, assume it comes out directly from a camera
  • Linux
    • You can make do with Windows or Mac – I’ve used Linux for this though
    • I find it easier to handle for command line tasks (and I am definitely not a Mac person)
  • FFmpeg installed somewhere (get it from here, but hopefully you have it install already)
  • sed command line program

Steps:

  1. Convert the file from .mp4 to .y4m format
  2. Remove the 5 redundant characters

Here’s how to do it from the command line. for all of the .y4m files in your current folder:

ffmpeg -i YOUR-FILE-HERE.mp4 -pix_fmt yuv420p
sed -i '0,/C420mpeg2/s//C420/' *.y4m

Running Chrome:

To run Chrome with your newly created file, you’ll need to invoke it from command line with a few flags:

google-chrome --use-fake-device-for-media-stream --use-file-for-fake-video-capture=YOUR-FILE-HERE.y4m

Things to remember:

  • The resulting .Y4M file is humongous. 10 seconds of 1080p resolution eats up a full gigabyte of disk space
  • That sed command? It isn’t optimized for speed but it gets the job done, so who cares? It’s a one-time effort anyways