
Earlier this week we’ve started rolling out our new version of testRTC to our customers. This was one of these releases that we’ve worked on for a long time, starting two or three releases back when a decision was made that enough technical debt has been accumulating and a refresh was needed. It started as a nicely sized Angular to React rewrite and “redesign” which ended up being a lot more than that.
The results? Something that I am really proud of.
The switch to React included a switch to Highcharts as well, so we can offer better graphs moving forward. This isn’t why I wanted to write about this release though.
If you’ve been using testRTC already, you will be quite comfortable with this new release. It will feel like an improvement, while keeping everything you wanted and were used to using in the same place.
There are four things we’ve added that you should really care about:
#1 – Assets
This is something we are asked for quite some time now. We have clients who are running multiple tests and multiple monitors.
In some cases, the different scripts have only slight variations in them. In others, they share common generic tasks, such as login procedures.
The problem was that we were allowing customers to create a single file script only, and run it as a fully contained “program”. This kept our solution simple and elegant, but not flexible enough for growth.
This is why we are introducing Assets into the mix.
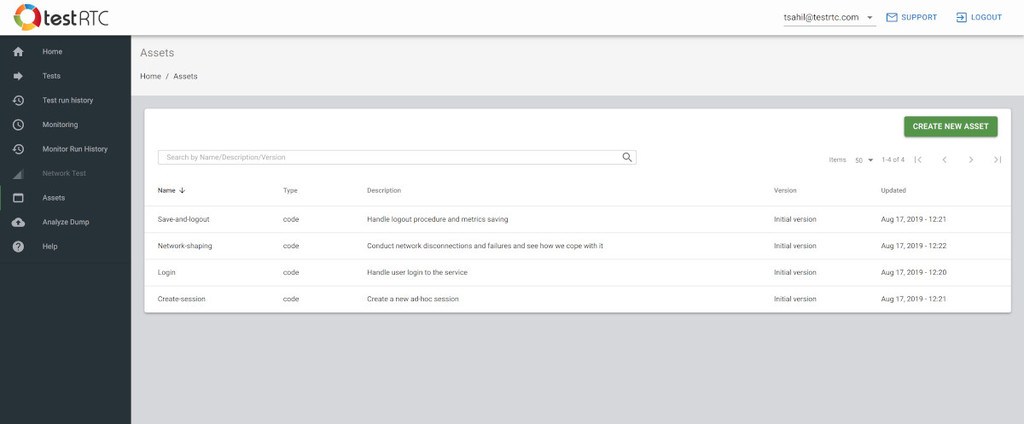
You can now create asset files which are simple scripts. Once created, you can include them into any of your running test scripts. You do that by simply adding an .include(‘<asset-name>’) command into your test script.
#2 – Advanced WebRTC Analytics
We’ve kinda revamped the whole Advanced WebRTC Analytics screen.
Up until now, it was a braindump of all getstats statistics without much thought. It gave power to the people, but it took its toll.
This time around, we’ve sat down to decide what information we have available, looked at what others are doing, and ended up with our own interpretation of what’s needed:
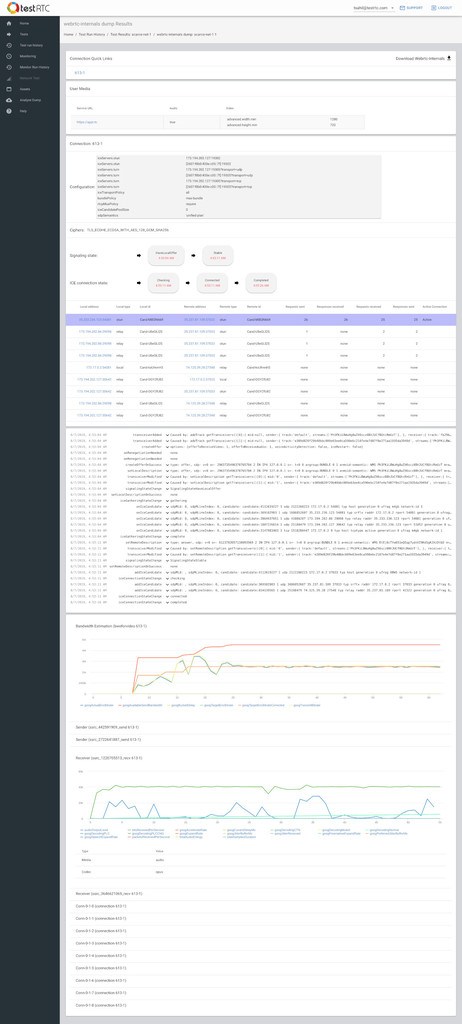
The Advanced WebRTC Analytics section now includes the following capabilities:
- Splits information into peer connection for easy view
- Shows getUserMedia constraints
- Show the PeerConnection configuration, so it is now super easy to see what STUN and TURN servers were configured
- Show cipher information for the security conscious
- Show ICE state machine progress, correlating it with the events log
- Show ICE negotiation table, to pinpoint on failure reasons (and understand what candidate pair got selected)
- Show WebRTC API events log, with the detailed calls and callbacks
- Show the actual graphs, just nicer, with Highcharts
I’ve been using these new capabilities just last week to explain to a new lead why his calls don’t connect with our probe’s firewall configuration.
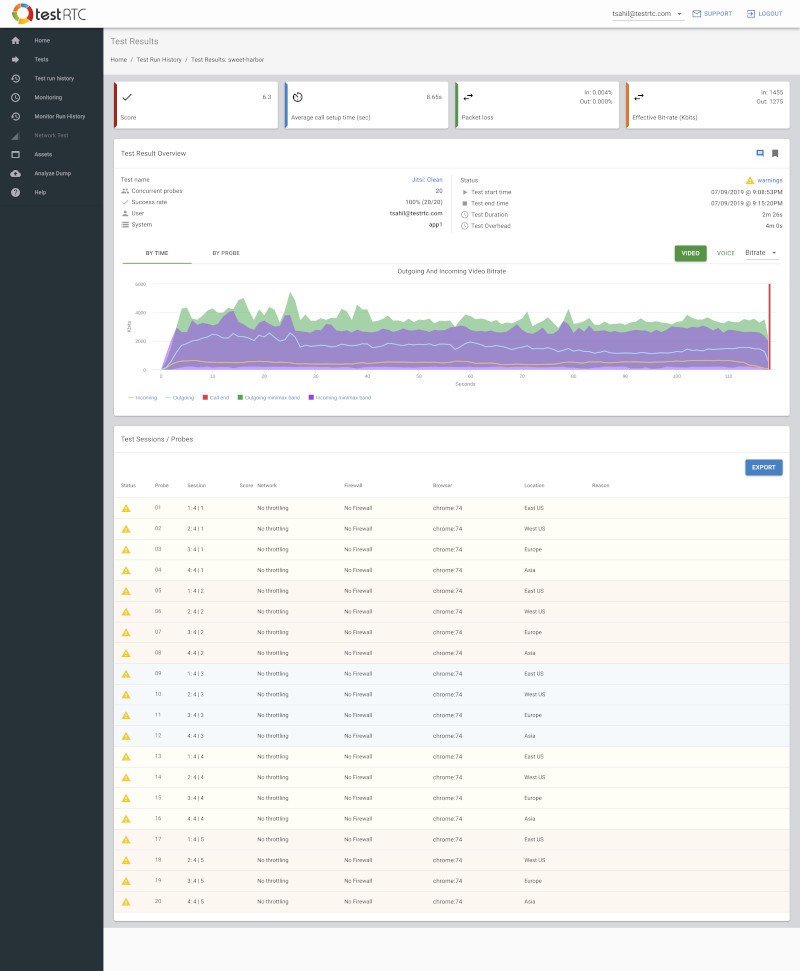
#3 – Media scores everywhere
We’ve added media scores to our test results in the last release, but we placed them only on the test results page itself.
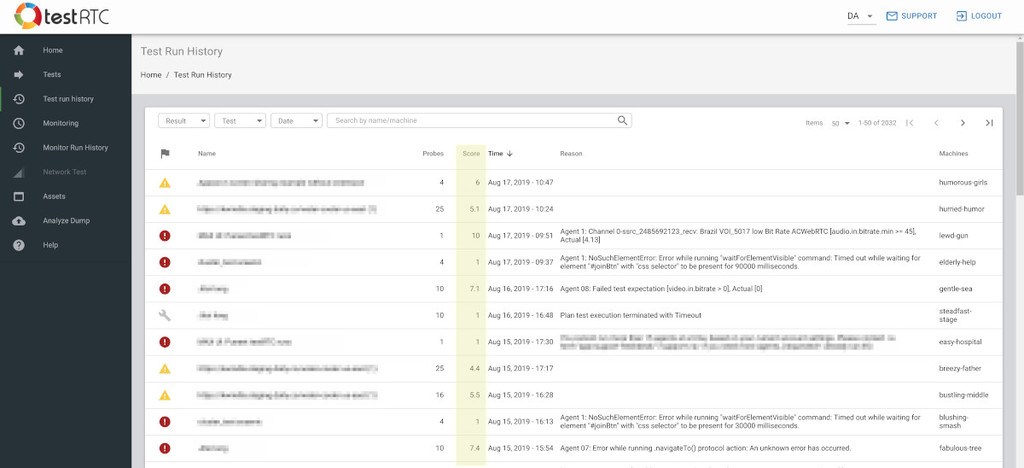
Now we’re taking the next step, putting the scores in monitor lists and test run lists. This means they are more accessible to you and can be seen everywhere.
What can you do with them?
- Quickly understand if your service degrades when you scale
- Run the smallest test possible. See the media score you get
- Start scaling the test up. Expect the media score to not drop. If it does, check why
- Make sure monitors are stable
- Run a monitor
- Check if the media score changes over it
- If it changes too much, you have an infrastructure problem
#4 – Client performance data
Another thing we’ve had for quite some time, but now decided to move front and center
There’s now a new tab in the test results of a single probe called “Performance”:
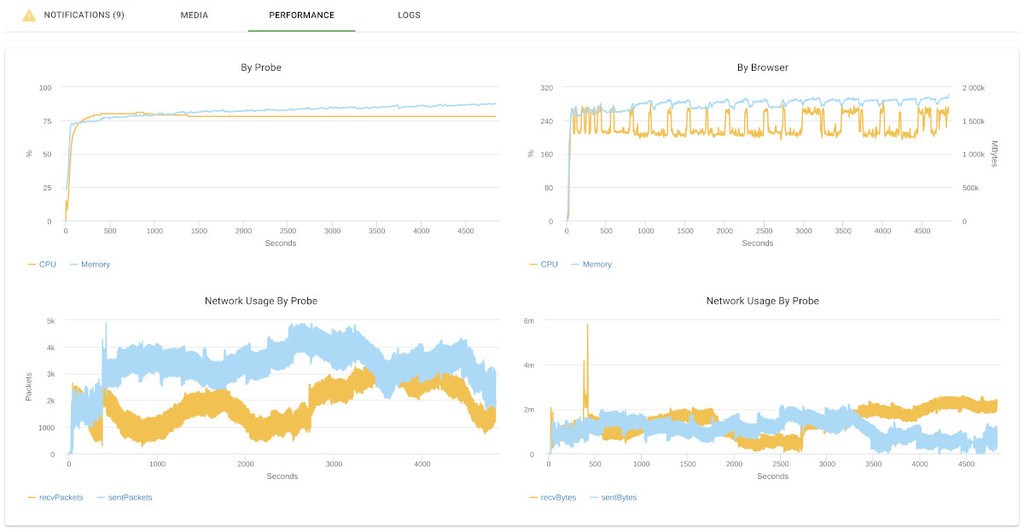
When opened, if you have the #perf directive in your run options, it will show you the probe’s machine performance – the CPU, memory and network use of the probe and browser.
This will give you some understanding of what user machines are going to be “feeling”, especially if you are aiming for a UI-heavy implementation.
We see customers using this for performance and stress testing.
Other
Other improvements that made it into this release?
- Filtering webhooks to run only on failed test runs
- Automating dynamic allocation of probes when no static ones are available
- Export test run history
- Ability to execute and collect traceroute on DNS lookups in the browser
- Added support to run longer tests
- Modified fields in most tables to make them more effective to users