Tag Archives for " test analysis "

We already have users. Why should we monitor WebRTC?

That’s actually a great question. We get this every once in awhile, so I wanted to touch it here.

Our WebRTC monitor? It is like pingdom, just more complex and end-to-end – we make sure that if a user tries to access your system he will end up getting media and not just a web page. And that distinction is important. Pingdom only states if a given IP address is responsive or that a URL returns a response. We go the extra mile of connecting a media session.

Back to the original question:

We already have users. Why should we monitor WebRTC?

That’s how the question goes. The service is up and running. People are using the service. We’ve even connected the servers we run to Nagios. Or New Relic. Or someone else. You know what? We even collect the WebRTC statistics on our live production system and closely monitor how real users perceive our service. Why do we need another monitor?

For the same reason you have Nagios and New Relic in there in the first place. If you have customers and they are happy and you check their stats – why invest in monitoring the servers directly?


Here are 4 reasons I heard directly from our customers:

#1 – We want to know before our customers complain

While the best predictor of a customer issue is a customer complaining, I am not sure this is the best approach.

Many vendors prefer knowing about a problem before their customers do. This gives them time to try and solve the issue – or at least give them the ability to tell the customer that they know about it and are trying to resolve it already.

A good example here is the launch of a new browser version. These upgrades tend to break things or change behavior in one way or another. You can put a monitor in front of the latest stable Chrome version – or better yet – the beta version. That way, you can catch more issues in advance and be prepared for them.

I’d say this is the main reason why customers subscribe to our WebRTC monitoring service. They may take different routes in what exactly it is that they monitor (locations, different deployments, different frequencies, different user profiles), but they all want to monitor their service.

#2 – Everything was up and running, but calls didn’t connect

We recently had a company approach us due to downtime that their service experienced. What they said was that the application monitoring that they had in place indicated service running perfectly well, but the service was effectively down for their customers.

You see, knowing that your server’s CPU is below 80% and memory looks fine doesn’t really indicate that if someone tries to communicate he will succeed. This type of monitoring is necessary but not sufficient.

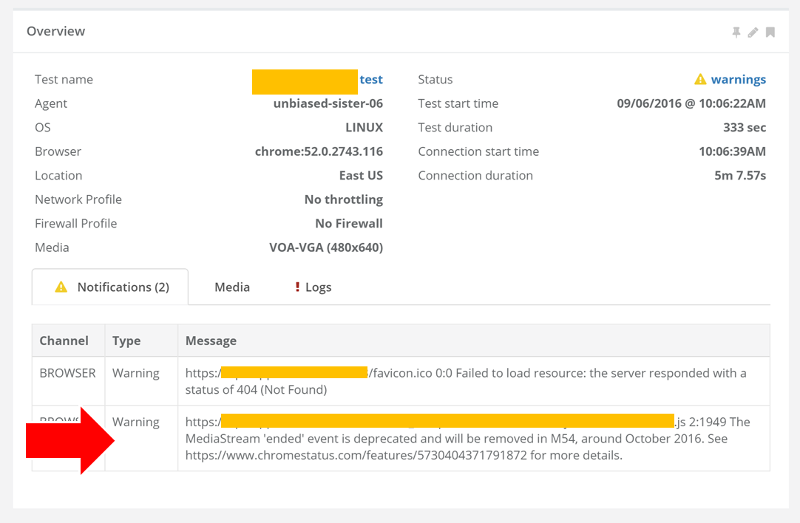
By using testRTC monitor, you can rest assured that your service is up and running. Why? Because we access your service from a real browser just like a user would, and we go through all the hoops of your service to get to that media. And once we do? We can validate that the media also meets your criteria – like specific bitrates or packetloss target thresholds.

#3 – Uptime and network quality isn’t the same thing

If what you do is collect network statistics on calls getting connected by looking at WebRTC stats then think again. It might be necessary and important, but not enough either.

The assumption of such an activity that the service is up and running, and the only thing missing is knowing the network quality by reviewing the quality experienced by users. But is that a good predictor of the next failure? If you only monitor successful calls in the system, then how would you know that calls are failing because they can’t even begin to connect?

With the testRTC monitor this is something that is checked each and every time. Making sure that users can get connected. Sure. We’ll check the quality and your criteria of it. But first and foremost, we’ll make sure that session that needs to connect – get connected.

#4 – How do you baseline a service performance?

When you try and use the statistics collected from your live audience, it tells you how well this audience is experiencing your service, but does it tell you if/how can you improve it?

One of the toughest things to do with WebRTC is to spec out the server. You’ve built a service to scale. You’ve put in place scale out mechanisms on one of the biggest cloud providers. You know for certain that whenever you’ll need more capacity, your system will automagically grown and do so economically. Or will it?

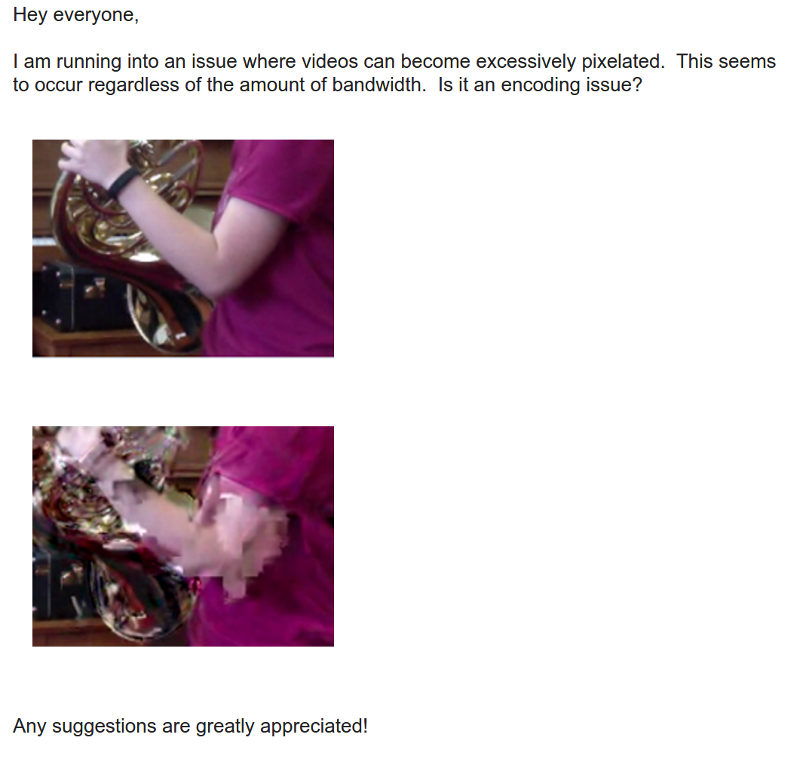
Can you see from real users what will be the experience of the next user to join? Is he experiencing packet losses because of his own network (running from a smartphone in a basement connected over 2G) or is it because your server has a bad network connection of its own towards the internet and it is leaking packets?

Part of what our WebRTC monitor does is add predictability into the process. Whenever the monitor is scheduled to run, it will run as flawlessly as it did last time, over the same type of connection and network conditions you’ve asked it to. So if you see packet losses – you know it has to be something on your end.

This enables the creation of a baseline of your service performance, and put hard criteria in place against that baseline, so whenever a testRTC WebRTC probe will poke at your service and come back unsatisfied – you will know about it, and you will be able to take actionable measures to solve it.

How do you monitor WebRTC?

WebRTC is still rather new and nascent, so there’s little in the way of best practices and experience that got collected around it.

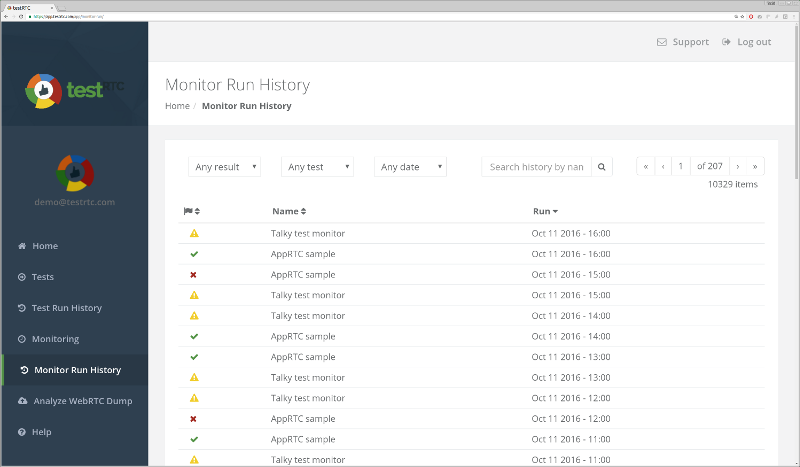
Here’s a screenshot I took just now from our demo account, where we run a few sample monitors in front of AppRTC and Talky (for no good reason other than the fact that we can):

WebRTC monitor sample screenshot

I am really interested in understanding how you monitor your service. What is it that you do to make sure it is up and running for your customers.

6

Executing a WebRTC test that scales

There’s a growing trend from the companies that come to testRTC in recent months, and it has to do with the focus of what they are looking for.

Most are less interested in how testRTC can be used for functional testing – things like coverage of scenarios and finding edge cases and automating tests for them. What people are interested now when they want to run a WebRTC test scenario is how to scale it.

Customers typically try to take stress in WebRTC tests in two slightly different vectors: they either focus on testing how their WebRTC service can handle multiple sessions in parallel or they focus on testing how their WebRTC service can increase the number of users in a single session.

Let’s review what’s the meaning of each of these alternatives.

#1 – WebRTC test that scales to a large number of sessions

I decided to put things on a simple graph. The X axis denotes the number of sessions we’re going to focus on while the Y axis is all about the number of users in a single session.

In this case, where we want to test WebRTC for a large number of sessions, we will have this focus:

Scale a WebRTC test by the number of sessions

So we have a WebRTC service to test. It has a single user in a session (a contact center agent receiving calls from PSTN for example) or two users in a session (one person talking to another across browsers).

In such a case, vendors are usually concerned about stressing their servers – checking if they can fit their intended capacity.

When this is done, there are three different things that can be tested for scale:

  1. The signaling server
    • How well does it behave while increasing capacity? How is its connection to the databse? Does it slow down as connections accumulate? Does it leak memory?
    • Usually, stress testing a signaling server is better done with other tools. Ones that have a lower cost per connection than testRTC and don’t really require a full browser per connection
    • That said, oftentimes, you may as well want to throw in a few “real” users using testRTC on top of a tool that loads your signaling connections separately – just to make sure there’s nothing that kills your service when media is added into the mix on top of the signaling
    • You also need to think about the third component below – how do you test your TURN server?
  2. The media server
    • These crop into 1:1 tests when there’s a need to record the session or to enforce a given route. I’ve seen many of these recently, mainly in the healthcare and education markets
    • For single users, this usually means the gateway that connects the user to other networks is what we want to test, and there it will usually include a media server of sorts for media transcoding
    • In such a case, there’s no getting away from the fact that scale is in the low 10’s or 100’s of browsers and real ones are needed. It is also where we see a lot of interest in testRTC and its capabilities
  3. The TURN server
    • Anywhere between 5-20% of the calls will end up being relayed via a TURN server – and there’s nothing you can do about it
    • If you put up your own TURN servers – how confident are you in your setup and its ability to scale nicely as your service grows?
    • One way to find out is to place real browsers in front of your service, but doing so in a way that forces the browsers to negotiate via TURN. This can be acheived by changing the configuration of your client, filtering ICE candidates and doing SDP munging. A better way would be to enforce network rules on the machine running the browser and actually test your service in different network conditions
    • And yes. testRTC allows you to do just that

#2 – WebRTC test that accommodates a large group of users in a single session

The other type of focus use cases we see a lot from our customers are those that want to answer the question “how many users can I cram into a single session without considerably degrading the quality?”

Scale a WebRTC test by the number of users per sesson

Many look for doing such tests at around 10-20 concurrent browsers, either in MCU or SFU models (see this post on the differences between the multiparty WebRTC technologies).

What happens next is usually a single session where browsers are added one on top of the other to check for scale. Here, the main purpose of a test is validating the media server and not much else.

The scenario is rather simple:

  • Try 1:1. Record the results
  • Go for 4 users. Record the results
  • Expand to 10 users. Record the results
  • Rinse and repeat

Now go back to the recorded results and see if the media got degraded:

  • Was latency introduced?
  • Do we see more packet losses?
  • Does bitrates go down the more browsers we add?
  • Is the bitrate stable or fluctuating all over the chart?
  • Is the degradation linear or exponential?

These types of questions are indicators to problems in the WebRTC product’s infrastructure (be it network connections, CPU, storage or software).

#3 – Test WebRTC at scale

And then you can try to accommodate for both these needs. And you should – scale the size of the sessions at the same time that you scale the number of sessions.

Scale a WebRTC test by the number of sessions and by the number of users in them

Here what we’re trying to do is everything at the same time.

We want to be able to place multiple users in the same session but spread our browsers across sessions.

How about running 100 browsers, split across 10 different sessions, where each session accommodates for 10 browsers? This is where our customers are headed next after they tested their WebRTC multiparty service for a single session capacity.

Why is WebRTC test scaling so hard?

When you scale test WebRTC infrastructure, you end up needing lots of bandwidth and processing power. Remember that each user is a full browser (why that is necessary see here). Running 2 or 4 of these may be simple, but running 20 or more becomes quite a challenge:

  • You can no longer place them all in a single machine, so you need to start distributing them – across machines, across data centers
  • You need to take care of both downlink and uplink network speeds – this isn’t easy to acheive at scale
  • You need to synchronize across your small army of browsers so they hit the server at roughly the right time for it all to work
  • Oh – and you need the WebRTC test environment to be stable, so that when issues occur, it will more often than not be due to an issue in the tested product and not in your test environment itself

testRTC, users and sessions

There are many ways to do multiple users in a single session:

  • All join the same URL or room, given the same level of access
  • A chair hosting a large conference, where control and access is assymetric
  • A broadcaster and a large number of viewers
  • A few people in a discussion with a large number of viewers

Each of these scales differently and requires a slightly different treatment.

What we did at testRTC was introduce the notion of #session into the mix. When you indicate #session, the test will automatically wrap itself around that notion – splitting the number of concurrent users you want into sessions at the size you state by #session.

Want to see it in action? Check our our latest tutorial videos on how to scale WebRTC tests in testRTC, by using the notion of a session:

10

What happens when WebRTC shifts to TURN over TCP

You wouldn’t believe how TURN over TCP changes the behavior of WebRTC on the network.

I’ve written this on BlogGeek.me about the importance of using TURN and not relying on public IP addresses. What I didn’t cover in that article was how TURN over TCP changes the behavior we end up seeing on the network.

This is why I took the time to sit down with AppRTC (my usual go-to service for such examples), used a 1080p resolution camera input, configure my network around it using testRTC and check what happens in the final reports we get.

What I want to share here are 4 different network conditions:

Checking how TURN over TCP affects the network flow

#1 – A P2P Call with No Packet Loss

Let’s first figure out the baseline for this comparison. This is going to be AppRTC, 1:1 call, with no network impairments and no use of TURN whatsoever.

Oh – and I forced the use of VP8 on all calls while at it. We will focus on the video stats, because there’s a lot more data in them.

P2P; No packet loss; charts

Our outgoing bitrate is around 2.5Mbps while the incoming one is around 2.3Mbps – it has to do with the timing of how we calculate things in testRTC. With longer calls, it would average at 2.5Mbps in both directions.

Here’s how the video graphs look like:

P2P; No packet loss; graphs

They are here for reference. Once we will analyze the other scenarios, we will refer back to this one.

What we will be interested in will mainly be bitrate, packet loss and delay graphs.

#2 – TURN over TCP call with No Packet Loss

At first glance, I was rather put down by the results I’ve seen on this one – until I dug into it a bit deeper. I forced TCP relay by blocking all UDP traffic in our machines.

TURN over TCP; No packet loss; charts

This time, we have slightly lower bitrates – in the vicinity of 2.4Mbps outgoing and 2.2Mbps incoming.

This can be related to the additional TURN leg, its network and configuration – or to the overhead introduced by using TCP for the media instead of UDP.

The average Round trip and Jitter vaues are slightly higher than those we had without the need for TURN over UDP – a price we’re paying for relaying the media (and using TCP).

The graphs show something interesting, but nothing to “write home about”:

TURN over TCP; No packet loss; graphs

Lets look at the video bitrate first:

TURN over TCP; No packet loss; video bitrate

Look at the yellow part. Notice how the outgoing video bitrate ramps up a lot faster than the incoming video bitrate? Two reasons why this might be happening:

  1. WebRTC sends out data fast, but that same data gets clogged by the network driver – TCP waits before it sends it out, trying to be a good citizen. When UDP is used, WebRTC is a lot more agressive (and accurate) about estimating the available bitrate. So on the outgoing, WebRTC estimates that there’s enough bitrate to use, but then on the incoming, TCP slows everything down, ramping up to 2.4Mbps in 30 seconds instead of less than 5 that we’re used to by WebRTC
  2. The TURN server receives that data, but then somehow decides to send it out in a slower fashion for some unknown reason

I am leaning towards the first reason, but would love to understand the real reason if you know it.

The second interesting thing is the area in the green. That interesting “hump” we have for the video, where we have a jump of almost a full 1Mbps that goes back down later? That hump also coincides with packet loss reporting at the beginning of it – something that is weird as well – remember that TCP doesn’t lose packets – it re-transmits them.

This is most probably due to the fact that after bitstream got stabilized on the outgoing side, there’s the extra data we tried pushing into the channel that needs to pass through before we can continue. And if you have to ask – I tried a longer 5 minutes session. That hump didn’t appear again.

Last, but not least, we have the average delay graph. It peaks at 100ms and drops down to around 45ms.

To sum things up:

TURN over TCP causes WebRTC sessions to stabilize later on the available bitrate.

Until now, we’ve seen calls on clean traffic. What happens when we add some spice into the mix?

#3 – A P2P Call with 0.5% packet loss

What we’ll be doing in the next two sessions is simulate DSL connections, adding 0.5% packet loss. First, we go back to our P2P call – we’re not going to force TURN in any way.

P2P; 0.5% packet loss; charts

Our bitrate skyrocketed. We’re now at over 3Mbps for the same type of content because of 0.5% packet loss. WebRTC saw the opportunity to pump more bits to deal with the network and so it did. And since we didn’t really limit it in this test – it took the right approach.

I double checked the screenshots of our media – they seemed just fine:

P2P; 0.5% packet loss; screenshot

Lets dig a bit deeper into the video charts:

P2P; 0.5% packet loss; graphs

There’s packet loss alright, along with higher bitrates and slightly higher delay.

Remember these results for our final test scenario.

#4 – TURN over TCP Call with 0.5% packet loss

We now use the same configuration, but force TURN over TCP over the browsers.

Here’s what we got:

TURN over TCP; 0.5% packet loss; charts

Bitrates are lower than 2Mbps, whereas on without forcing TURN they were at around 3Mbps.

Ugliness ensues when we glance at the video charts…

TURN over TCP; 0.5% packet loss; graphs
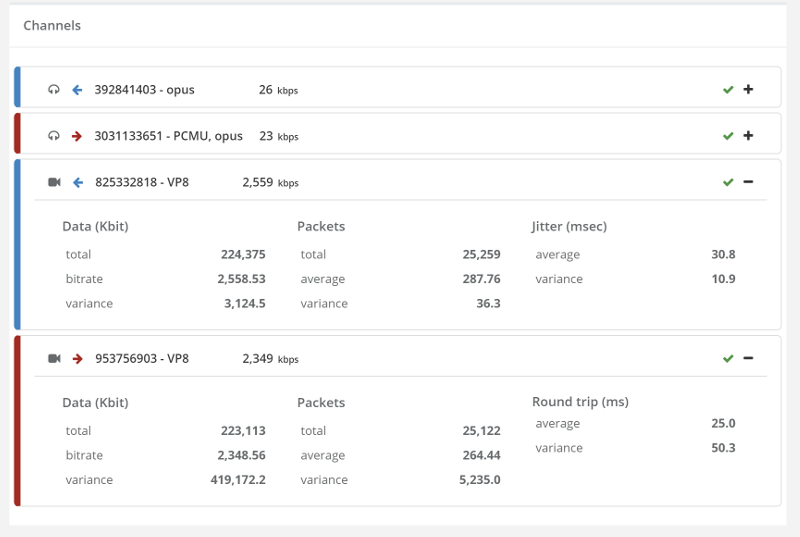
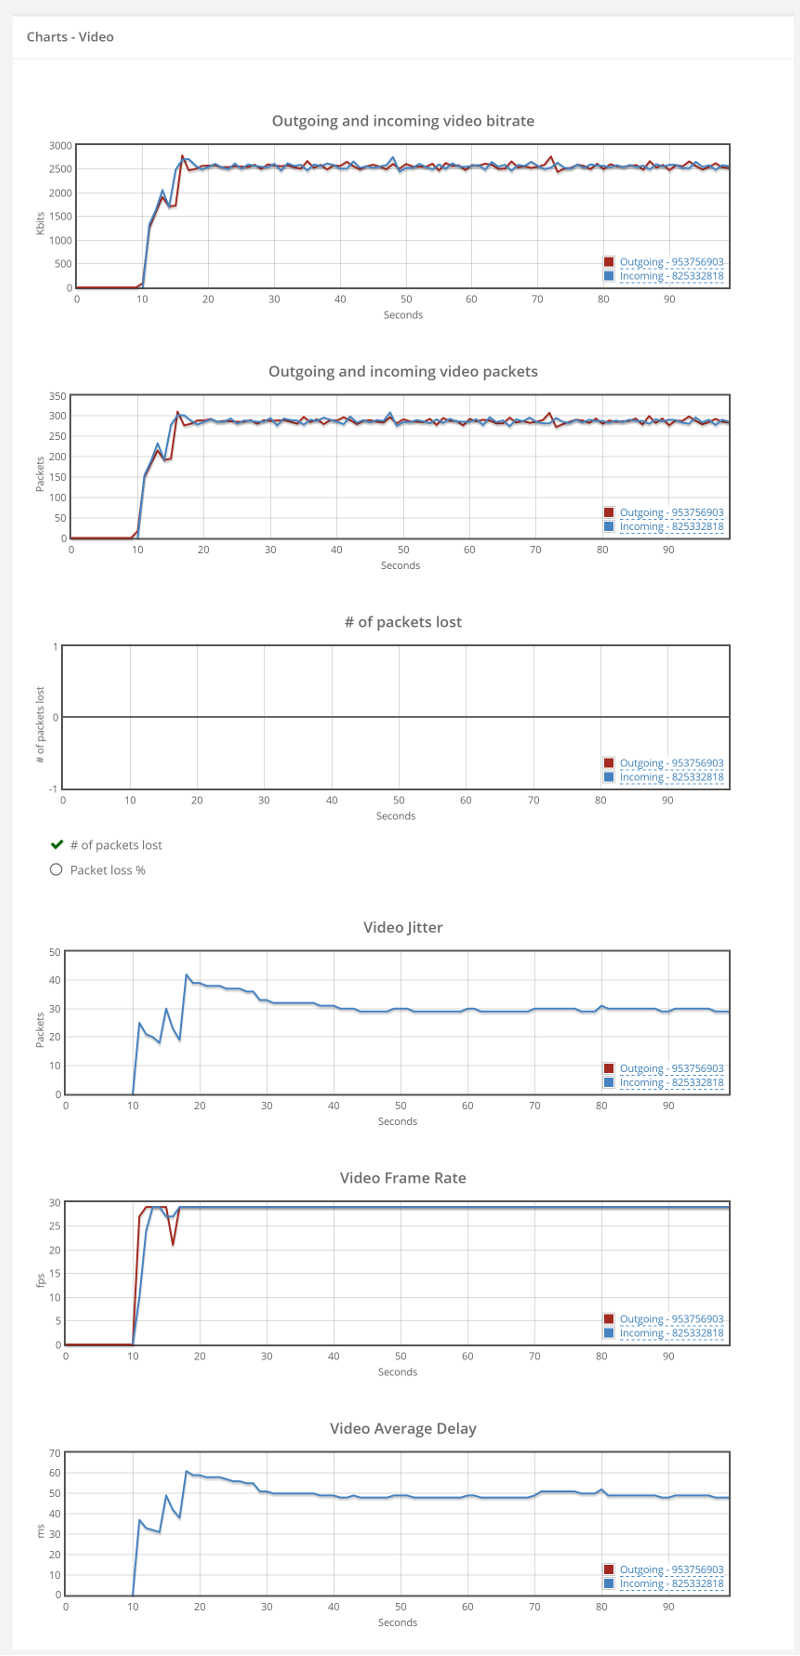
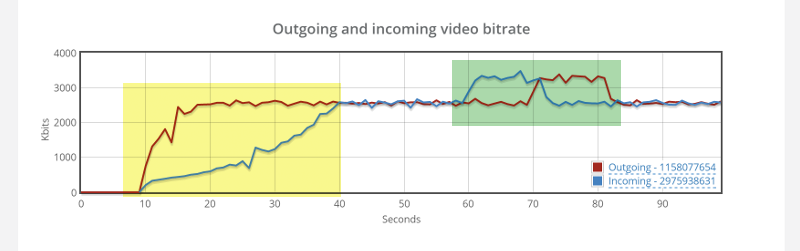
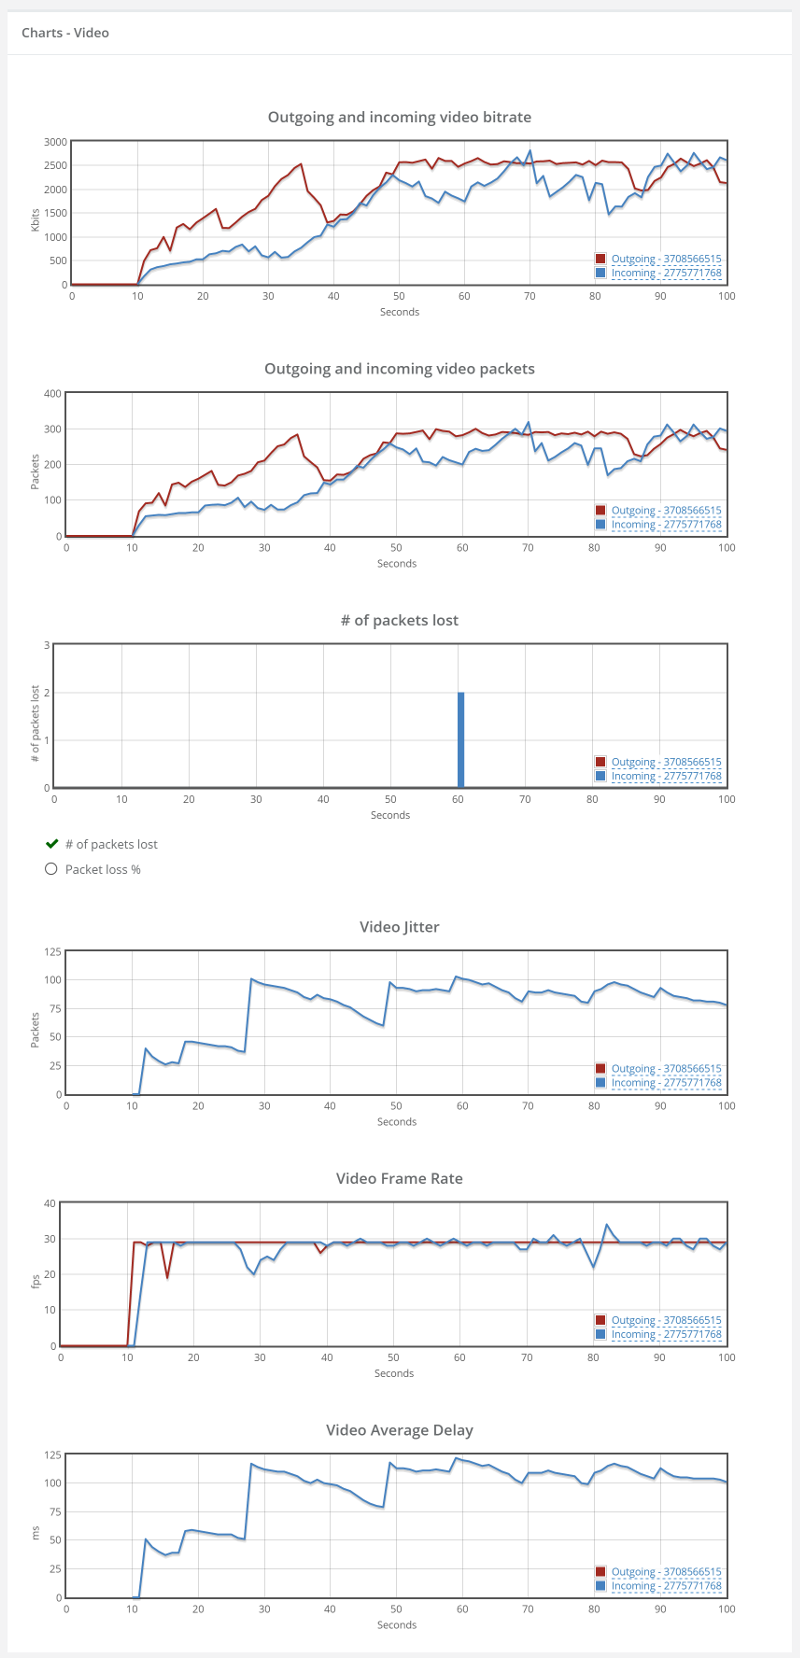
Things don’t really stabilize… at least not in a 90 seconds period of a session.

I guess it is mainly due to the nature of TCP and how it handles packet losses. Which brings me to the other thing – the packet loss chart seems especially “clean”. There are almost no packet losses. That’s because TCP hides that and re-transmit everything so as not to lose packets. It also means that we have utilization of bitrate that is way higher than the 1.9Mbps – it is just not available for WebRTC – and in most cases, these re-tramsnissions don’t really help WebRTC at all as they come too late to play them back anyway.

What did we see?

I’ll try to sum it in two sentences:

  1. TCP for WebRTC is a necessary evil
  2. You want to use it as little as possible

And if you are interested about the most likely ICE candidate to connect, then checkout Fippo’s latest data nerding post.

Are you following the WebRTC deprecation path?

I just had to share this one. You know how people complain about WebRTC breaking their services, and it being unstable?

It is partially true. What these people don’t tell you, is that oftentimes they just ignore all the warnings signs that are out there. In many of the cases, the service breaks simply because it wasn’t updated in time – and time was ample for it to be updated.

This “WebRTC deprecation” of feature and capabilities, as well as other browser features is a good thing – it is a way for the browser to get rid of excess junk (and vulnerabilities).

This week I worked with one of our customers, and bumped into this warning message that I just had to share:

WebRTC deprecation warning on Chrome

What you see above is a screenshot of the types of reports we put out.

One of the things we decided early on was to collect the browser console logs and analyze them. If there’s anything suspicious there – we just bubble it up for our users.

One of the classic warnings for services that are in their staging phase is that they have no favicon for their website, which you can see in the first warning. The thing that was new to me was the second warning in there:

The MediaStream ‘ended’ event is deprecated and will be removed in M54, around October 2016.

You know what? Knowing that enables the tester to file a bug, and the developer to complain (and curse the tester) and then fix this issue. Hopefully before deprecation kicks in

The interesting thing is that whenever a new release of Chrome comes out, the number of deprecation warnings rise in all services we test, and after awhile, these things get fixed and cleaned.

So what’s the takeaway?

  1. When you build your releases calendar and the patches, make sure to take into account the time needed to fix deprecation issues related to WebRTC – since it isn’t yet a standardized RFC, expect browsers to modify their APIs between versions
  2. Make sure to look at your browser’s console logs and clean them up. And while at it, why not automate this part as well and just use testRTC for the purpose?

WebRTC: To Mechanical Turk or NOT to Mechanical Turk

I’ve seen this a few times already. People look at an automated process – only to replace it with a human one. For some reason, there’s a belief that humans are better. And grinding the same thing over and over and over and over and over again.

They’re not. And there’s a place for both humans and machines in WebRTC product testing.

WebRTC, Mechanical Turk and the lack of consistency

The Amazon Mechanical Turk is a great example. You can easily take a task, split it between many people, and have them do it for you. Say you have a list of a million songs and you wish to categorize them by genre. You can get 10,000 people in Amazon Mechanical Turk to do 100 lines each from that list and you’re done. Heck, you can have each to 300 lines and for each line (now with 3 scores), take the most common Genre defined by the people who classified it.

Which brings us to the problem. Humans are finicky creatures. Two people don’t have the same worldview, and will give different Genre indication to the same song. Even worse, the same person will give a different Genre to the same song if enough time passes (enough time can be a couple of minutes). Which is why we decided to show 3 people the same song to begin with – so we get some conformity in the decision we end up with on the Genre.

Which brings us to testing WebRTC products. And how should we approach it.

Here’s a quick example I gleaned from the great discuss-webrtc mailing list:

discuss-webrtc bug report

There’s nothing wrong with this question. It is a valid one, but I am not sure there’s enough information to work off this one:

  • What “regardless of the amount of bandwidth” is exactly?
  • Was this sent over the network or only done locally?
  • What resolution and frame rate are we talking about?
  • Might there be some packet loss causing it?
  • How easy is it to reproduce?

I used to manage the development of VoIP products. One thing we were always challenged by is the amount of information provided by the testing team in their bug reports. Sometimes, there wasn’t enough information to understand what was done. Other times, we had so many unnecessary logs that you either didn’t find what was needed or felt for the poor tester who spent so much time collecting this stuff together for you with no real need.

The Tester/Developer grind cycle

Then there’s that grind:

Test-Dev grind cycle

We’ve all been there. A tester finds what he believes is a bug. He files it in the bug tracking system. The developer can’t reproduce the bug, or needs more information, so the cycle starts. Once the developer fixes something, the tester needs to check that fix. And then another cycle starts.

The problem with these cycles is that the tester who runs the scenario (and the developer who does the same) are humans. Which makes it hard for repeated runs of the same scenario to end up the same.

When it comes to WebRTC, this is doubly so. There are just too many aspects that are going to affect how the test scenario will be affected:

  • The human tester
  • The machine used during the test
  • Other processes running on said machine
  • Other browser tabs being used
  • How the network behaves during the test

It is not that you don’t want to test in these conditions – it is that you want to be able to repeat them to be able to fix them.

My suggestion? Mix and match

Take a few cases that goes through the fundamental flows of your service. Automate that part of your testing. Don’t use some WebRTC Mechanical Turk in places where it brings you more grief than value.

Augment it with human testers. Ones that will be in charge of giving the final verdict on the automated tests AND run around with their own scenarios on your system.

It will give you the best of both worlds, and with time, you will be able to automate more use cases – covering regression, stress testing, etc.

I like to think of testRTC as the Test Engineer’s best companion – we’re not here to replace him – just to make him smarter and better at his job.