")
How do you compare the performance of 2 or more WebRTC services? How about comparing the performance of your service to itself over time, or on different configurations? We’ve added the tooling to answer this question to testRTC.
TL;DR – We’ve published a whitepaper on WebRTC performance comparative analysis sponsored by Vonage. You can download and read it here: Vonage Is Raising Video Quality Expectations for Live Interactions in the Post-pandemic Era
Table of contents
How it all started
Vonage approached us with an interesting request a few months back. They wanted to validate and compare the performance of the Vonage Video API to that of other leading vendors in the video CPaaS domain.
We couldn’t refuse the challenge:
- testRTC was already collecting all the metrics
- Our focus is on providing stable and reproducible results
- So it was fairly obvious that this is something within our comfort zone
What we were missing were a few APIs and mechanisms in our platform to be able to collect the information programmatically, to reduce the time it took to analyze the results for the needs of conducting comparisons.
Designing performance testing for WebRTC
We sat down with the Vonage team, thinking together on the best approach to conduct this analysis. The end result were these general requirements:
- Be able to compare a scenario across different video API vendors
- Support multiple scenarios
- Make sure to include stable network, dynamic network changes, different screen sharing content
- Different group sizes
With that in mind, there were a few things that were needed to be done on our end:
- Create the initial sample applications to use during the tests
- Write test scripts in testRTC in a generic manner, to be able to conduct a standardized comparison
- Develop simple CLI scripts to run the whole test batch across the use cases and vendor implementations
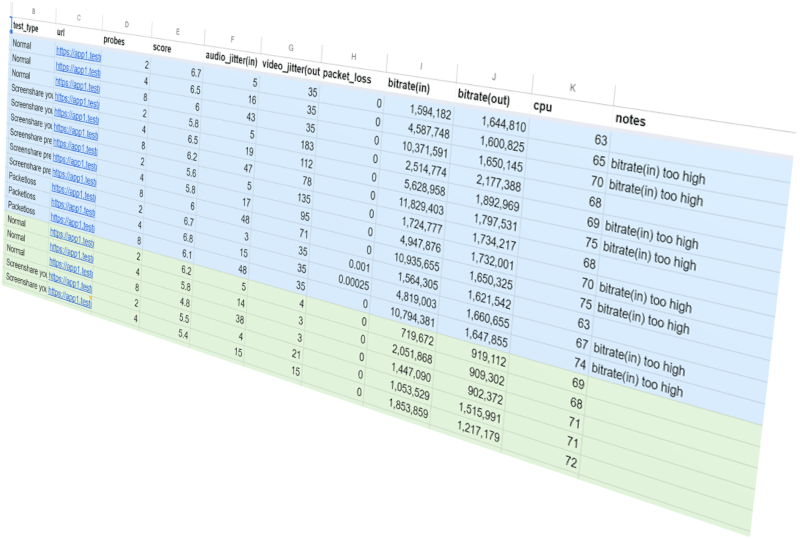
- Add the necessary means to easily compare the results (=export metrics easily and programmatically to a CSV file)
Along the way, we’ve added a few features to testRTC, so now everyone can do this independently for his own service and infrastructure.
You will find a lot more details about what scenarios we picked and the metrics we decided to look at more closely in the whitepaper itself.
The new toys in our WebRTC toolset
If you are interested in the main features we’ve used and added to enable such comparative analysis of WebRTC services, then here’s what I found useful during this project we did:
- Machine metrics data collection. We had that data visualized but never collected as numeric values. Now that we have, it is useful for objective comparisons of test results
- Added a new script command that can calculate the time from an event that occurs until a given WebRTC metric value is reached. For example, checking how long it takes for the bitrate to reach a certain value after we’ve removed a network limit
- When retrieving the result status from a test run results, we now provide more metrics information such as bitrate, packet loss, CPU use, custom metric values, etc. This can then be collected as WebRTC performance KPIs
- Executing tests via the APIs can now also control the number of probes to allocate for the test. We used this to use the same script and run it multiple times, each with a different number of browser in the call scenario
- Script to run scripts. We’ve taken the Python script that Gustavo Garvia of Epic Games used in our webinar some two years back. At the time, he used it to invoke tests sequentially in testRTC from a Jenkins job. We modified it to generate a CSV file with the KPIs we were after, and to pass the number of probes for each test as well as additional custom variables. This enables us to write a single test script per vendor and use it for multiple scenarios and tests
Assuming such benchmarking is important to you and your application, let us know and we’ll help you out in setting it up.
What I learned about comparing WebRTC applications
This has been an interesting project for us at testRTC.
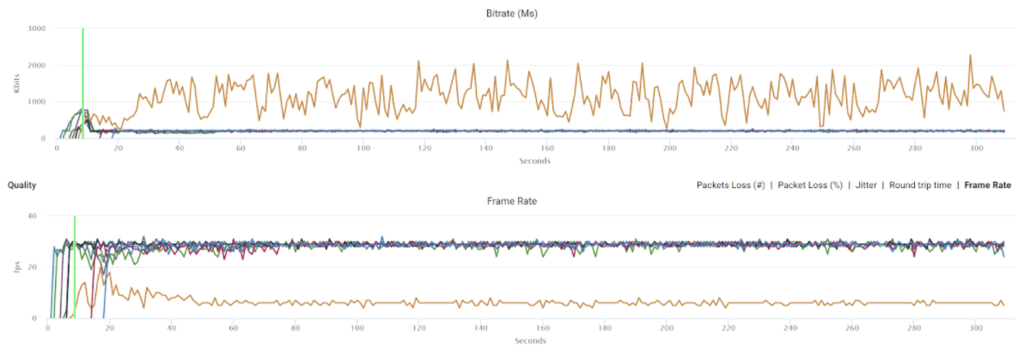
Comparing different vendors is never easy, and in WebRTC, where every feature can be implemented in various ways, this becomes even trickier. The ability to define and control the various conditions across the vendors and use cases made this simpler to deal with, and the fact that we could collect it all to a CSV file, converted to a Google Sheet and from there to graphs and insights was powerful.
Getting a group video call to work fine is a challenging task but a known one. Getting it to work well in varying conditions is a lot harder – and that’s where the differences between the vendors are more noticeable.
Performance Whitepaper: A comparative analysis of Vonage Video API
The last few months have been eye opening. We looked at the various scenarios, user behavior and network shaping issues that occur in real life and mapped them into test scripts. We then executed it all multiple times and analyzed the results. We did so on 3 different vendors – Vonage and two of its competitors.
Seeing how each platform decides to work with simulcast, how they behave to adding more users to a group call, and how they operate in various use cases has shown us how different these implementations are.
Make sure to download this free whitepaper from the Vonage website: Vonage Is Raising Video Quality Expectations for Live Interactions in the Post-pandemic Era