Methodically testing and optimizing WebRTC applications at Vowel
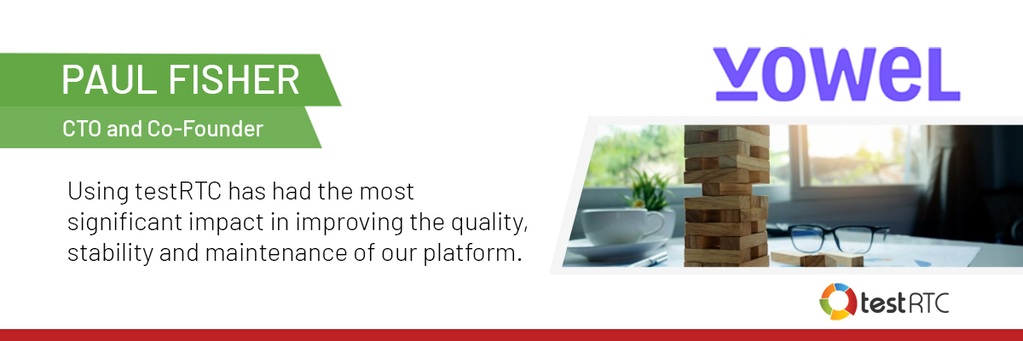
“testRTC is the defacto standard for providing reliable WebRTC testing functionality.”
Paul Fisher, CTO and Co-Founder at Vowel
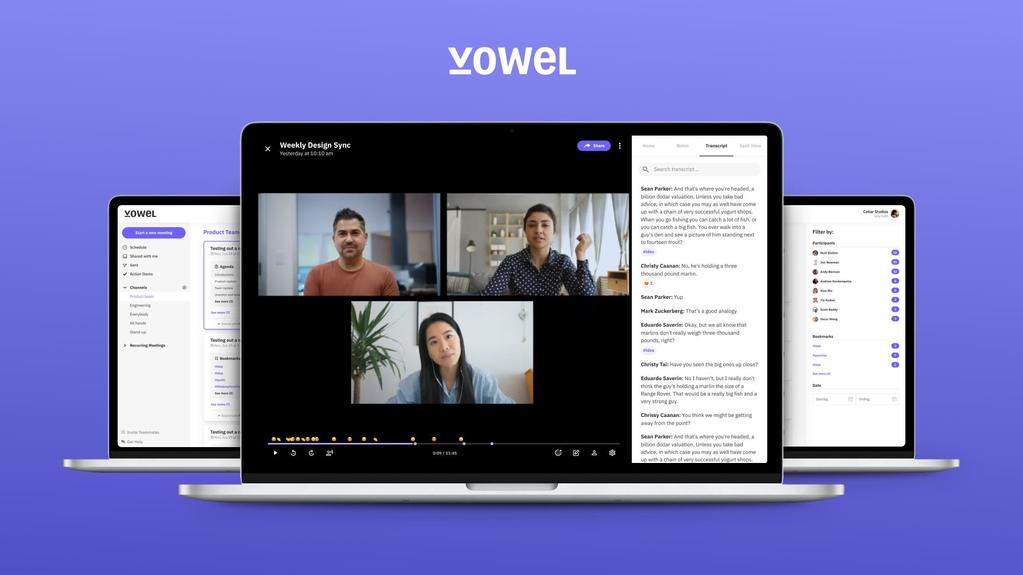
There are many vendors who are trying to focus these days on making meetings more efficient. Vowel is a video conferencing tool that actually makes meetings better. It enables users to plan, host, transcribe, search, and share their meetings. They are doing that right from inside the browser, and make use of WebRTC.
Vowel has been using testRTC throughout 2020 and I thought it was a good time to talk with Paul Fisher, CTO and Co-Founder at Vowel. I wanted to understand from him how testRTC helps Vowel improve their product and its user experience.
Identifying bottlenecks and issues, scaling up for launch
One of the most important things in a video conferencing platform is the quality of the media. Before working with testRTC, Vowel lacked the visibility and the means to conduct systematic optimizations and improvements to their video platform. They got to know testRTC through an advisor in the company, whose first suggestion was to use testRTC.
In the early days, Vowel used internal tools, but found out that there’s a lot of overhead with using these tools. They require a lot more work to run, manage and extract the results from the tests conducted. Rolling their own was too time consuming and gave a lot less value.
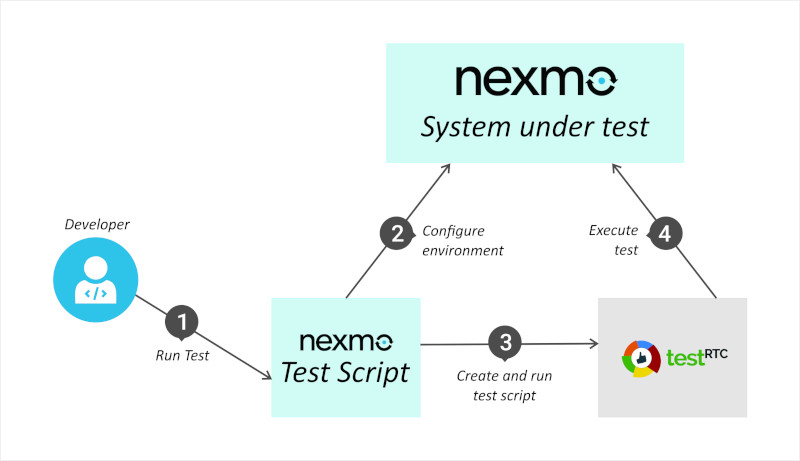
Once testRTC was adopted by Vowel, things have changed for the better. By setting up a set of initial regression tests that can be executed on demand and through continuous integration, Vowel were able to create a baseline of their implementation performance and quality. From here, they were able to figure out what required improvement and optimization as well as understanding if a new release or modification caused an unwanted regression.
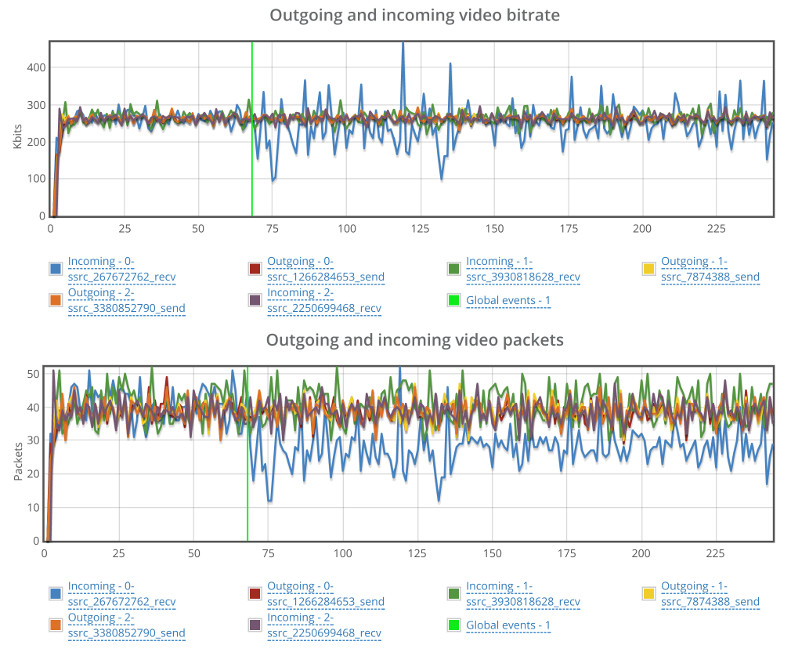
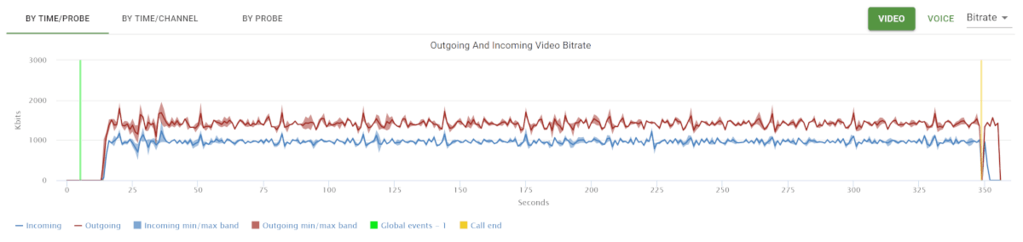
testRTC was extremely instrumental in assisting Vowel resolve multiple issues around its implementation: congestion control, optimizing resolution and bandwidth, debugging simulcast, understanding the cause and optimizing for latency, round trip time and jitter.
Vowel were able to proceed in huge strides in these areas by adopting testRTC. Prior to testRTC, Vowel had a kind of an ad-hoc approach, relying almost entirely on user feedback and metrics collected in datadog and other tools. There was no real methodical way for analyzing and pinpointing the source of the issues.
With the adoption of testRTC, Vowel is now able to reproduce issues and diagnose issues, as well as validate that these issues have been resolved. Vowel created a suite of test scripts for these issues and for the scenarios they focus on. They now methodically run these tests as regression with each release.
This approach got them to catch regression bugs earlier on, before potentially rolling out breaking changes to production – practically preventing them from happening.
Reliance on open source
Vowel was built on top of an open-source open source media server, but significant improvements, customizations and additional features were required for their platform. All these changes had to be rigorously tested, to see how they would affect behavior, stability and scalability.
On top of that, when using open source media servers, there are still all the aspects and nuances of the infrastructure itself. The cloud platform, running across regions, how the video layouts, etc.
One cannot just take an open source product or framework and expect it to work well without tweaking and tuning it.
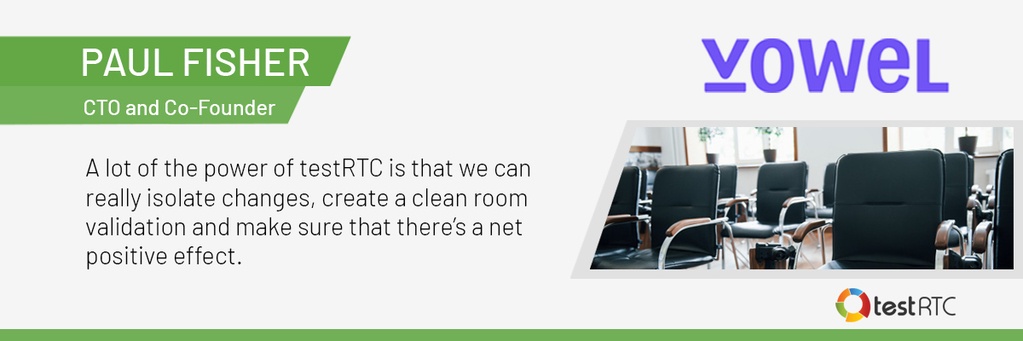
Vowel made a number of significant modifications to lower-level media settings and behavior. testRTC was used to assess these changes — validating that there was a marked improvement across a range of scenarios, and ensuring that there were no unintentional, negative side effects or complications. Without the use of testRTC, it would be extremely difficult to run these validations — especially in a controlled, consistent, and replicable manner.
One approach is to roll out directly to production and try to figure out if a change made an improvement or not. The challenge there is that there is so much variability of testing in the wild that is unrelated to the changes made that it is easy to lose sight of the true effects of changes – big and small ones.
testRTC enabled Vowel to establish a number of critical metrics and set goals across these metrics. Vowel then runs these recurring tests automatically in regression and extracts these metrics to test and validate that they don’t “fail”.
On using testRTC
testRTC is used today at Vowel by most of the engineering team.
Test results are shared across the teams, data is exported into the internal company wiki. Vowel’s engineers constantly add new test scripts. New Scrum stories commonly include the creation or improvement of test scripts in testRTC.Every release includes running a battery of tests on testRTC.
For Vowel, testRTC is extremely fast and easy to use.
It is easy to automate and spin up tests on demand with just a click of the button, no matter the scale needed.
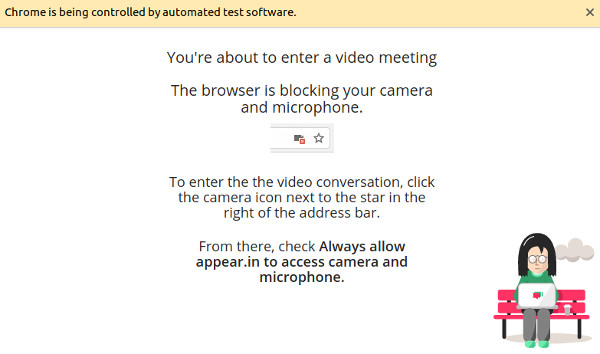
The fact that testRTC uses Nightwatch, an open source browser automation framework, makes it powerful in its ability to create and customize practically any scenario.
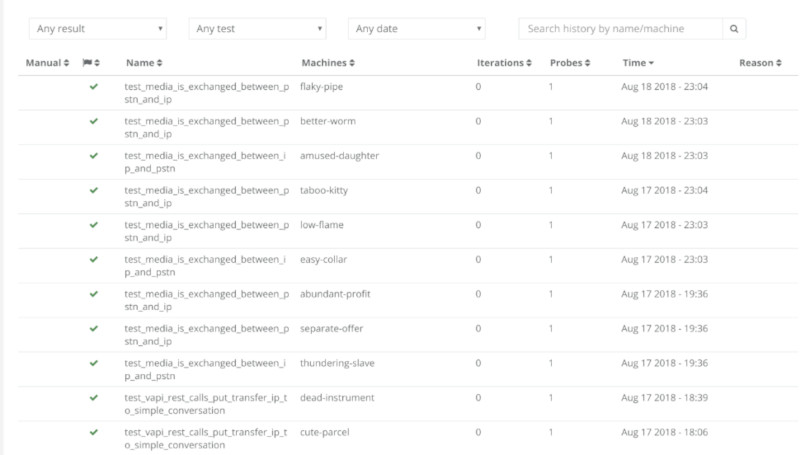
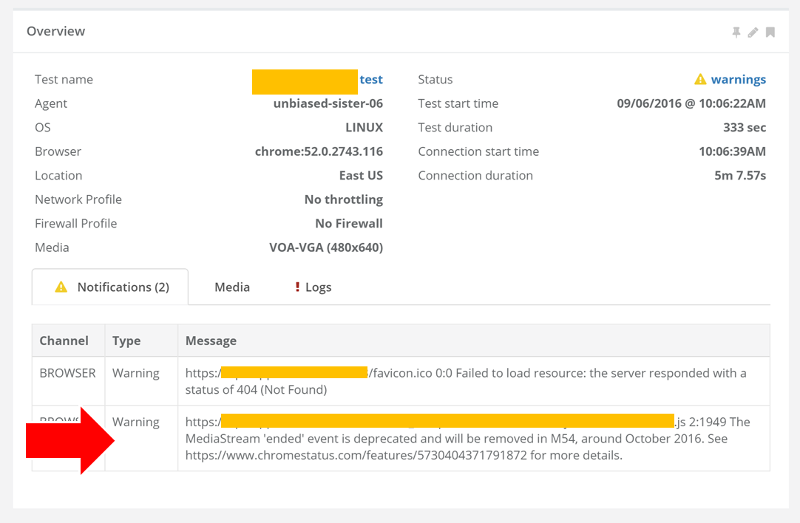
The test results are well organized in ways that make it easy to understand the status of the test, pinpoint issues and drill down to see the things needed in each layer and level.