Before scaling your WebRTC test to 100’s of probes to make sure it works well under stress, there are a couple of things you might want to take care of when using testRTC. These will improve your chances of success and will make sure that you are testing the right things in your service.
1. Use Chrome
For stress make sure to use Chrome.
your focus is on the server infrastructure, and Chrome allows much better support for the data collected as well as the bitrates supported. This makes it more suitable for such tests.
2. Monitor your own servers
Make sure you turn on monitoring on your own servers. This will enable you to correlate the test behavior and results to your server’s behavior a lot better.
At the very least, monitor CPU, memory and network traffic for your media servers and TURN servers. You should also monitor your signaling and application servers.
Note that the machines used by testRTC are all synchronized and the logs are stored in UTC time format, so you can correlate them to your server logs.
If you don’t have a solid monitoring solution, you can use some basic Linux commands to capture CPU, memory and network usage:
top -n 1 -b > top-output.txtCode language: Bash (bash)
For our own internal testing, we sometimes use the below script and then analyze the data collected as graphs on Google Sheet or Excel:
top -d 0.3 -n 3000 -b | grep Cpu | awk '{print $2}' > tp.txt

top -d 0.3 -n 3000 -b | grep buffers | awk '{print $5}' >Mem.txt

ifstat -T -l -a -q -n -b 0.3 > ifstat.txt
awk '{print $(NF)}' ifstat.txt > ifstatOut.txt
awk '{print $(NF-1)}' ifstat.txt > ifstatIn.txtCode language: Bash (bash)
3. Ramp up slowly by staggering/pacing the probes
In load tests with WebRTC, the concurrent execution of our probes may lead to server failures at the client’s end. This can happen due to slow web servers or signaling servers that aren’t designed to handle the load of hundreds of users trying to reach the same resources at the exact same time.
Assuming this isn’t the specific use case you are trying to solve, then it would be preferable to add a small delay between the probes that are joining the test.
var agentNumber = process.env.RTC_AGENT_NUM;
client.pause(agentNumber * 200);Code language: JavaScript (javascript)
Using the above snippet close to the beginning of your test script will add 200 milliseconds delay between the actions taken by each of the probes in the test. Be sure to do that prior to calling the .url() script command.
A fancier approach is suggested below.
var agentId = Number(process.env.RTC_IN_SESSION_ID);
var sessionIDX = Number(process.env.RTC_SESSION_IDX);
var sessionJoinRate = 3000;
var sessionRate = 200;
var pace = (sessionRate * (sessionIDX-1)) + (sessionJoinRate * (agentId-1));
client.pause(pace+1); Code language: JavaScript (javascript)
Here, you can (and should play around with the sessionRate and sessionJoinRate variables).
- sessionRate indicates how much time to wait between each session/room that you have in the test
- sessionJoinRate indicates how much time to wait between each probe that joins the session
Assuming a test with 100 probes, split into sessions/rooms of 5 users each – the sample snippet above will have each room start at a delay of 3 seconds from the previous room and each user joining a room will join at a delay of 200 milliseconds from the previous user.
4. Have all probes running the test
Since you are pacing the probes into the service, you may end up with probes leaving before all probes joined the session. The bigger the test, the more this is likely to happen.
If we build on the ramp up logic in the first suggestion in this list, then this is how we need to think about getting all the probes to stay in the session long enough:
- Assume we have a test with 5 people, each joining every 1 second
- First person joins. He needs to stay in call for 4 more seconds than all the rest
- Second person joins. he needs to stay in call for 3 more seconds than those coming after him
- …
- Last person joins. He needs to stay the allotted time you need them all to stay in the call
To implement such logic with our sessionRate and sessionJoinRate variables used above, we can add the following pause to the test duration where media is flowing:
var sessionCount = Math.ceil(Number(process.env.RTC_AGENT_COUNT)/Number(process.env.RTC_SESSION_SIZE));
var sessionSize = Number(process.env.RTC_SESSION_SIZE);
var totalWaitTime = sessionRate*(sessionCount-1)+sessionJoinRate*(sessionSize-1);
client.pause(totalWaitTime-pace+1);Code language: JavaScript (javascript)
The above should reverse the effect we get from staggering the probes into the session to even it out.
Add additional pause() afterwards for the actual amount of time you want all probes to stay inside the test together.
5. Add events sensibly
Now that you’ve got pacing correctly, you may want to look at how events occurring in your test are spread over time. This can give you a nice view into what is going on in the test.
Events can be added using .rtcEvent(). This adds vertical lines on the metric graphs which can help understanding how actions taken in your application (or the network) changes the behavior of media flows.
In a large test, putting a lot of global events can clutter the view. You can sparse them out a bit using the following:
var probeId = Number(process.env.RTC_AGENT_NUM);
client.rtcEvent("User " + probeId, ((probeId % 100) == 0) ? "global" : "local");Code language: JavaScript (javascript)
The above will make sure that only one of every 100 probes will make its event a global one and the others will have their event as a local one. Global events show up in the high level aggregate graph in the main test results.
WebRTC load tests are large and collect a lot of metrics, log files and screenshots. When these tests complete, our machines start uploading the results to the main data center for storage and analysis. This takes a bit of time and needs to be factored in with your test’s total run time.
Make sure to use the #timeout run option, keeping the following rule of thumb in mind:
- Call set up time – the time required to set the call by the script (make sure to factor in any pacing logic you’ve added)
- Call time – the call duration
- 15 minutes – typically we should take just 3-4 minutes extra but 15 minutes is an extra provision
In the run options, check that you have a line similar to this, based on the number of minutes needed:
#timeout:20Code language: CSS (css)
The above will make sure the test can last as long as 20 minutes. After that time, testRTC will kill the test due to timeout. The timeout won’t affect how many minutes your test will use – just define a maximum threshold to that time.
7. Use waitForElementVisible() instead of pause()
This is just best practices in writing automation scripts, but it is doubly important in WebRTC stress testing, where processing time can stretch a bit longer than usual.
When waiting for an element prior to clicking it, don’t use a .pause() statement with the intent of letting the browser load the new page or show the button it needs to – wait for that button to appear using .waitForElementVisible().
client
    .waitForElementVisible('#login', 30000)
    .click('#login);Code language: JavaScript (javascript)
The above code snippet will wait up to 30 seconds for the #login button to appear on the screen and then click on it.
8. Use pause() after waitForElementVisible()
Now that you are using .waitForElementVisible(), here’s a non-obvious suggestion – add a pause() after it. Specifically when you are running a load test. The reason for it is that sometimes, with slow servers and high CPU load, there can be delays between the changes in the DOM to the screen rendering.
In such cases, .waitForElementVisible() will return but it might be too early for the .click() command.
Here’s how to add that .pause():
client
    .waitForElementVisible('#login', 30000)
    .pause(1000)
    .click('#login);Code language: JavaScript (javascript)
9. Use expectations
Setting up a few quality checks via our .rtcSetTestExpectations() script command. These will give you some amazing insights in your stress tests.
Add a few test ranges, checking for bitrate and packetloss values.
client
    .rtcSetTestExpectation("audio.in.channel.bitrate >= 24")
    .rtcSetTestExpectation("audio.in.channel.bitrate <= 32")
    .rtcSetTestExpectation("audio.in.bitrate.max <= 36", "warn")
    .rtcSetTestExpectation("audio.in.bitrate.max <= 20", "warn")
    .rtcSetTestExpectation("audio.out.channel.bitrate >= 24")
    .rtcSetTestExpectation("audio.out.channel.bitrate <= 32")
    .rtcSetTestExpectation("audio.out.bitrate.max <= 36", "warn")
    .rtcSetTestExpectation("audio.out.bitrate.max <= 20", "warn");Code language: JavaScript (javascript)
For Opus, we’re assuming here a 28kbps bitrate on the payload. So we’re putting some thresholds of 4-8kbps for the errors and warnings to deal with fluctuations.
Here are expectations for packetloss:
client
    .rtcSetTestExpectation("audio.in.packetloss  <= 0.5")
    .rtcSetTestExpectation("audio.out.packetloss  <= 0.5")Code language: JavaScript (javascript)
The above will throw an error if packet loss percentage will get above 0.5%.
Since we use machines in data centers that have a good network, it isn’t often that you’ll experience high packet loss due to our network. Setting an expectation to 0.5% is something you should do in large stress tests of WebRTC applications, as when it fails it tends to point towards a congestion issue in your service.
Another expectation to consider adding is connectionDuration:
client.rtcSetTestExpectation("connectionDuration >= 60");Code language: JavaScript (javascript)
The example above will help analyze that your calls duration is at least 60 seconds in length. If the sessions get dropped prematurely, you will know about it. This will not guarantee a stable flow of bitrate, but if the peer connection closes, it will detect it and raise an error.
Here is another useful expectation to add:
client
    .rtcSetTestExpectation("callSetupTime < 20 ", "warn");
    .rtcSetTestExpectation("callSetupTime < 50 ");Code language: JavaScript (javascript)
Typically in load conditions, new WebRTC sessions takes forever to connect. The call set up time expectation can surface warnings and errors for this. Our recommendation – have 2 of these set to warning and error level, so you can find more problematic cases easily. Typically, allow +/- 5-10% range for your expectations to throw a warning and +/- 10-20% range for your expectations to throw an error.
10. Pace the script ending
Similarly, at the end of test you should have add some delay between the probes as they leave the test. This will help the cleanup, uploading and analysis processes that takes place by testRTC at that point in time – otherwise, they might just fail due to high load.
This is especially important in tests with long duration.
var agentNumber = process.env.RTC_AGENT_NUM;
client.pause(agentNumber * 100);Code language: JavaScript (javascript)
Add the code snippet above at the end of your test script to add a 100 millisecond delay between each probe that is leaving the test.
11. Understand our “best effort” mode
In large stress tests, we automatically configure best effort mode.
In this mode, if not all the probes that were required for the test can be successfully allocated and used, the test will still proceed as planned, just with less probes.
Learn more about best effort.
12. Collect less in longer tests
If you are running a test that is planned to be longer than 20 minutes, then add the run option #webrtc-internals:false. Collecting webrtc-internals is useless in such cases, as it only stores the last 15 minutes of metrics. Removing this will alleviate some of the strain of the data that needs to be collected during the test.
It is also advisable to set #webrtc-internals:false for stress tests where there are more than 4 incoming video media streams per probe (mainly in large group calls).
13. Baseline and increment
The larger the test you are conducting the more time consuming it will be and the more expensive. In many cases, you can find the bugs lurking in your application by running smaller tests. That means:
- You will find the bugs sooner
- It will take you less time to debug and figure out the root causes for them
- You will end up finishing your tests faster
- And it will cost you less
Here are two things you should do:
a. Baseline your stress test
Create a baseline for your comparison.
If you are running a scenario of multiple 1:1 sessions, then your baseline would be 2 probes.
If you are running a scenario of multiple group rooms, then your baseline would be the number of participants in a single room.
For live broadcast, you may want to pick a number of 2-10 probes.
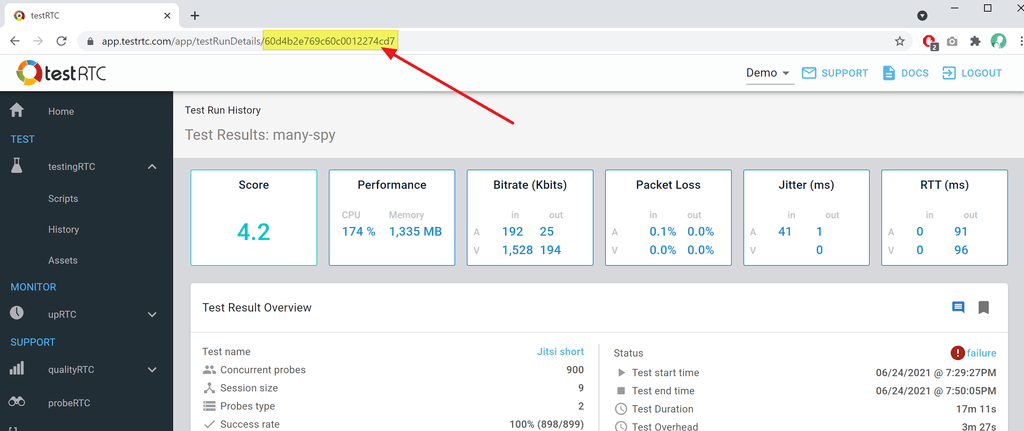
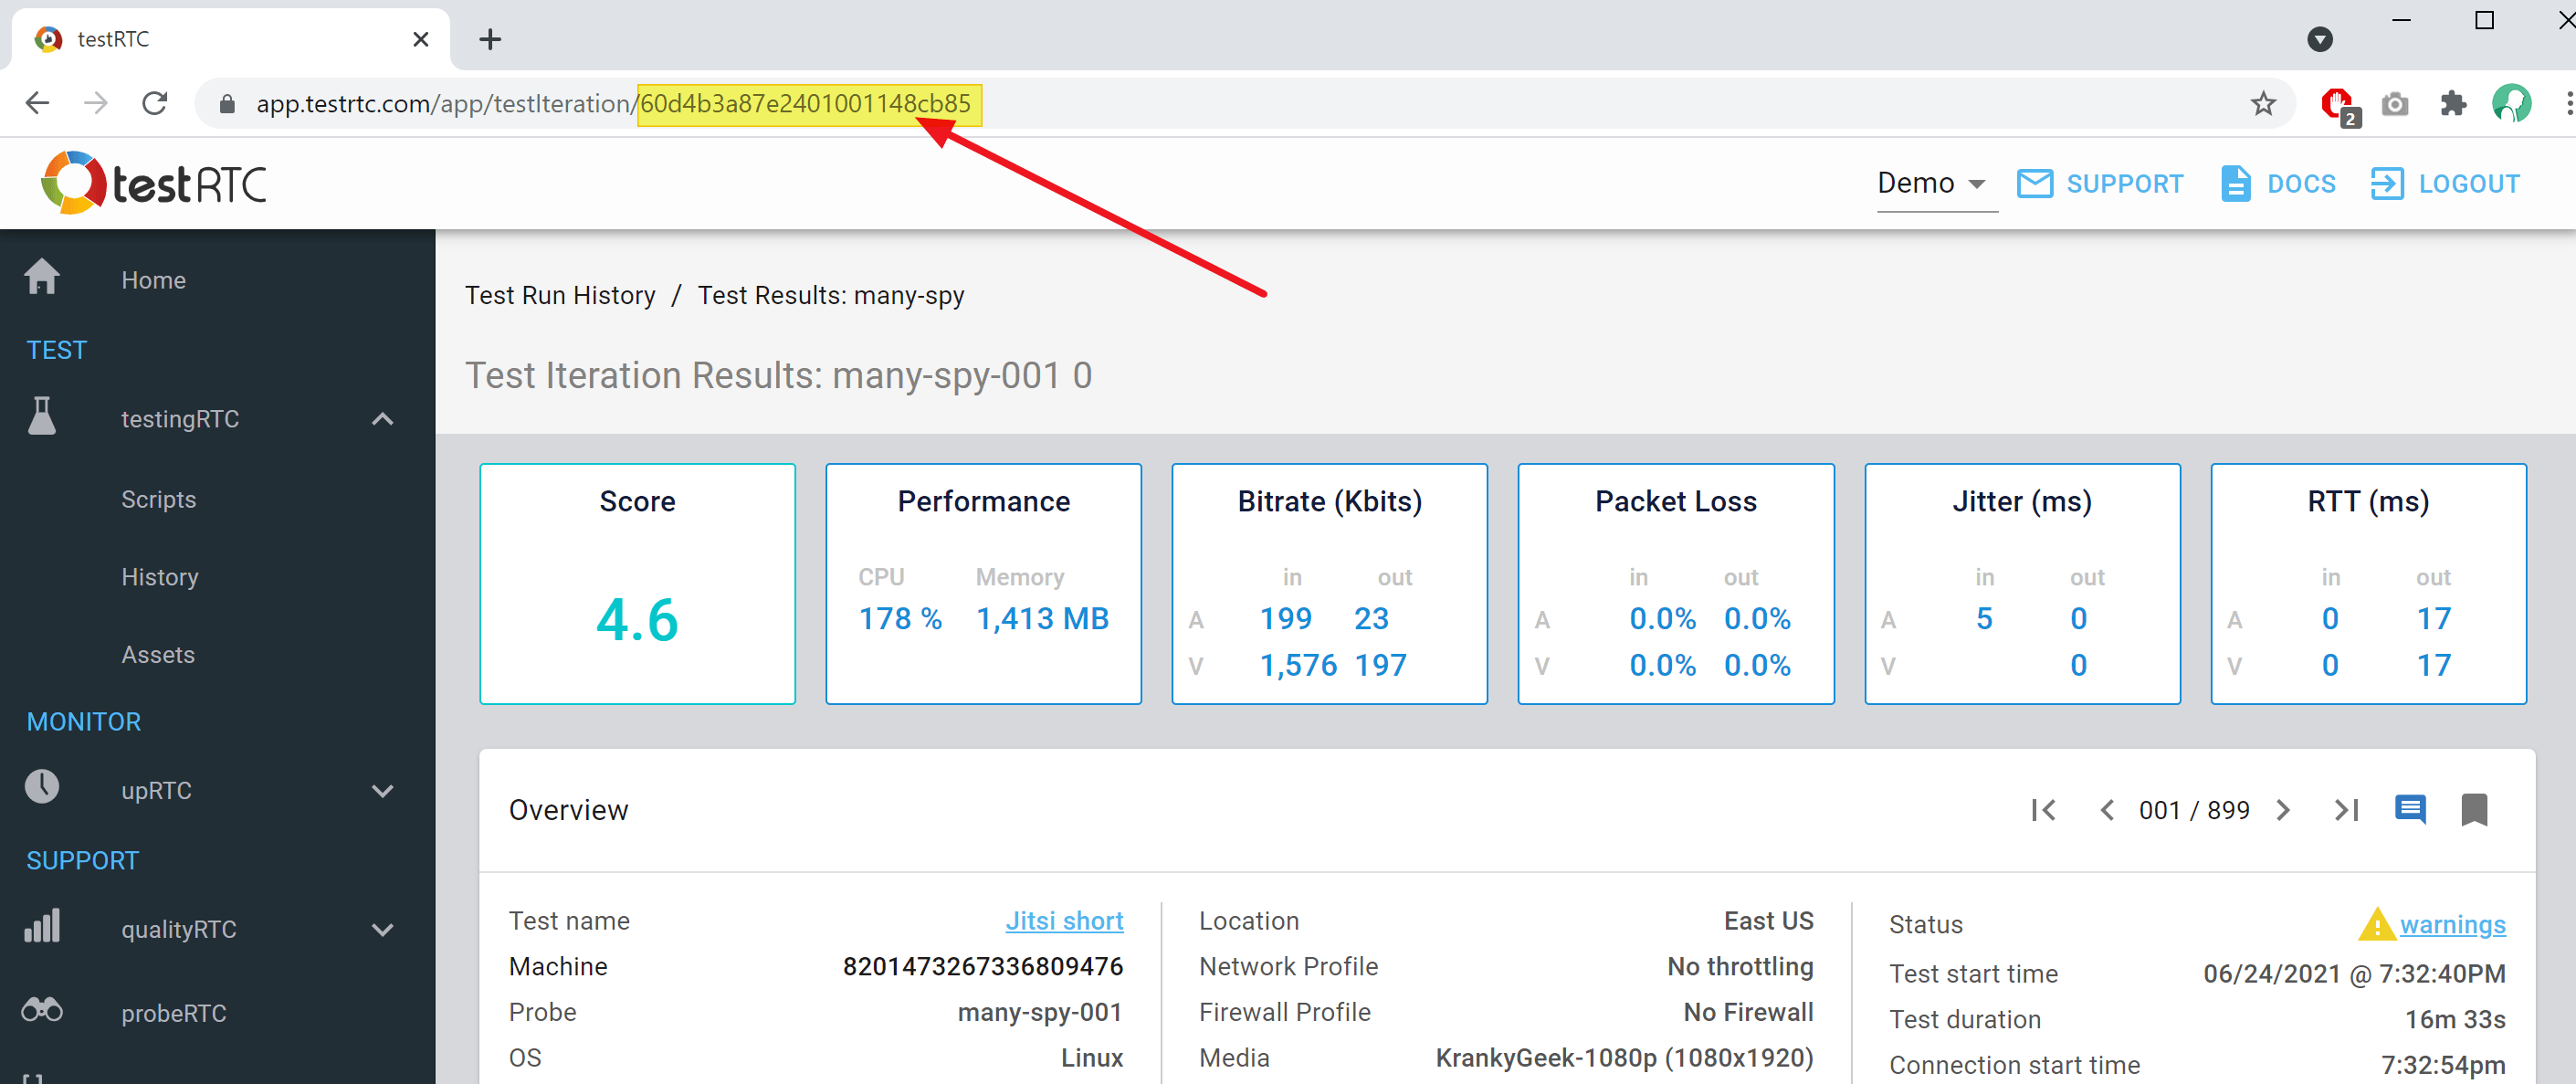
Once you have that test run, check the results and learn them. Get a feeling of the metrics you get at the ribbon at the top of the results as well as how the graphs for bitrate, packet loss, jitter and round trip behave.
Your expectation should be that as you scale, you will see as little divergence as possible from this baseline of yours.
b. Increment slowing the test size
Don’t immediately move from your baseline to the full scale stress test.
If you are aiming for 2,000 probes for example, then run scenarios with these number of probes: 4 – 16 – 64 – 160 – 300 – 500 – 1000 – 2000
Pick similar numbers/scales based on the size of your baseline test.
After each such test, compare the results and behavior to your baseline (and check your server stats as well).
The reason for this slow increment is that often times you can catch issues more efficiently with a smaller run size.
14. Long stress test preparations
Planning to run a long stress test? Something longer than 15 minutes?
In such a case, be sure to go over the long running test checklist as well.
15. Understand minutes use
Running large tests comes at a higher minutes use of our service. You will be running more probes, probably pacing them as they enter your service.
Be sure to go over our minutes calculation explanation.
Running a test with 200 or more probes? Let us know. We’ll take a look at your script and see if there are any additional useful suggestions we can make so that your WebRTC stress testing session will be… less stressful.