When a test is executed, the ‘Test Results’ page will be opened. This page presents information about the test progress while the test is running and the test results after the test execution completion.
The following information is presented while the test is running:
Test Execution Status
The Test Execution Status section presents a list of all running concurrent simulated users. For every concurrent user, a virtual machine will be created, based on a Docker container. Every Docker container is represented in the Test Execution Status list in a single machine’s row. For every machine, the following information will be presented:
Machine temporary name – an arbitrary name given to the test, for easy reference
Status – the status field goal is to easily present the test progress. This field shows the status of each probe in a test
Generic statuses such as ‘Running Test’, ‘Uploading test results’ and ‘Test Completed’ are displaed
If need be, you can define script specific statuses, using testRTC function call .rtcProgress()
The status line includes also the current iteration number
VNC button – If #the vnc run option is enabled for the test, a VNC button may be presented. By pressing on the relevant VNC button, the temporary machine’s IP and port will be copied to the user’s clipboard. You can paste the copied IP and port to your VNC viewer to open a VNC connection to the machine. For further information about how to use VNC, please refer to Using VNC
Session and iteration information – session number, machine’s number in the session and the total iterations defined for the test
Notes:
While the test is executed, all values (except the test execution status) are calculated and presented at the end of every test execution iteration and after the test execution completion
It is possible to cancel a test execution by clicking on the ‘Cancel Test’ button
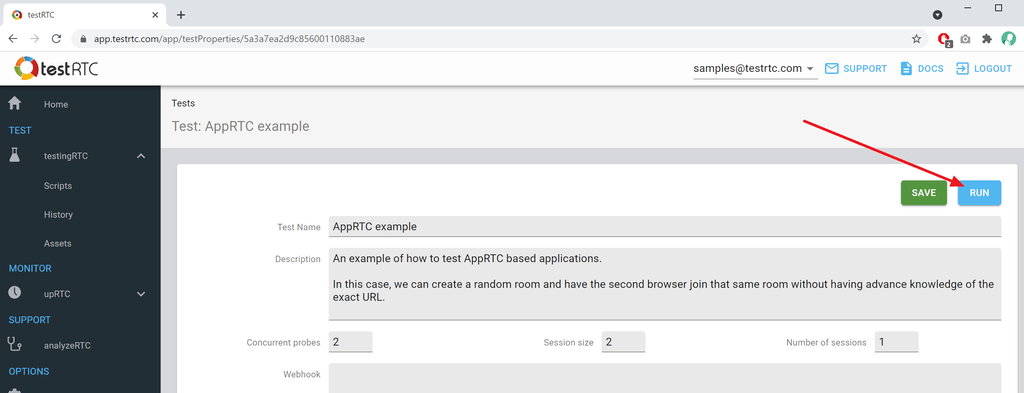
To run a test, click on the ‘Run’ button in the Test Configuration page:
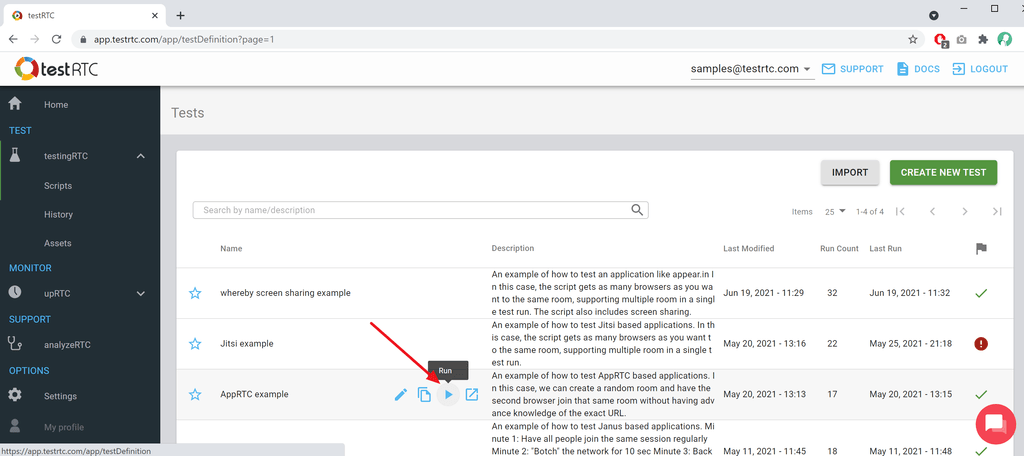
Or click on the ‘Run’ button in the Tests list page:
Our service is built and designed from the onset to support continuous integration and automated build environments. As such, we support an external API to run tests and receive the test execution results. For further information about our external APIs, refer to:
In many test cases, you may want to run different probes that are logically “linked” to sessions. For example, you may wish that different users connect to different video chat rooms when testing a system.
testRTC supports the distribution of its probes to multiple sessions, and, in addition, it is possible to define a different logic or role for every probe in the session.
Activate Sessions’ Logic
Things to note when reading the following information;
Concurrent probes = the number of browsers/users.
Session size = the limit of probes per room.
Number of sessions = the number of rooms.
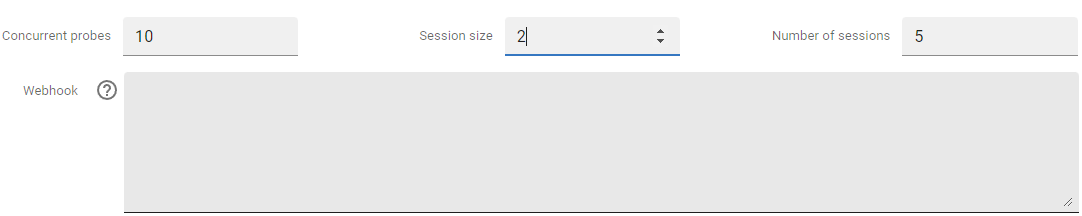
To activate the sessions’ logic, you must use the ‘Session size’ parameter in the test script editor. The logic will be enabled if the value is set to two or higher. The number of sessions is then generated by dividing the number set for concurrent probes by the session size.
Example: If the number of concurrent probes is set to 10 and the session size is set to 2, it will create 5 sessions.
Figure: Session Configuration
You can use two powerful tools when using sessions in testRTC:
Synchronization: You can synchronize between probes within the same sessions, having a probe wait on actions taken by other probes by using the .rtcWaitForSessionValue().
Variables: New environment variables will be created and managed for you by the testRTC manager so you can use them in the test script.
The logic-related environment variables are:
RTC_SESSION_IDX – the numeric index of this session from total number of sessions in the test (starts with 1)
RTC_SESSION_NAME – the session unique name for the test. The session name includes the session’s (numeric) index of this session from total number of sessions in the test (starts with 1). The session name format is [Test random name]-“room”[RTC_SESSION_IDX]
RTC_IN_SESSION_ID – the (numeric) index of this probe in the specific session (starts with 1)
It is possible to use these values in different locations in the script. For example, the following code sample demonstrate how to generate dynamic rooms’ URLs based on the session unique name:
The following videos give an introduction to the sessions’ logic and how it can be used.
Part 1
Part 2
Code Sample: Multiple rooms with 2 probes in each
The following code sample creates multiple rooms with 2 probes in a room. Every user will run a different logic. This approach can be used, for example, to test a service that is based on calling action. In this example, the first user in every room will be the caller and the second user will be the callee.
varprobeType=Number(process.env.RTC_IN_SESSION_ID);client.url(process.env.RTC_SERVICE_URL).waitForElementVisible('body',1000)if (probeType===1) {// The callerclient// Sign-in.setValue('#user','user1').setValue('#password', ['pass1',client.Keys.ENTER])// Call.click('#call') ...}else{// The calleeclient// Sign-in.setValue('#user','user2').setValue('#password', ['pass2',client.Keys.ENTER])// Wait for the call ...});// Give both probes some time to run, so we can collect QoS informationclient.pause(10000); }
The test’s web browsing flow is defined as a Nightwatch/Selenium test case. Nightwatch.js enables quick, simple but powerful tests writing, using only Javascript (Node.js) and CSS or Xpath selectors. Nightwatch.js uses the powerful Selenium WebDriver API to perform commands and assertions on DOM elements. For further information about Nightwatch, please refer to http://nightwatchjs.org.
Our goal is to enable you to focus on your core logic. Therefore, testRTC takes care of the script’s generic and infrastructure parts, such as the script’s initialization and objects creation.
You should focus only on the script logic to test your service.
Function types
In the test scripts we use functions and commands from the following groups:
Nightwatch/Selenium commands – the Nightwatch/Selenium commands handle all browsing related actions, such as navigating to specific web pages, clicking on buttons and screen artifacts, filling in form fields, etc. Detailed Nightwatch/Selenium API reference can be found in http://nightwatchjs.org/api#commands
testRTC functions – testRTC functions were implemented in order to help you debug your service. testRTC functions supports actions such as take a screen shot and create a log message. Check out or list of WebRTC-specific script commands
Javascript – Javascript types, operators, objects and methods can be used in the script
Chaining commands
The client object that appear at the beginning of the script handles all Nightwatch/Selenium browsing related actions, such as navigating to specific web pages, clicking on buttons and screen artifacts, filling in form fields, etc.
All functions in the script return the client object and therefore a common method to scripts writing is chaining commands. When chaining commands, there is no need to add the semicolon symbol at the end of every command.
In general, most of the scripts will be based on the following flow:
Navigate to the service web page
If needed, enter some details (e.g. for video chat room, type user name and password to login)
Click on a button to join a WebRTC session. At this point, the video call page should be loaded. As part of the video call page, the browser will be requested to stream the camera and microphone to the other parties in the call. When the camera and microphone streaming will be requested, testRTC will stream the selected video and audio media, instead the machine’s camera and microphone
Consume media. Ensure to consume the media for enough time so testRTC system will be able to collect enough QoS information
If needed, perform activities during the session, such as enter chat messages. In any case, we need to keep the test running for the requested time period. It can be done by using the pause command
The total script duration will actually set the test’s total duration
Test end / Session stop: While a WebRTC session is active, the browser collects statistical information that we will parse in order to present the test results, calculate test expectations, etc. If the browser will surf to a new URL, the browser will clear the WebRTC statistics and we will not be able to collect this information at the end of the test. Therefore please ensure that you will not surf to a new URL at the end of the WebRTC session
Note that in many implementations, terminating a session will redirect the browser to a new URL. In such cases, please refrain from terminating the session. The session will be killed after we will collect the data and we will delete the instance that executed the test. For further information, please see here.
Single script, multiple probes
In testRTC, each test is executed using a single test scripts that gets executed by multiple probes (=browsers) simultaneously.
For tests that are symmetric in nature, where all probes need to perform the same actions, this is great.
If you need to create asymmetric tests, where different probes run different logic (such as instructor/students or joining different rooms), then this can be achieved by using the environment variables. For example, variables such as process.env.RTC_IN_SESSION_ID along with if statements are quite useful in providing different flows for instructors and students joining the same room.
The test metadata stores the overall configuration and metadata of the test script. This includes the following fields:
Test Name
The name of the test. This appears at test execution as well as in the reports. We suggest making the names memorable – ones that explain what it is the test does.
Description
A longer description of the test. Here you should explain what your test does in a bit more details – it will help you in the future to remember what you’ve done, as well as make it easier for others in your team to use the test.
Concurrent Probes, Session size & Number of sessions
In this subsection we determine the number of probes that are used in this test as well as how these probes are grouped into rooms/sessions.
The Concurrent Probes field enables you to set the number of probes (=browsers) that will take part in this test, while the Session size field indicates how many probes you want in the same room/session. The Number of sessions field is automatically calculated.
The Webhook field allows you to invoke a webhook call at the end of the test run. This webhook will be called when a test finishes for both failures and success scenarios. It can be used for testing as well as monitoring.
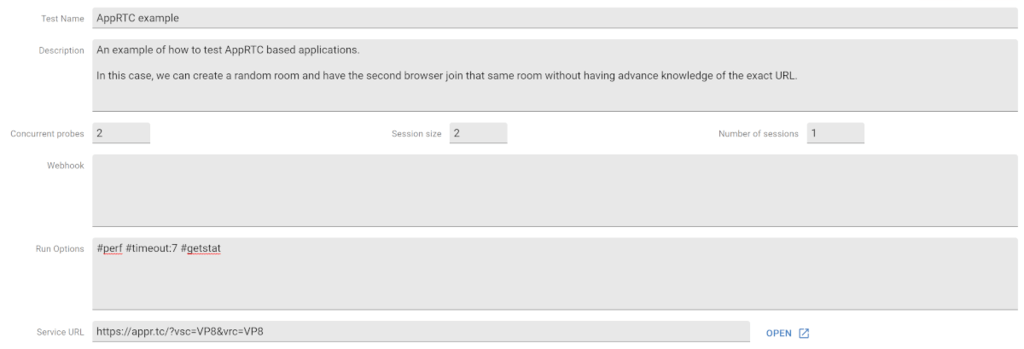
These options offer advanced settings that can be used by the test once executed. Each option is defined as a hashtag. You can use multiple options by separating them using a comma.
When a test is executed, it can be very helpful to be able to track the test progress by opening a browser, as a regular user, that points to the tested session.
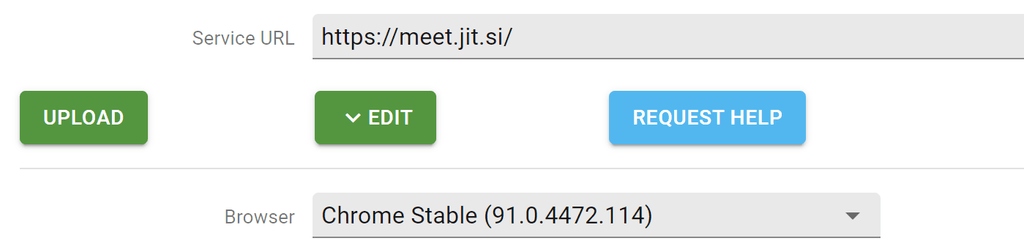
The tested service URL definition can be helpful in few aspects:
If a service URL is defined, you can click on the ‘Open’ link to manually open a new browser tab with the service URL
If the service URL’s ‘Auto open’ checkbox is checked, a new browser tab, with the service URL, will be opened automatically when the test execution is started
The defined service URL can be used in the test’s script by using the process.env.RTC_SERVICE_URL environment variable
Test script
The test’s web browsing flow is defined as a Nightwatch/Selenium test case. Nightwatch.js enables quick, simple but powerful tests writing, using only Javascript (Node.js) and CSS or Xpath selectors. Nightwatch.js uses the powerful Selenium WebDriver API to perform commands and assertions on DOM elements. For further information about Nightwatch, please refer to http://nightwatchjs.org.
In the ‘Test Script’ section you can perform the following actions:
Upload – upload a script from a file.
Edit – edit the test’s script in testRTC’s internal editor
Request help – If you need assistance with script writing – we are here to help. Click on the ‘Request help’ button and we will contact you
Machine profiles
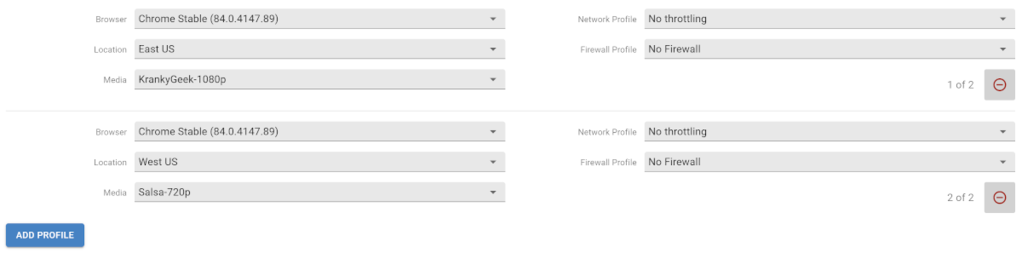
The Test Profiles section describes the executed agents’ configurations. By default, a single testing profile will be used for the test. In such a case, all agents in the test will have the same testing profile. If additional profiles will be defined for the test, the agents’ profiles will be divided between the agents (more details in next section).
The Testing Profile is composed of the following characteristics:
Browser
The Browser drop down enables to choose the executed agents’ browser type and version.
Location
The Location drop down enables to choose the probes’ geographical location.
We offer a more granular location selection when needed.
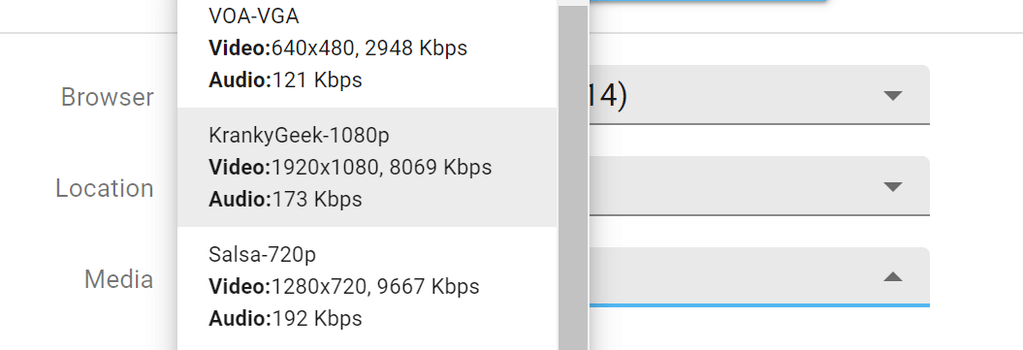
Media
Choose media (video and audio) that will be used in a test. You can choose based on the media resolution and bandwidth.
Network Profile
The Network Profile drop down enables to choose the probes’ network profile. The network profile is composed of different criteria, such as the agents’ bandwidth, latency and drop packets percentage.
The Firewall Profile drop down enables to choose the probes’ opened and closed networking ports and packets filtering rules. The firewall profile can be used to simulate different networking configurations such as different firewall and NAT rules.
In order to define multiple Test Profiles for a test, click on the ‘Add Profile’ button. A new Testing Profiles section will be added and can be modified.
The probes’ configuration will be distributed between the Test Profiles in a round-robin fashion – If you have more profile than users, then only the first few profiles will be assigned. If you have more users than profiles, then once the number of users reaches the number of profiles, we start the allocation of profiles all over again.
For example, for a test with 7 concurrent users and 3 Testing Profiles, the probes’ configuration will be:
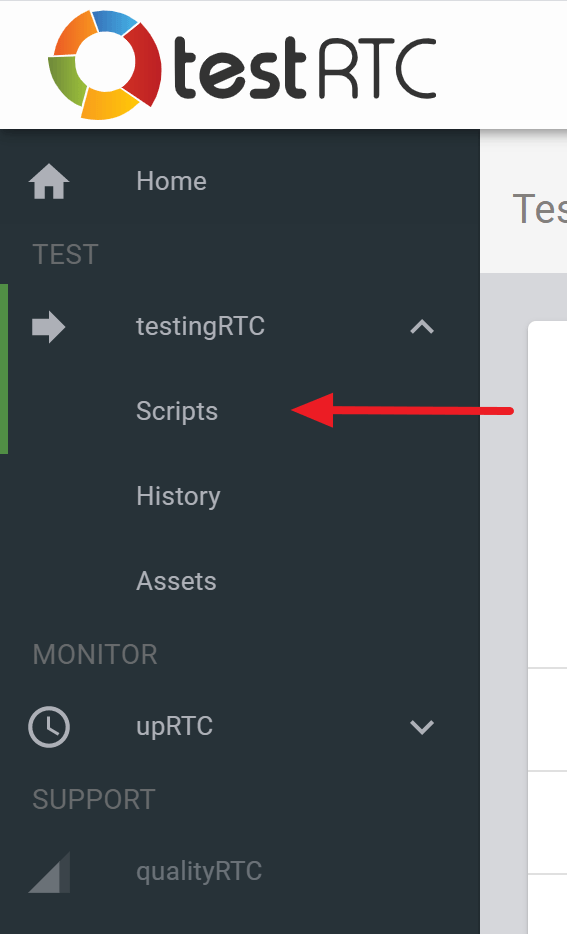
To enter the tests page, click on the ‘testingRTC | Scrips’ menu item at the left side menu bar. From the test scripts page you can manage (create, modify and delete) tests and run tests.
The Scripts page includes a list of all available test scripts in your account. You can filter the presented tests by entering tests’ name or description (full string or sub-string).
In the test scripts table, you can see, for every test, the test name, description, last time it was modified, run count (number of times that this test was executed), last run time and status of the last run.
From the tests page you can:
Add a new test by clicking on the ‘Create New Test” button (button is located at the top-right corner of the page).
Importing a previously exported test by clicking on the ‘Import’ button (button is located at the top-right corner of the page).
Edit an existing test by clicking on the test row.
Duplicating a test so you can use it as a starting point for a new test or monitor (or in order to keep a stable test as a baseline).
Run a test, by clicking on the test’s ‘Run’ button.
To perform the different activities from this page, you can click at any location in any test’s row to enter the test’s page. In addition, when hovering on a test row, several action buttons will appear below the test’s name. You can click on these action buttons to immediately edit, duplicate or run a test.
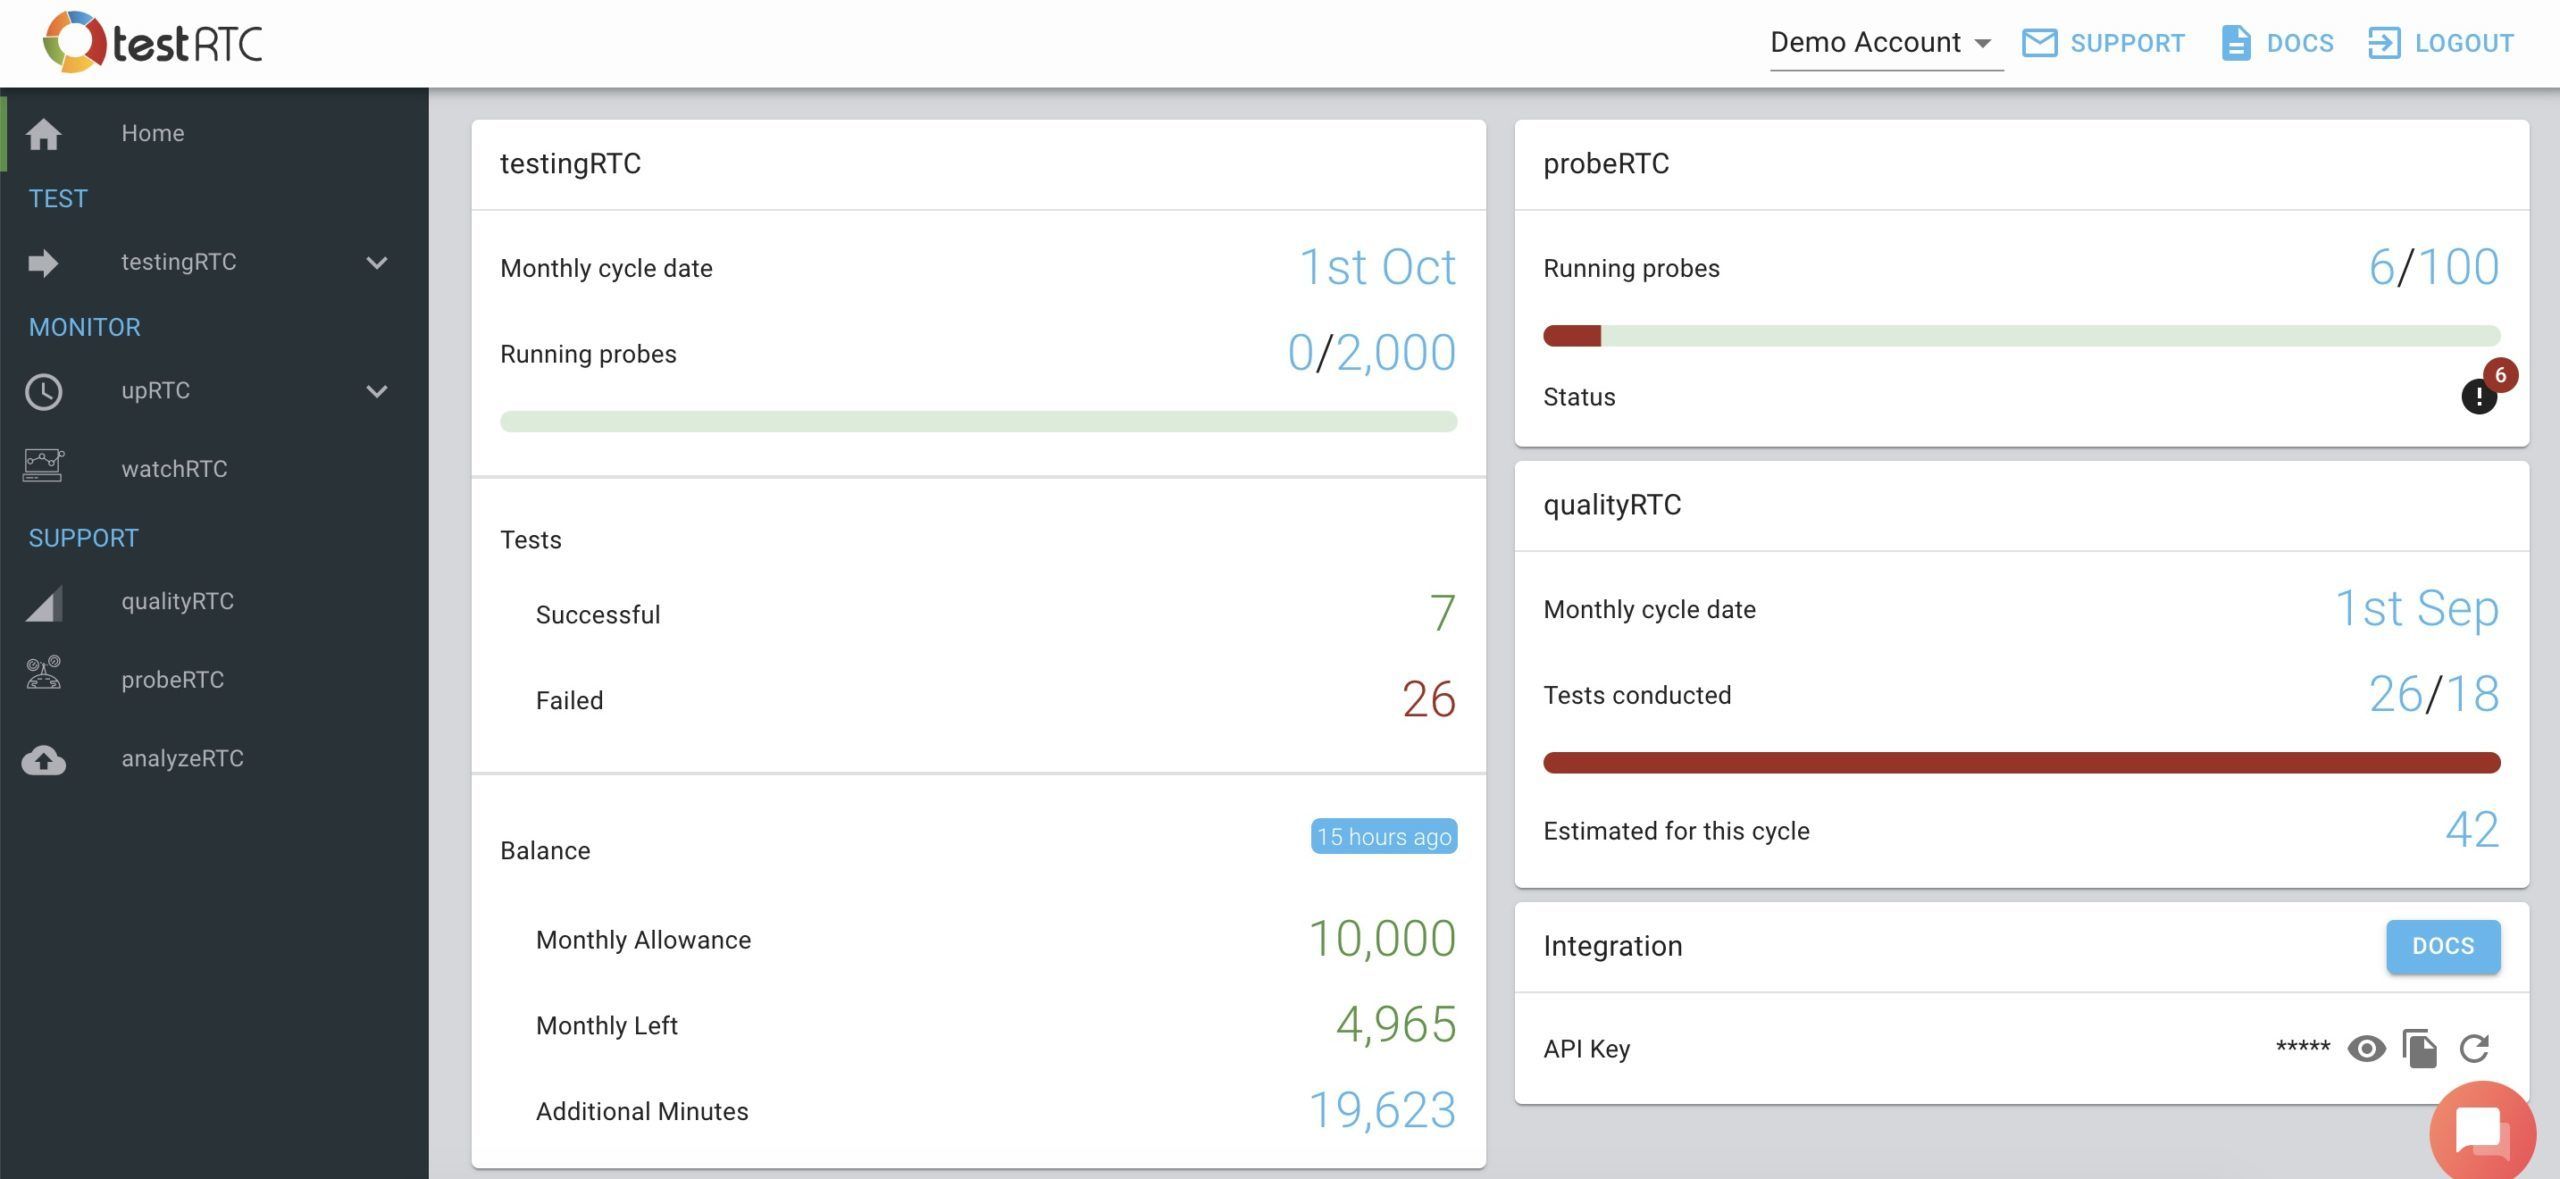
The home dashboard presents a bird’s eye view of your activities in testRTC.
The dashboard is composed of the following areas:
Sidebar
The sidebar shows the various services that are available in your account.
If you have just registered for an evaluation account then this is limited to testingRTC.
You can use the sidebar to navigate to the service you want to use.
Services Highlights
The main area of the dashboard shows the current status and highlights of the services that are enabled in your account.
This is kept at a high level to give you a glance of what is happening.
Integration
A small integration area holds your API key as well as a link to our API documentation. This can be used for any automation or continues integration you are planning.
Release notes
Another area in the main dashboard shows the latest release notes of updates made to our service.
testRTC’s testing and monitoring capabilities are built for the new generation of WebRTC-based communications applications. testRTC enables you to improve the user experience of your service pre-launch as well as in production.
For testing and monitoring, testRTC simulates real web browsers interacting with your service directly. This use of real browser simulation ensures that your service gets tested in the environment in which your users rely on, using the same medium your users use (the web browser with its WebRTC implementation).
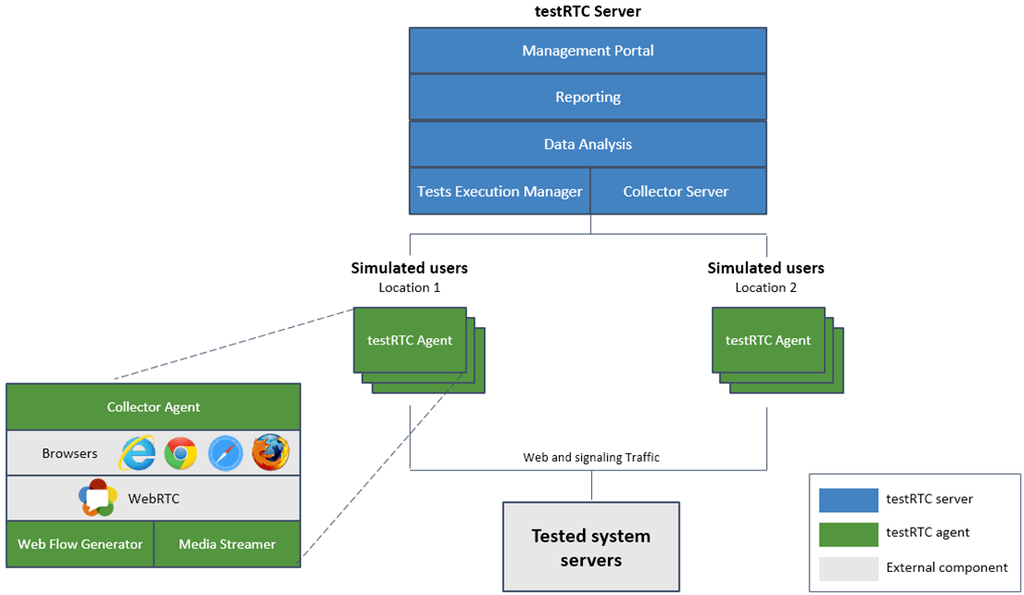
The testing solution is composed of two main components:
testRTC Server
testRTC Probe (also known as testRTC Agent)
testRTC Server
The testRTC server is the component that users interact with directly. It is composed of the following components:
Management portal – The management portal is the frontend interface that enables users to create tests, execute them and view the tests’ execution reports
Reporting – The reporting component is responsible for generating different reports, based on users’ requests
Data Analysis – The data analysis component collects data from testRTC agents and analyzes the results, in order to obtain valuable information about the tested system
Tests and Monitors Execution Manager – the Tests and Monitors Execution Manager orchestrates the execution of tests and monitors, taking care of the test from beginning to end. The Tests and Monitors Execution Manager manages all testRTC agent machines and decides where to start every test session
testRTC Probe (Agent)
The testRTC testing probe is responsible for a single test session execution. The probe is based on Docker container technology. The testRTC probe maps into a single web browser (=user) that is interacting with your WebRTC-based service. The probe is composed of the following components:
Web Flow Generator – In order to simulate a real user behavior, the testRTC probe simulates a web browsing flow that is defined as a Nightwatch/Selenium test case. The Web Flow Generator receives execution commands from the Tests Execution Manager
Media Streamer – The Media Streamer is responsible for injecting media content to the web browser as if they were injected from the computer’s microphone and/or camera
Browsers and WebRTC – a standard installation of a specific browser type and version. Multiple browser versions can be tested simultaneously in a single test case
Collector Agent – The Collector Agent sends the executed test results and information to the testRTC server
The following short explanatory videos that show how test scripts are used by testRTC’s testing and monitoring products. Watch these videos for quick and convenient explanations of how to use our system to its greatest potential.
Well… this week we had a bit of a rough start, but we’re here. We just updated our production version of testRTC with some really cool capabilities. The time was selected to fit with the vacation schedule of everyone in this hectic summer and also because of some nagging Node.js security patch.
As always, our new release comes with too many features to enumerate, but I do want to highlight something we’ve added recently because of a couple of customers that really really really wanted it.
Screen sharing.
Yap. You can now use testRTC to validate the screen sharing feature of your WebRTC application. And like everything else with testRTC, you can do it at scale.
This time, we’ve decided to take appear.in for a spin (without even hinting anything to Philipp Hancke, so we’ll see how this thing goes).
First, a demo. Here’s a screencast of how this works, if you’re into such a thing:
Testing WebRTC Screen Sharing
There are two things to do when you want to test WebRTC screen sharing using testRTC:
“Install” your WebRTC Chrome extension
Show something interesting
#1 – “Install” your WebRTC Chrome extension
There are a couple of things you’ll need to do in the run options of the test script if you want to use screen sharing.
This is all quite arcane, so just follow the instructions and you’ll be good to go in no time.
Here’s what we’ve placed in the run options for appear.in:
The #chrome-cli thingy stands for parameters that get passed to Chrome during execution. We need these to get screen sharing to work and to make sure Chrome doesn’t pop up any nagging selection windows when the user wants to screen share (these kills any possibility of automation here). Which is why we set the following parameters:
auto-select-desktop-capture-source=Entire screen – just to make sure the entire screen is automatically selected
use-fake-ui-for-media-stream – just add it if you want this thing to work
enable-usermedia-screen-capturing – just add it if you want this thing to work
The #extension bit is a new thing we just added in this release. It will tell testRTC to pre-install any Chrome extensions you wish on the browser prior to running your test script. And since screen sharing in Chrome requires an extension – this will allow you to do just that.
What we pass to #extension is the location of a .tar.gz file that holds the extension’s code.
Now that we’ve got everything enabled, we can focus on the part of running a test that uses screen sharing.
#2 – Show something interesting
Screen sharing requires something interesting on the screen, preferably not an infinite video recursion of the screen being shared in one of the rectangles. Here’s what you want to avoid:
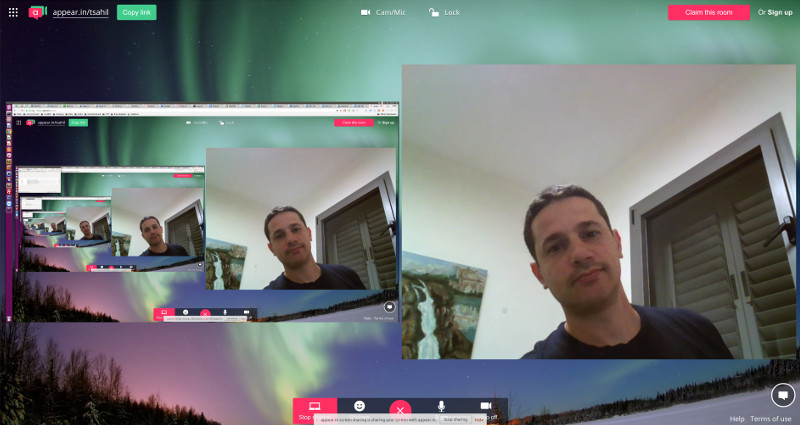
And this is what we really want to see instead:
The above is a screenshot that got captured by testRTC in a test scenario.
You can see here 4 participants where the top right one is screen sharing coming from one of the other participants.
How did we achieve this in the code?
Here are the code snippets we used in the script to get there:
var videoURL = "https://www.youtube.com/tv#/watch?v=INLzqh7rZ-U";

client
   .click('.VideoToolbar-item--screenshare.jstest-screenshare-button')
   .pause(300)
   .rtcEvent('Screen Share ' + agentSession, 'global')
   .rtcScreenshot('screen share ')
   .execute("window.open('" + videoURL + "', '_blank')")
   .pause(5000)

   // Switch to the YouTube
   .windowHandles(function (result) {
       var newWindow;
       newWindow = result.value[2];
       this.switchWindow(newWindow);
   })
   .pause(60000);
   .windowHandles(function (result) {
       var newWindow;
       newWindow = result.value[1];
       this.switchWindow(newWindow);
   });
We start by selecting the URL that will show some movement on the screen. In our case, an arbitrary YouTube video link.
Once we activate screen sharing in appear.in, we call rtcEvent which we’ve seen last time (and is also a new trick in this new release). This will add a vertical line on the resulting graphs so we know when we activated screen sharing (more on this one later).
We call execute to open up a new tab with our YouTube link. I decided to use the youtube.com/tv# URL to get the video to work close to full screen.
Then we switch to the YouTube in the first windowHandles call.
We pause for a minute, and then go back to the appear.in tab in the browser.
Let’s analyze the results – shall we?
Reading WebRTC screen sharing stats
Screen sharing is similar to a regular video channel. But it may vary in resolution, frame rate or bitrate.
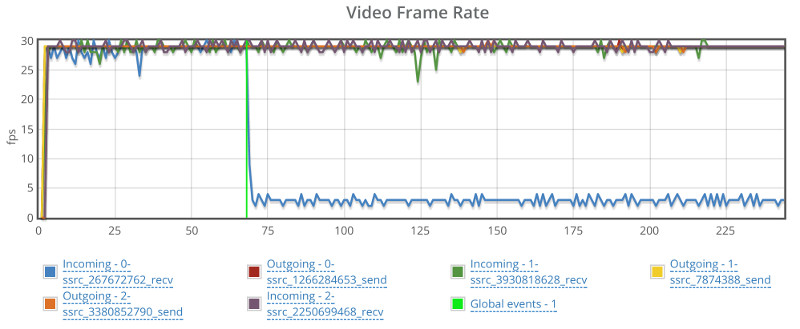
Here’s how the appear.in graphs look like on one of the receiving browsers in this test run. Let’s start with the frame rate this time:
Two things you want to watch for here:
The vertical green line – that’s where we’ve added the rtcEvent call. While it was added to the browser who is sending screen sharing, we can see it on one of the receiving browsers as well. It gets us focused on the things of interest in this test
The incoming blue line. It starts off nicely, oscillating at 25-30 frames per second, but once screen sharing kicks in – it drops to 2-4 frames per second – which is to be expected in most scenarios
The interesting part? Appear.in made a decision to use the same video channel to send screen sharing. They don’t open an additional video channel or an additional peer connection to send screen sharing, preferring to repurpose an existing one (not all services behave like that).
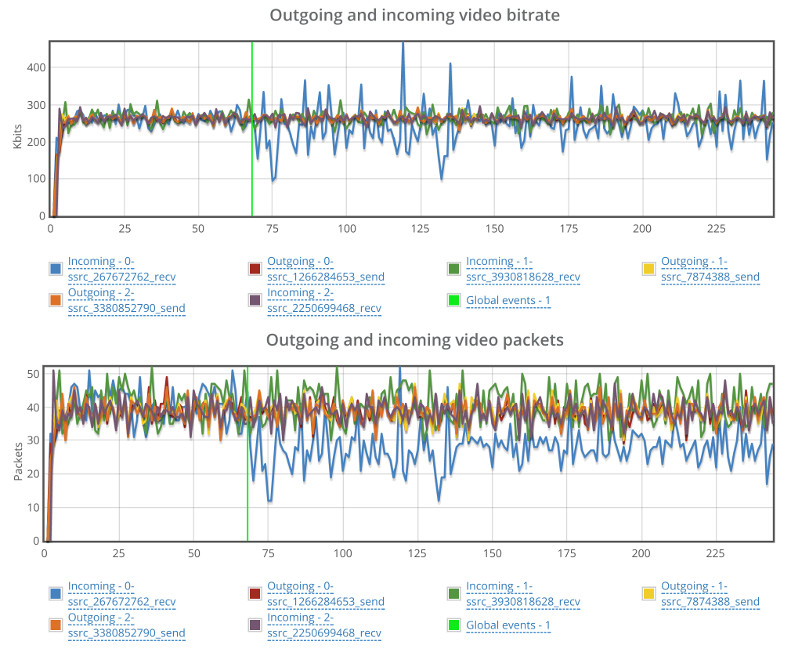
Now let’s look at the video bitrate and number of packets graphs:
The video bitrate still runs at around 280 kbps, but it oscillates a lot more. BTW – I am using the mesh version of appear.in here with 4 participants, so it is going low on bitrate to accommodate for it.
The number of video packets per second on that incoming blue line goes down from around 40 to around 25. Probably due to the lower number of frames per second.
What else is new in testRTC?
Here’s a partial list of some new things you can do with testRTC
More information in test runs on the actual script and run options used
More information across different tables and data views
Want to check screen sharing at scale?
You can now use testRTC to automate your screen sharing tests. And the best part? If you’re doing broadcast or multiparty, you can now test these scales easily for screen sharing related issues as well.
If you need a hand in setting up screen sharing in our account, then give us a shout and we’ll be there for you.