All Posts by Tsahi Levent-Levi

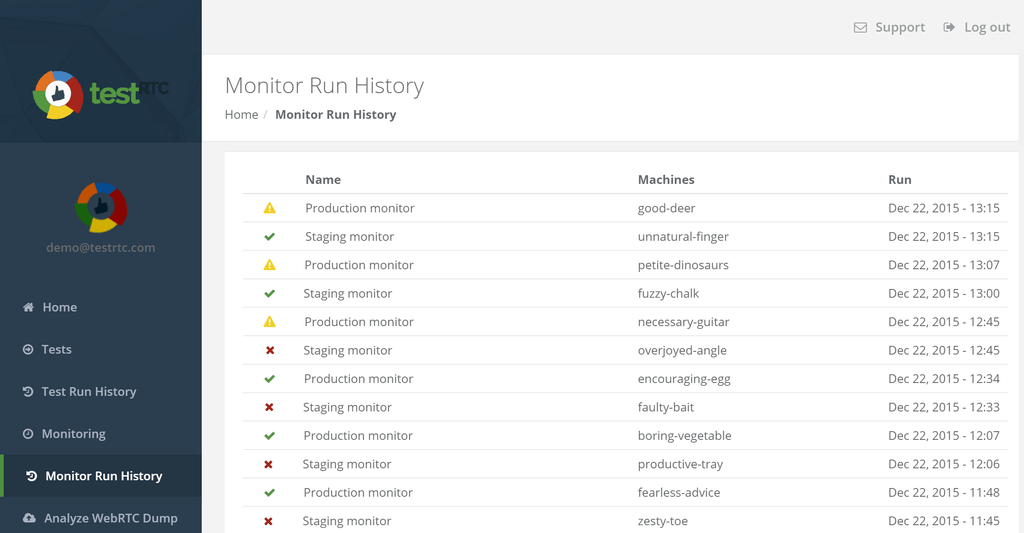
Integrate a webhook at the end of a monitor and test run

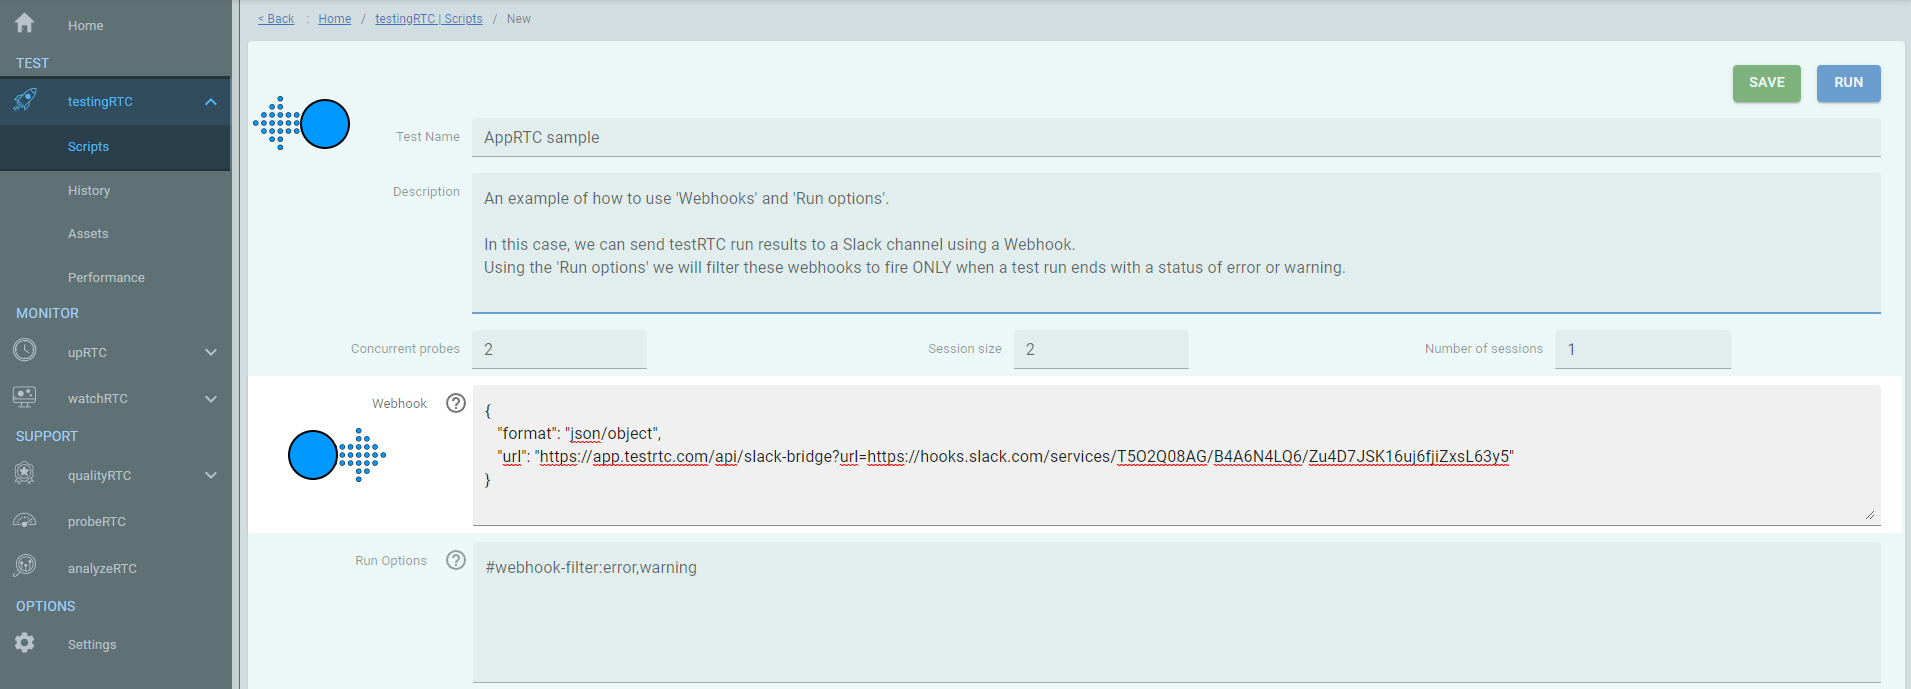
You can define a webhook that will be called at the end of a monitor and test run execution. In order to define the ‘end of test/monitor webhook’, you will need to add the required webhook information to the test configuration page, under the ‘Webhook’ parameter.

Read Webhooks in testRTC for more information on webhook use.

Tip: You may also choose to Integrate a webhook filter should you wish to invoke a webhook only in certain conditions.


Supported webhook structures

There are two types of ‘end of test/monitor webhook’ field structure supported:

  1. Standard (see example below)
  2. Advanced (custom body templating)

Webhook testing example
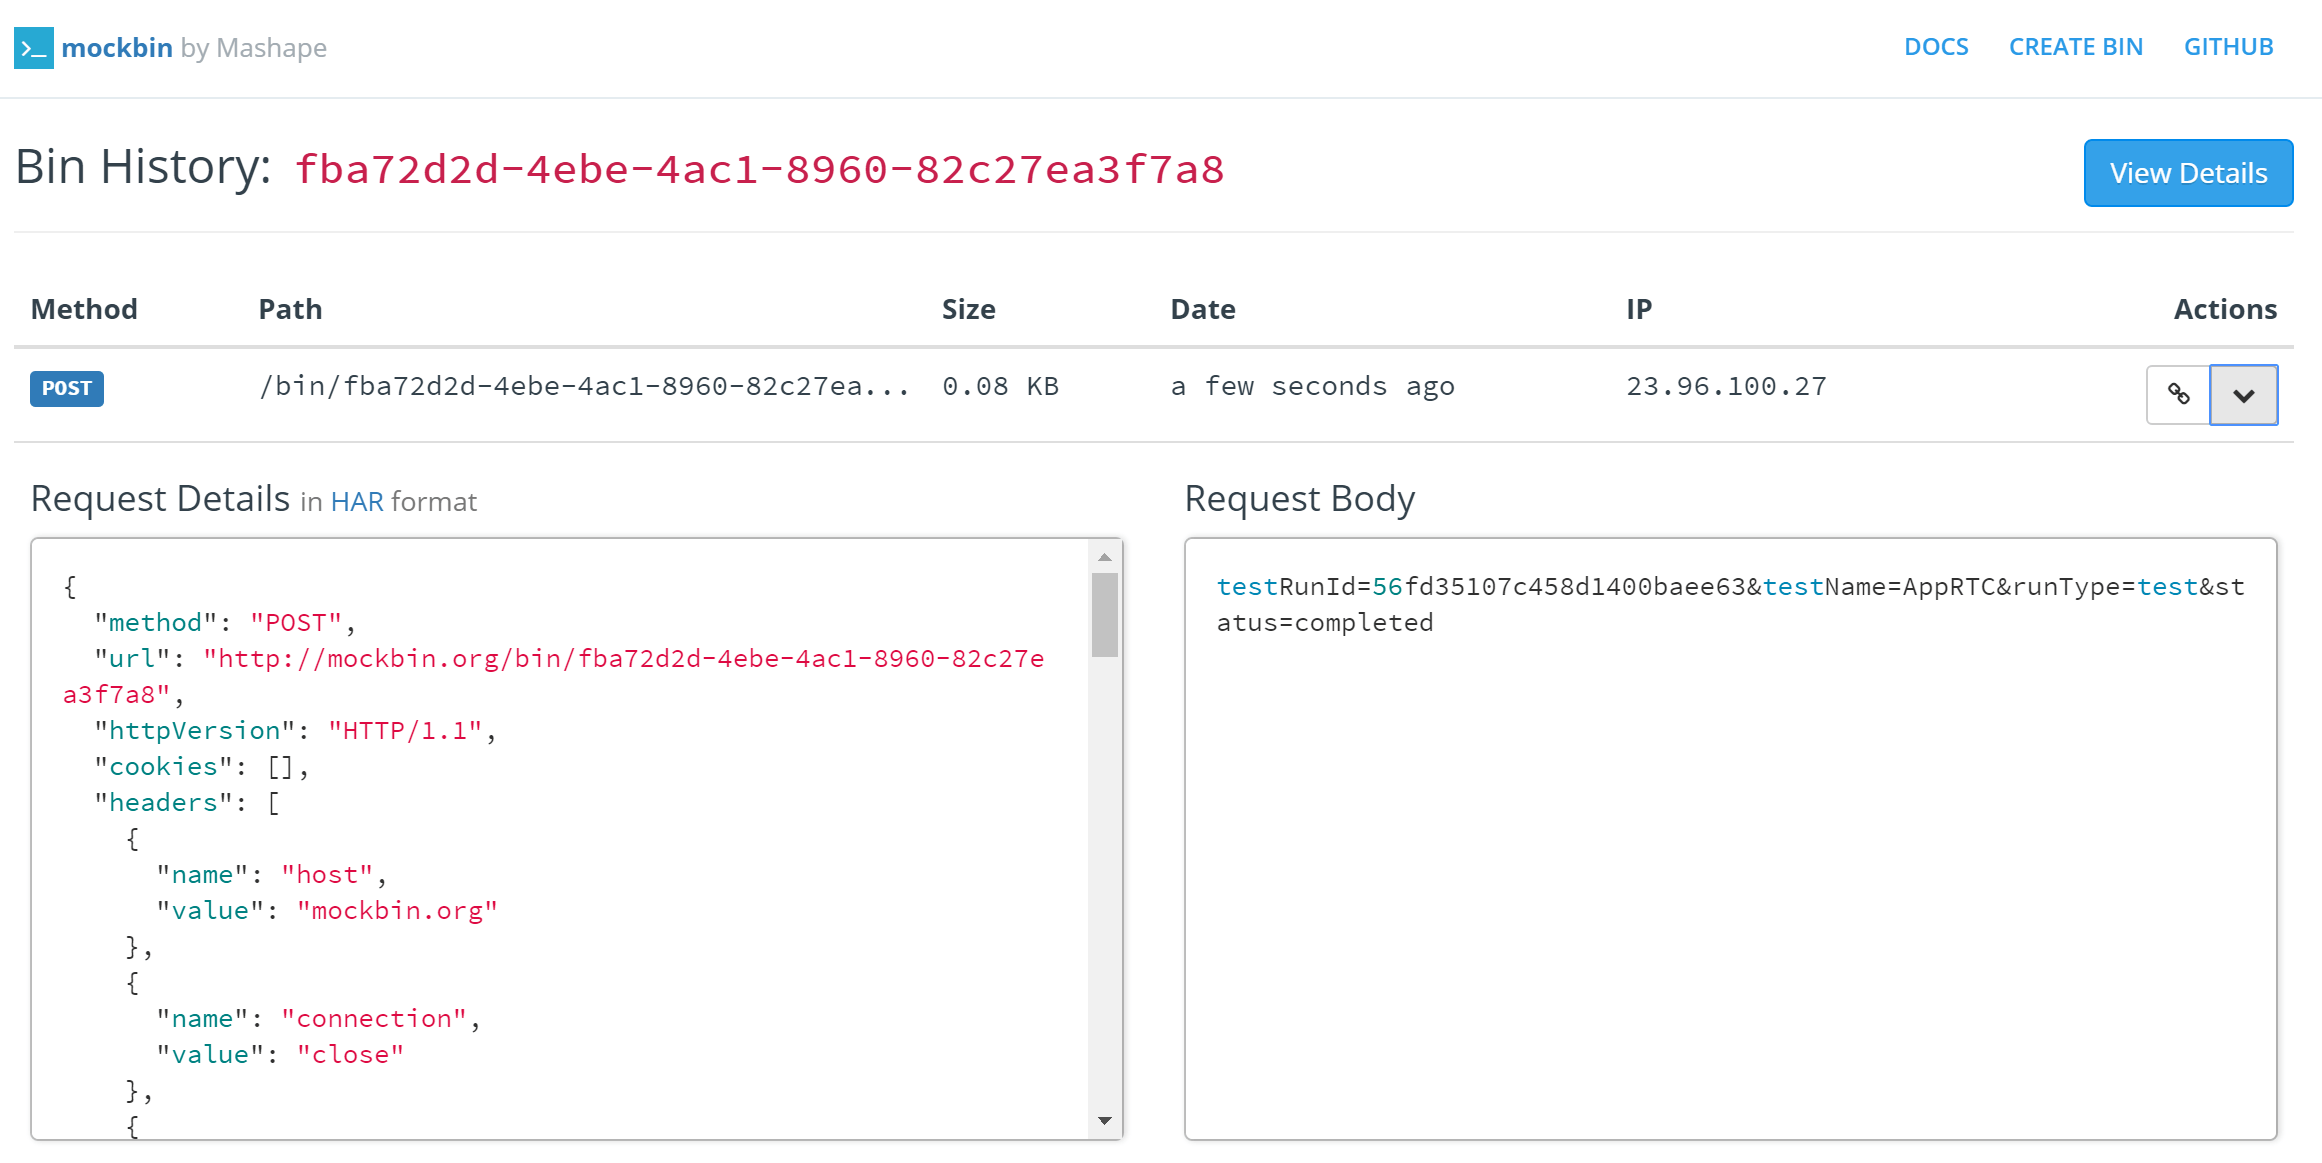
Successful test executiontestRunId=56fd35107c458d1400baee63&testName=AppRTC&runType=test&status=completed
Failed test executiontestRunId=56fd3d617c458d1400baee6f&testName=AppRTC&runType=test&status=failure

To view an example webhook using the above data, do the following:

  1. Generate a custom endpoint in Mockbin – in http://mockbin.org/ click on ‘Create Bin’
  2. In the ‘Bin Builder’ page, leave all suggested default parameters and just click on ‘Create Bin’ at the bottom-right area of the page.
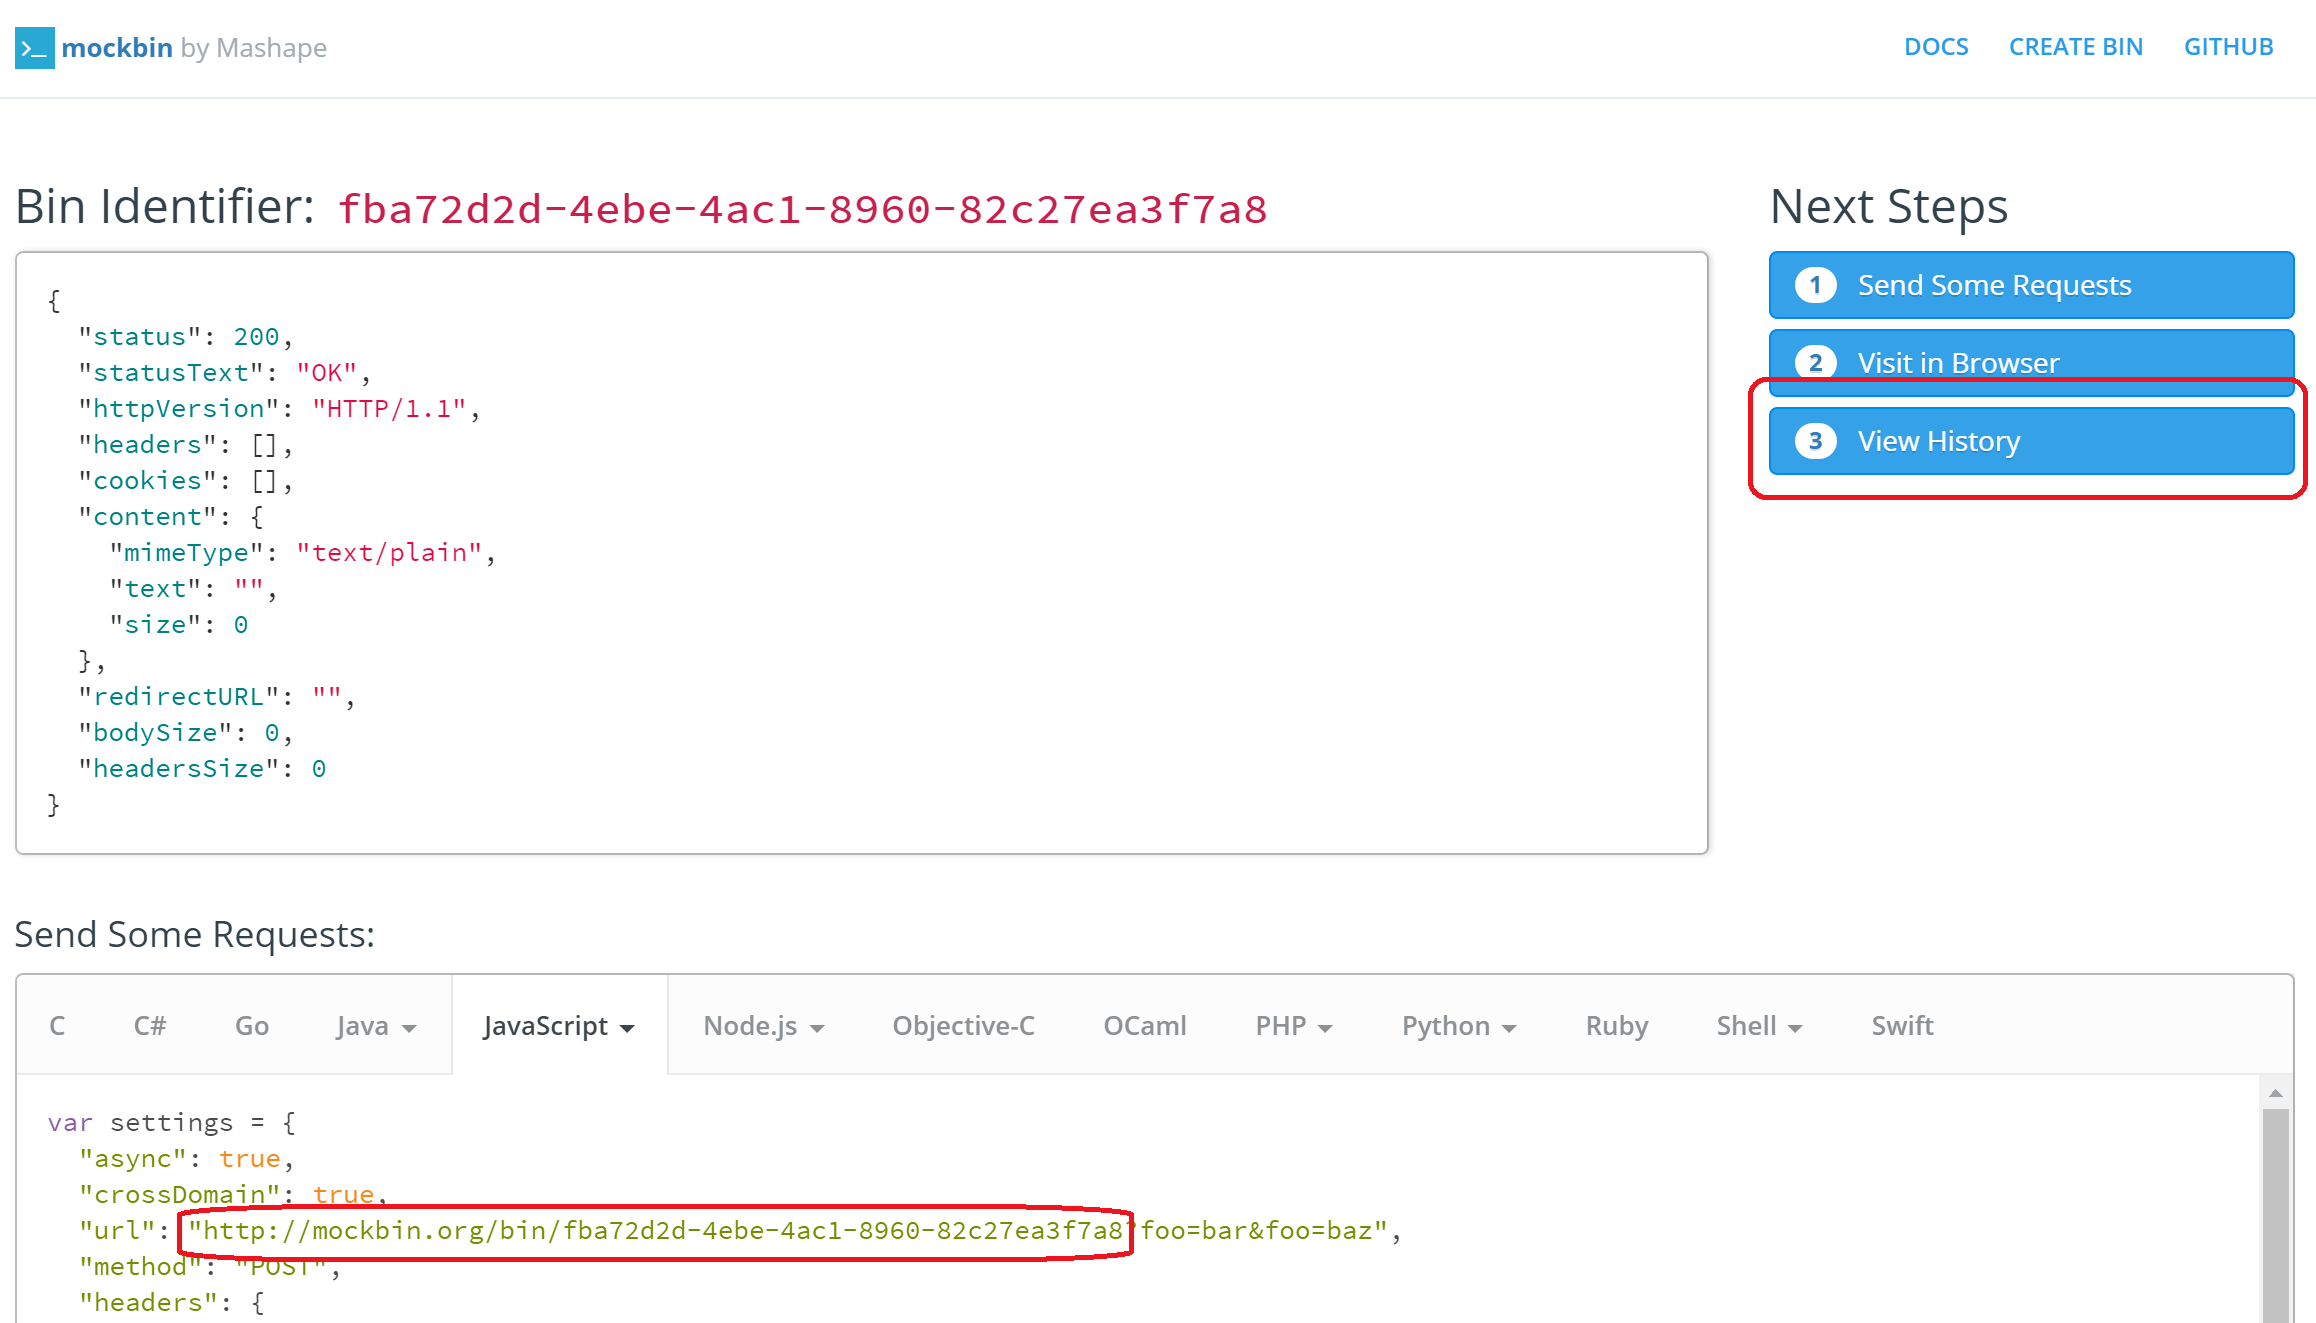
  3. In the next page your temporary created Bin Identifier will be presented. Your URL should be http://mockbin.org/bin/[Bin Identifier] You can generate this URL yourself or copy it from the code samples at the bottom of the ‘Bin Identifier’ page.
    • Note: If you copy the URL from the codesample, you should take off the URL parameters at the end of the URL (remove “?foo=bar&foo=baz”)
  4. Add the URL to your test – in the test configuration page under Webhook (for example):
    http://mockbin.org/bin/5b76146c-37da-40ef-bf01-89043b0d6a75
  5. Click on ‘View History’ to go to the Mockbin Bin History page
  6. Run the test
  7. After the test was ended refresh the Mockbin Bin History page
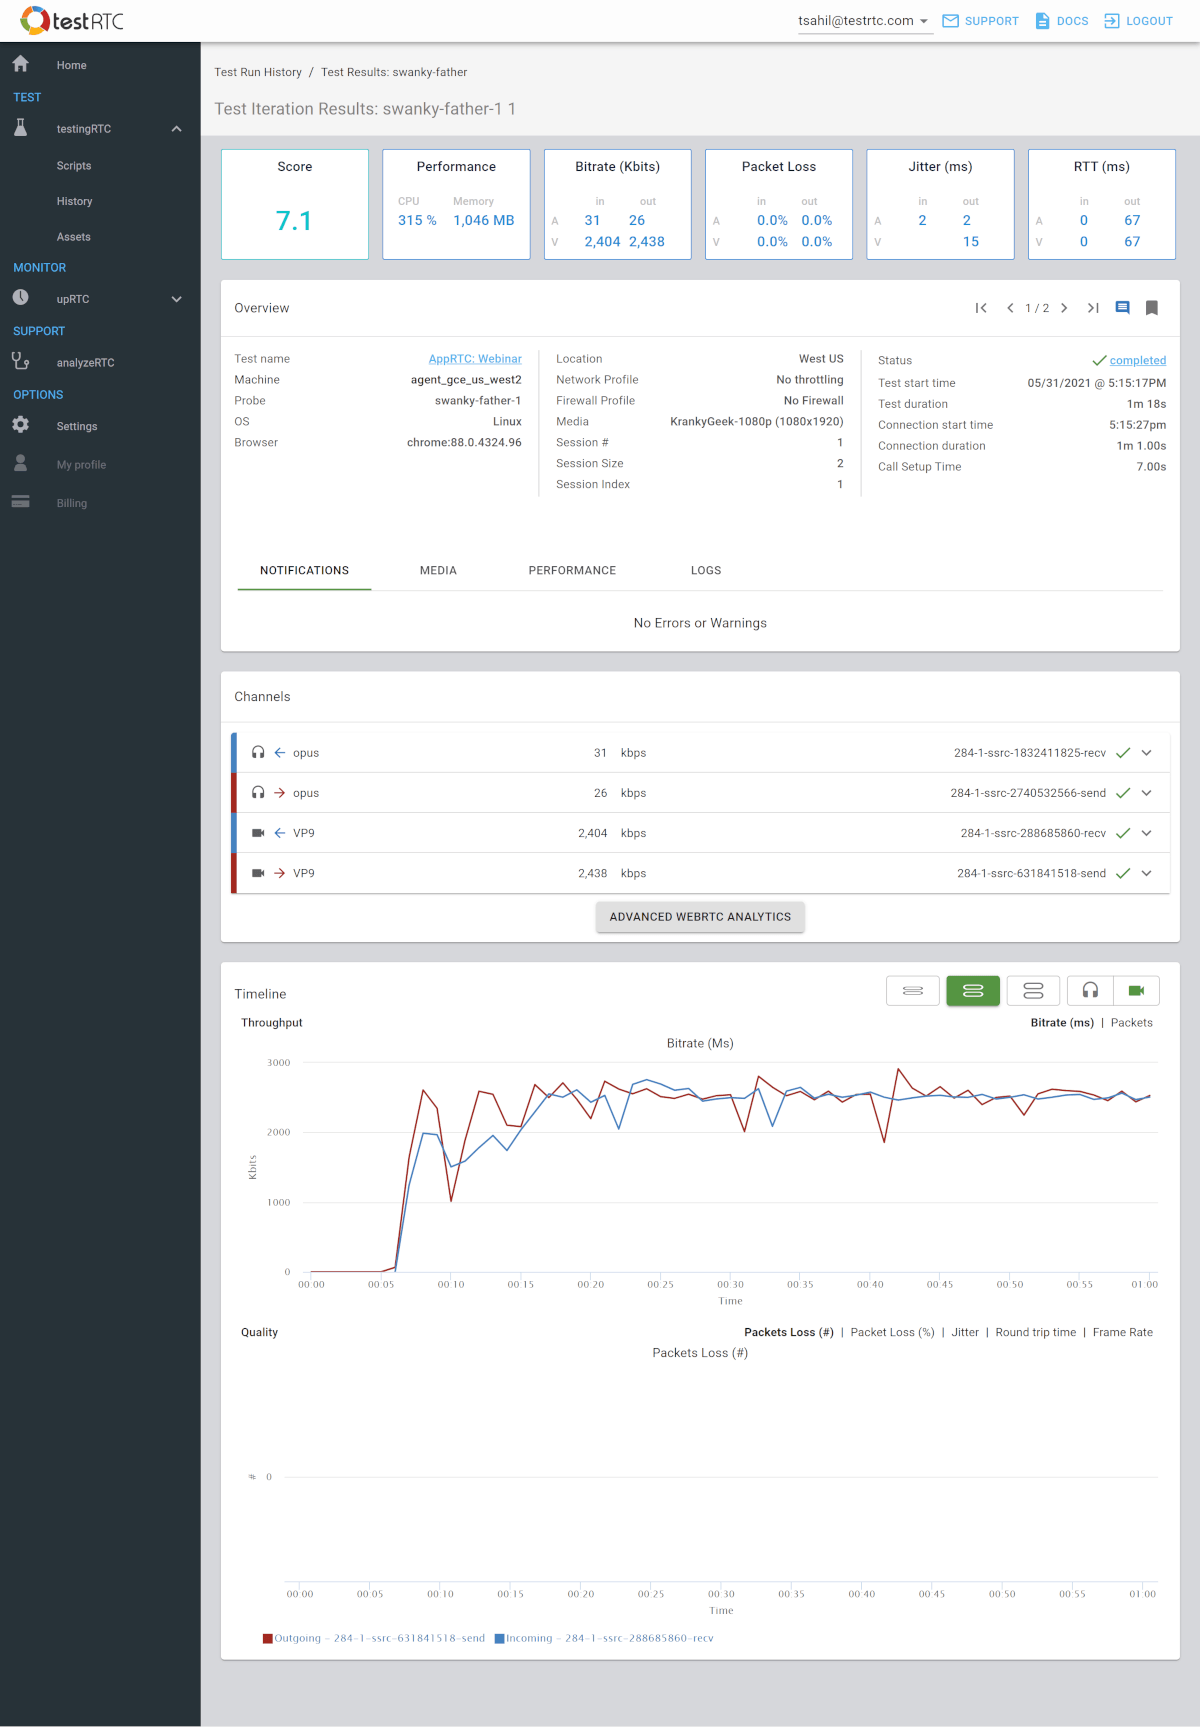
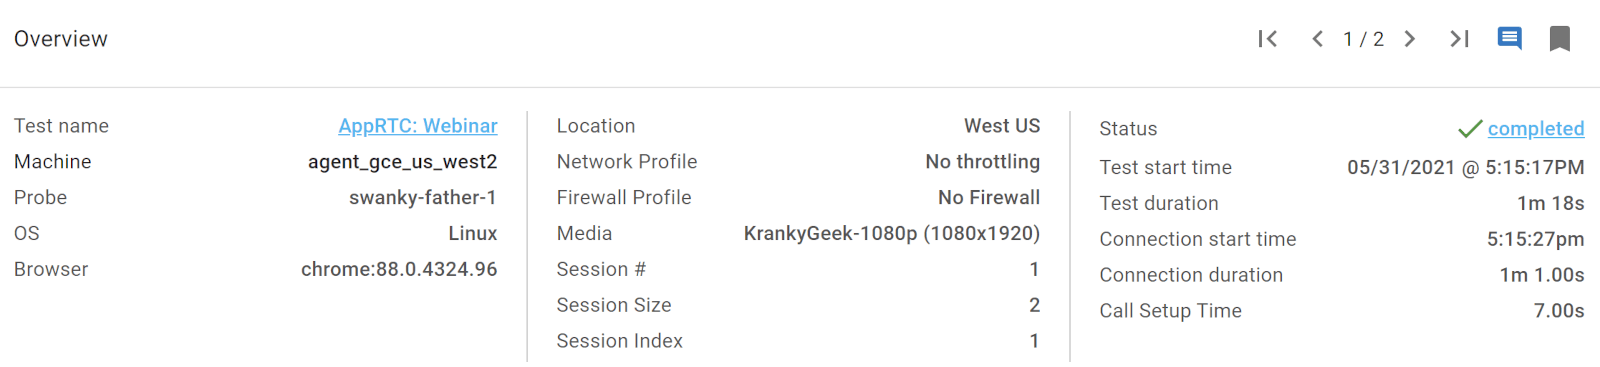
  8. You should find a new entry in the history. Click on the new entry history entry to see the request details and body:

Advanced

The advanced Webhook definition supports a complete JSON data like:

{"url": "http://mockbin.org/bin/4cb03fa6-d1aa-4533-a857-11d90293a4e8", "headers": {"custom-webhook-header": "web-testrtc-webhook"}}

If a webhook exists for a given executed test or monitor, testRTC manager will call that webhook after the execution of the test with the following information:

  • Type (monitor | test)
  • Test name
  • Test run ID
  • Execution status

For further information about the JSON data format and available parameters, please refer to https://github.com/request/request


Related information


Debug my script

The following working methodologies can be used in order to debug a test:

  • VNC – you can open a VNC connection to the tested instance and track the test’s progress. For further information about how to use VNC, please refer to Using VNC
  • Analyze browser logs – in the test’s results, ‘Single session results’ page, analyze the tested instance’s browser logs

Understand the test result’s ‘call setup time’ value

The call setup time is one of the test report quality measurements designed to show the time it took to connect the sessions.

Depending on what service you are running in testRTC, you will see the call setup time information in different places:

  • testingRTC and upRTC now show call setup time in the overview section
  • watchRTC shows the call setup time at the top ribbon section

This value represents the time in millisecond it takes for WebRTC to connect a session. We define that time from the moment the first setLocalDescription() WebRTC API call is called and until the first onconnectionstatechange(connected) is received. This calculation tries to eliminate user decision making processes such as allowing access to camera or microphone or the need for a user to click in order to answer or join a session.

The number is measured in milliseconds and should usually be below 400 milliseconds. Higher than that, and you might have a problem lurking somewhere in your application.

Verify page content

Verify text

client.getText('#element', function(result) {
    // Remove whitespaces - recommended, as many times the text in the 
    // web page includes whitespaces before and after the text
    var subResult = result.value.replace(/\s+/g, '');
    var subExpected = expected_element.replace(/\s+/g, '');
    client
        .info('Verify string (without whitespaces) result = %s, expected = %s',
            subResult, subExpected)
        .verify.equal(subResult, subExpected);
})Code language: JavaScript (javascript)

Do some actions if the element exists (without giving error)

client.element('param 1', 'param 2', function(visible) {
    if (visible.status !== null) {
        client.rtcInfo('element is visible');
    } else {
        client.rtcInfo('element is NOT visible')
    }
})Code language: JavaScript (javascript)

param 1 – locator strategy. Can be one of the following values: class name, css selector, id, name, link text, partial link text, tag name, xpath

param 2 – locator to search for

Examples

Search for element by id:

.element('id', 'user_email_id', function(visible)Code language: JavaScript (javascript)

Search for element by class name:

.element('class name', 'user_email_class', function(visible)Code language: JavaScript (javascript)

Switching windows and tabs

Switch to another window

In some cases, the tested application will open a new window. For example, there are cases where the user should sign-in using an external service such as Google or Facebook sign in. External sign-in is usually performed in a separate pop-up window.

The following sample code performs the following flow:

  1. Switch to another window
  2. Enter user’s credentials
  3. Return to the original window

Window ID

Please note that in all tests, window 0 is sometimes used for the WebRTC media collection. Since we don’t want to to dabble or think about it too much, we’ve introduced process.env.RTC_EXTRA_TABS environment variable. Use it when handling your windows:

You should assume that the base window ID is Number(process.env.RTC_EXTRA_TABS) and the pop-up window ID is going to be 1+Number(process.env.RTC_EXTRA_TABS).

client
  // Click on the sign-in button
  .click('#sign-in')
  .pause(1000)

  // Switch to the new window to sign in
  .windowHandles(function(result) {
    var newWindow;
    newWindow = result.value[1+Number(process.env.RTC_EXTRA_TABS)];
    this.switchWindow(newWindow);
  });

client
  .setValue("#Email", ['my email',client.Keys.ENTER])
  .setValue("#Passwd", ['my pass',client.Keys.ENTER])

  .pause(1000)

  // Switch back to the base window
  .windowHandles(function(result) {
    var newWindow;
    newWindow = result.value[Number(process.env.RTC_EXTRA_TABS)];
    this.switchWindow(newWindow);
  });Code language: JavaScript (javascript)

Ensure you perform actions in the correct window

When you click inside a popup window (for example Facebook login window) and the window is closed, every command you run next is addressed to the closed window until you call this.switchWindow() to switch back to active tab.

Please note that any action that you will try to perform before you switch back to active tab, such as a click or taking a screenshot, will fail and the test may fail with it.

Open a new tab

client.execute(function(urlToOpen){
  window.open(urlToOpen);
}, [url]);Code language: JavaScript (javascript)

Switch to next tab

.execute('document.getElementsByTagName("body").sendKeys(Keys.CONTROL, Keys.PAGE_DOWN)')Code language: JavaScript (javascript)

Open a tab per “call”

For voice calls, you may be able to squeeze more sessions to a single probe by using multiple tabs. Here’s a bit of code to get you started:

var tab = 0;
var tabs = 4; // the number of tabs you want to use
var url = process.env.RTC_SERVICE_URL;

for (tab = 0; tab < tabs-1; tab++) {
    client
        .rtcInfo('Before switch to' + tab)
        .execute("window.open('" + url + "', '_blank')")
        .pause(2 * sec)
        .windowHandles(function(tab) {
            return function (result) {
                var newWindow;
                newWindow = result.value[tab + Number(process.env.RTC_EXTRA_TABS)];
                this.switchWindow(newWindow);
            }
        } (tab));
    client.rtcInfo('Tab Opened ' + tab);

    // The code to start you call inside that tab should go here
}
Code language: JavaScript (javascript)

Working with elements in frames

You can indicate the frame by the frame name of frame ID.

// Access second frame (frame ID 1) in the page
client.execute('document.getElementsByTagName("iframe")[1].contentWindow.document.getElementById("button").click()');Code language: JavaScript (javascript)

By default, an access to an element in the first frame in the page (frame ID 0) is supported without any need to indicate the frame, so you may try to access elements in the first frame without the need to indicate the frame first.

upRTC Monitoring

By using the testRTC monitoring service you can monitor the true availability of your production service at all times and to track and compare your application’s actual quality of service in different times and from different locations. When there is an active monitor, testRTC will run the monitor’s predefined tests on a periodic basis.

Configuring a monitor

In order to configure a monitor, click on the ‘Monitoring’ menu item in the left menu bar and in the monitoring page click on the ‘Create new monitor’ button.

In the ‘Monitor configuration’ page, please configure the following properties:

  • Execute Test Namechoose one of the defined tests in your account. The test selected will also act as the name of the monitor
  • Description – textual description of the monitor
  • Frequency – choose one of the following monitor execution frequencies:
    • Run once a day
    • Run every hour
    • Run every 15 minutes
  • Alarm If – choose one or more of the following alerting possibilities:
    • Test Failed – situations such as no media in session. It is possible to define test’s success or failure inside the test script by using the rtcSetTestExpectation command
    • Warnings in monitor run results – situations where a monitor run completes but warnings were collected

Monitor alerts will be sent by email to the email address defined in for the testRTC account.

It is possible to:

  • Define additional email addresses to receive the alerts. Please contact us to configure this option
  • Receive the alert using a software API that can be integrated to different services such as your company’s monitoring service. Please contact us to configure this option, or read more about it here

Enabling and Disabling a monitor

When creating a new monitor and clicking on the ‘Save’ button, the monitor will be created in the active state.

When editing an existing monitor and clicking on the ‘Save’ button, the monitor’s state will remain as was before editing its properties.

In the Monitoring page, you can change the monitor’s state between ‘on’ and ‘off’ by clicking on the monitor’s toggle.

Monitor Run History

The ‘Monitor Run History’ page will list all executed monitors and the monitors’ execution results.

It is possible to click on every monitor entry to see the detailed monitor execution results.

Monitors’ scheduling

The testRTC monitoring manager will execute the active monitors, based on the monitors’ define frequency. Note that the monitor execution timing accuracy is not committed – testRTC’s monitoring service may execute the active monitors few minutes before or after the monitor’s planned time.

Monitors retry mechanism

In order to ensure the highest quality of the testRTC monitoring service, we monitor our monitoring service. In case that we encounter a problem in the way we executed a monitor, a retry mechanism will be activated and the monitor will run again immediately.

In the case of a failure of the monitor execution due to any problem in the service failure, the monitor will alert about the failure and will not retry.

Test Iteration Results Page

The Test Iteration Results page presents a single session results page (single session is defined as a single machine that executes a single iteration). This page offers rich and extensive set of graphs and KPIs (Key Performance Indicators) about the session’s streams. In addition, this page enables deep understanding of your application behavior and can help you debug it.

The Test Iteration Results page is composed of the following sections:

Session Summary Dashboard

The Session Summary Dashboard presents the following session’s main quality measurements:

  • Score – the score calculated for this probe in the test. You can learn more about our WebRTC scoring algorithm
  • Performance – the probe machine performance. This can give you an indication about CPU and memory utilization of your web application
  • Bitrate – average bitrate in the test, split to voice and video, incoming and outgoing
  • Packet Loss – average packet loss in the test, split to voice and video, incoming and outgoing
  • Jitter – average jitter in the test, split to voice and video, incoming and outgoing. Note that incoming video jitter isn’t reported since Chrome doesn’t report it
  • RTT – average round trip time in the test, split to voice and video. Note that usually you will have only the outgoing information available (that’s where calculation of RTT takes place)

Overview – Session Results Overview

This section presents session’s basic information such as session start time, duration, probe location and browser version.

It presents also session’s custom metrics values, if defined. For further information about test custom metrics, please refer to Custom metrics commands.

The Session Results Overview section presents additional information in the following tabs:

  • Notifications – list of errors and warnings encountered during the session execution. These errors and warnings are collected from the channels’ collected statistics, the browser’s console logs and Nightwatch logs.
  • Media – includes the screenshots that were taken during the session execution and other media files if collected (such as a failure screenshot taken automatically whenever possible)
  • Performance – collected performance graphs of the machine running the probe. These include CPU, memory and network metrics
  • Logs – includes the browser’s console log, WebRTC internals dump, statistics, the script executed and other files if collected.

Channels –  Channels’ details

The channels details section includes all audio and video channels used in the WebRTC session. For every session, a session header will be presented with the following details:

  1. Channel type – Audio or video
  2. Channel direction – In or Out
  3. Codec used
  4. Average bitrate
  5. Channel ID
  6. Status – Successful, Warnings or Failed channel

By clicking on the channel’s header, the channel details section will be opened / closed. The channel details section includes bandwidth, packets, jitter and round trip detailed information.

At the end of the channels section, you can click the Advanced WebRTC Analytics button to get even further drill down details of the session.

Timeline – Audio and Video charts

The audio and video charts provide detailed QoS information about all WebRTC channels in the session.

In the audio and video charts, the charts’ start time is the time when the first WebRTC channel was created.

In these powerful timeline view you can:

  • Switch between voice and video
  • Compare bitrate/packets versus packet loss, jitter, round trip time and frame rate graphs
  • Filter out incoming and outgoing channels as you see fit
  • Zoom in to smaller time frames
  • Increase and decrease height of the graphs

Test Results Page

After a test is ended, the test results page is automatically loaded. It is also possible to reach this page by clicking on the ‘Test Run History’ menu item at the left side menu bar.

The test results page is composed of the following sections:

Results Ribbon

The Results Ribbon presents the test’s main quality measurements, providing a snapshot view of them:

  • Score – the average score given for the media quality across all probes in the test run. For further information, check our test scoring system
  • Call Setup Time – the average (for all sessions in the test) time in seconds it takes for each WebRTC channel in the session to exceed 50% of the channel’s average bit-rate. For further information, refer to Understand the test result’s ‘call setup time’ value
  • Bitrate (Kbits) – the average (of all sessions in the test) effective bitrate, split between voice and video as well as incoming and outgoing directions
  • Packet Loss – the average (of all sessions in the test) packet loss percentage, split between voice and video as well as incoming and outgoing directions
  • Jitter (ms) – the average (of all sessions in the test) jitter, split between voice and video as well as incoming and outgoing directions

These metrics can give you an immediate high level understanding of the media metrics of a test result.

Test Result Overview

This section presents test’s basic information such as test start time, duration and total incoming and outgoing data.

You can mark and comment this test results by using the icons at the top right corner of this section.

This section presents also a test’s custom metrics, if defined. For further information about test custom metrics, please refer to Custom metrics commands.

Aggregation Charts

The aggregation charts offer a powerful analysis tool that enables you to quickly figure out the results in a test run, especially in bigger tests.

The tabs at the top offers different views towards the data:

  1. BY TIME/PROBE – the graphs here calculate the average metric values for the media by first summing the channel metrics on the probe level and then averaging them across all the probes in the test over the test’s duration
  2. BY TIME/CHANNEL – the graphs here calculate the average metric values for the media by averaging the channel metrics on the probe level and then averaging them across all the probes in the test over the test’s duration
  3. BY PROBE – the graphs here show the average metric values calculated for each probe separately over time, showing the results in a bars graph where each bar denotes a specific probe in the test

In each view, you can use the VIDEO and VOICE buttons to toggle between metrics related to video and voice channels.

The dropdown gives you the ability to select the metric to view – Bitrate, Jitter, Packets loss and Packets.

The legend below the table enables you to toggle on and off the various metrics displayed:

  • Incoming and Outgoing represent the metric values for the incoming and outgoing channels
  • min/max band shows the range of values that were found at that given point in time. This can be used to understand the variance across the probes in the test, hinting instabilities in performance of media servers
  • Call end shows up as a vertical line that indicates when the first probe ended and left the test
  • Any global events will appear on this graph as well

The video below explains how you can use these charts when analyzing your test results:

Test Sessions / Probes

The ‘Test Sessions / Probes’ table lists the probes used in the test.

Each line in this table represents a probe in the test. If there is a large number of probes used, they will be paginated for easy browsing.

For each probe, you will be able to see its configuration as well as the media score that was calculated to it, along with the status of the test results for that probe. The background colors denote different sessions/rooms in the test.

Clicking a row on this table will drill down and open the results for that probe in the test.

You can use the EXPORT button to export the metrics information of the probes in the test as a .csv file.

1 26 27 28 29 30 32