testRTC allows you to share key/value pairs between the probes in the same test run. This script command together with .rtcWaitForTestValue() can be used for such information sharing and for synchronization across probes.
Within a test run, one probe will call .rtcSetTestValue(). This will generate a key/value pair that will be stored in a shared memory across all probes in the test run. The other probes can then call .rtcWaitForTestValue() with the same key parameter to retrieve the value.
Arguments
Name
Type
Description
key
string
The key to share across probes in the test run
value
string
The value to set for the key
Code example
The code below makes all probes in the test run to wait until the first probe in the test gets to a certain point in the script. If the value isn’t received within 30 seconds, the other probes will fail the test.
var idx = Number(process.env.RTC_AGENT_NUM);
if (idx === 1)
{
client
// Probe 1 sends a message
.rtcSetTestValue("start", "Ready");
}
else
{
client
// Other probes receive the message
.rtcWaitForTestValue('start', function (value) {}, 30000);
}Code language:JavaScript(javascript)
Notes
If you plan on running multiple sessions in parallel where each needs to synchronize separately (like multiple rooms running in parallel in a large stress test), then you should use .rtcSetSessionValue() instead
This method is useful for:
Synchronizing probes to start after a given point in time, such as having the students join a session after the teacher logs in, or dial a call after the other user becomes available
Send information that is needed, such as the URL or session ID that is created ad hoc by one probe that is needed for the other probes in order to join the same session
testRTC allows you to share key/value pairs between the probes that are part of the same session. This script command together with .rtcSetSessionValue() can be used for such information sharing and for synchronization across probes.
This script command will wait until the requested key is received in the session. The callback function will be invoked and its a single parameter will hold the value provided in the call to .rtcSetSessionValue() by another probe. If the time indicated passes without receiving the value, this command will fail.
testRTC allows you to share key/value pairs between the probes that are part of the same session. This script command together with .rtcWaitForSessionValue() can be used for such information sharing and for synchronization across probes.
Within a session of a test run, one probe will call .rtcSetSessionValue(). This will generate a key/value pair that will be stored in a shared memory across all probes in the same session. The other probes can then call .rtcWaitForSessionValue() with the same key parameter to retrieve the value.
Arguments
Name
Type
Description
key
string
The key to share across probes in the same session
value
string
The value to set for the key
Code example
The code below makes all probes in the session to wait until the probe with index value 1 within the session group (the first probe) gets to a certain point in the script. If the value isn’t received within 30 seconds, the other probes in the session will fail the test.
var idx = Number(process.env.RTC_IN_SESSION_ID);
if (idx === 1)
{
client
// Probe 1 sends a message
.rtcSetSessionValue("readyToReceiveCalls", "Ready");
}
else
{
client
// Other probes receive the message
.rtcWaitForSessionValue('readyToReceiveCalls', function (value) {}, 30000);
}Code language:JavaScript(javascript)
Notes
This method is useful for:
Synchronizing probes to start after a given point in time, such as having the students join a session after the teacher logs in, or dial a call after the other user becomes available
Send information that is needed, such as the URL or session ID that is created ad hoc by one probe that is needed for the other probes in order to join the same session
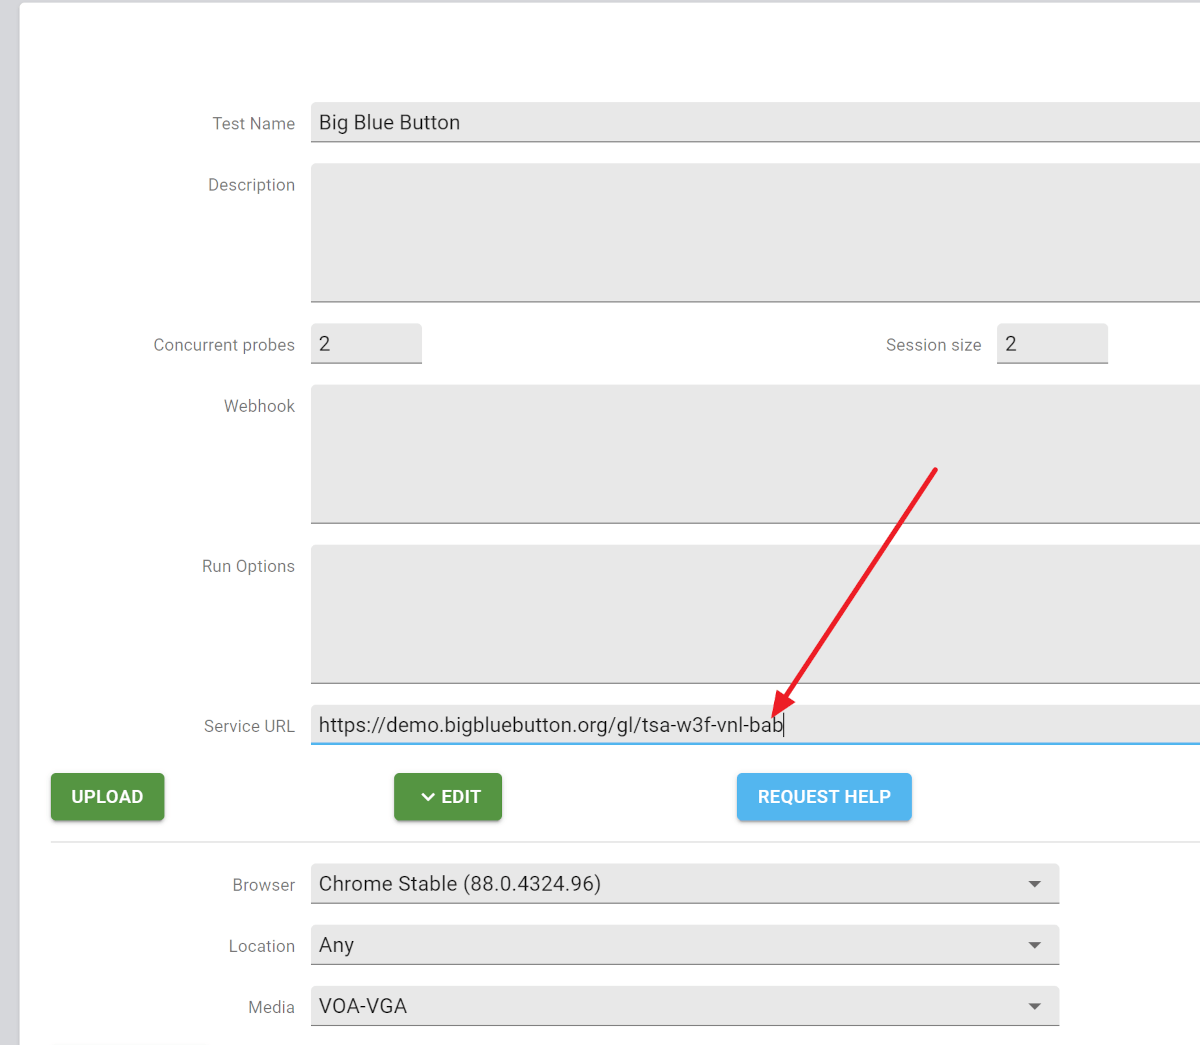
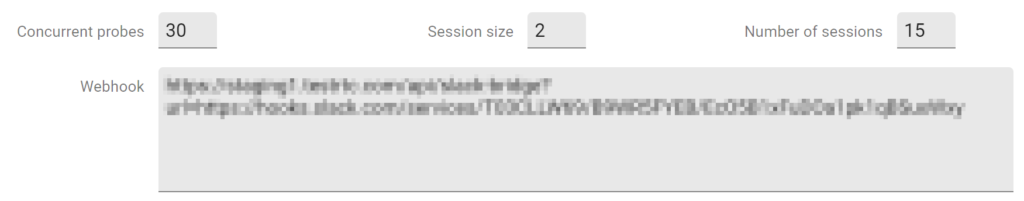
.rtcSetSessionValue() has no real use if the Session size you configure for the test is set to 1. You will find the Session Size of your script in the script editor itself:
This script command waits until the requested external value is received or a specified timeout is reached.
If the external event is received, then the callback function provided shall be invoked and the value passed as its single parameter will hold the external value itself.
The example above waits to receive an external value with the key email2fa and then prints out its value to the log. If the key isn’t received within 60 seconds, the test will fail.
Notes
This method is useful in handling external inputs that are required for your test script to run successfully, such as the ability to parse an email or an SMS message for a 2FA value
How do you compare the performance of 2 or more WebRTC services? How about comparing the performance of your service to itself over time, or on different configurations? We’ve added the tooling to answer this question to testRTC.
Vonage approached us with an interesting request a few months back. They wanted to validate and compare the performance of the Vonage Video API to that of other leading vendors in the video CPaaS domain.
We couldn’t refuse the challenge:
testRTC was already collecting all the metrics
Our focus is on providing stable and reproducible results
So it was fairly obvious that this is something within our comfort zone
What we were missing were a few APIs and mechanisms in our platform to be able to collect the information programmatically, to reduce the time it took to analyze the results for the needs of conducting comparisons.
Designing performance testing for WebRTC
We sat down with the Vonage team, thinking together on the best approach to conduct this analysis. The end result were these general requirements:
Be able to compare a scenario across different video API vendors
Support multiple scenarios
Make sure to include stable network, dynamic network changes, different screen sharing content
Different group sizes
With that in mind, there were a few things that were needed to be done on our end:
Create the initial sample applications to use during the tests
Write test scripts in testRTC in a generic manner, to be able to conduct a standardized comparison
Develop simple CLI scripts to run the whole test batch across the use cases and vendor implementations
Add the necessary means to easily compare the results (=export metrics easily and programmatically to a CSV file)
Along the way, we’ve added a few features to testRTC, so now everyone can do this independently for his own service and infrastructure.
You will find a lot more details about what scenarios we picked and the metrics we decided to look at more closely in the whitepaper itself.
The new toys in our WebRTC toolset
If you are interested in the main features we’ve used and added to enable such comparative analysis of WebRTC services, then here’s what I found useful during this project we did:
Machine metrics data collection. We had that data visualized but never collected as numeric values. Now that we have, it is useful for objective comparisons of test results
Added a new script command that can calculate the time from an event that occurs until a given WebRTC metric value is reached. For example, checking how long it takes for the bitrate to reach a certain value after we’ve removed a network limit
When retrieving the result status from a test run results, we now provide more metrics information such as bitrate, packet loss, CPU use, custom metric values, etc. This can then be collected as WebRTC performance KPIs
Executing tests via the APIs can now also control the number of probes to allocate for the test. We used this to use the same script and run it multiple times, each with a different number of browser in the call scenario
Script to run scripts. We’ve taken the Python script that Gustavo Garvia of Epic Games used in our webinar some two years back. At the time, he used it to invoke tests sequentially in testRTC from a Jenkins job. We modified it to generate a CSV file with the KPIs we were after, and to pass the number of probes for each test as well as additional custom variables. This enables us to write a single test script per vendor and use it for multiple scenarios and tests
Assuming such benchmarking is important to you and your application, let us know and we’ll help you out in setting it up.
What I learned about comparing WebRTC applications
This has been an interesting project for us at testRTC.
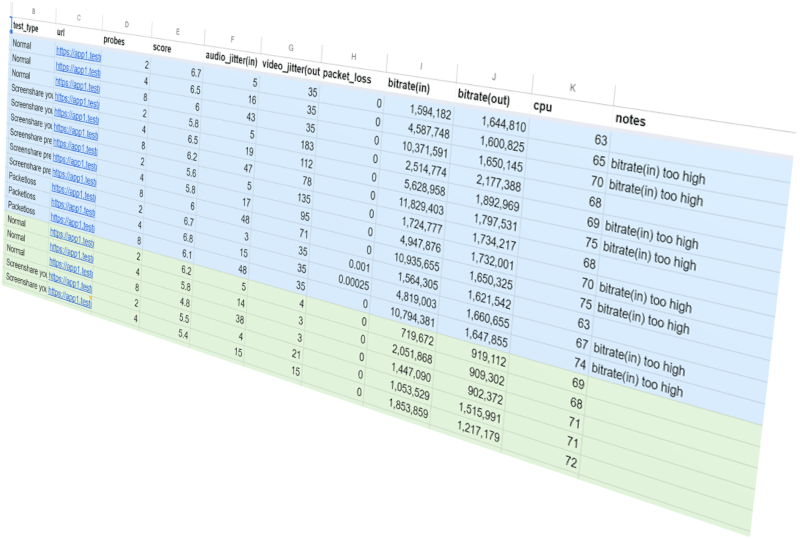
Comparing different vendors is never easy, and in WebRTC, where every feature can be implemented in various ways, this becomes even trickier. The ability to define and control the various conditions across the vendors and use cases made this simpler to deal with, and the fact that we could collect it all to a CSV file, converted to a Google Sheet and from there to graphs and insights was powerful.
Getting a group video call to work fine is a challenging task but a known one. Getting it to work well in varying conditions is a lot harder – and that’s where the differences between the vendors are more noticeable.
Performance Whitepaper: A comparative analysis of Vonage Video API
The last few months have been eye opening. We looked at the various scenarios, user behavior and network shaping issues that occur in real life and mapped them into test scripts. We then executed it all multiple times and analyzed the results. We did so on 3 different vendors – Vonage and two of its competitors.
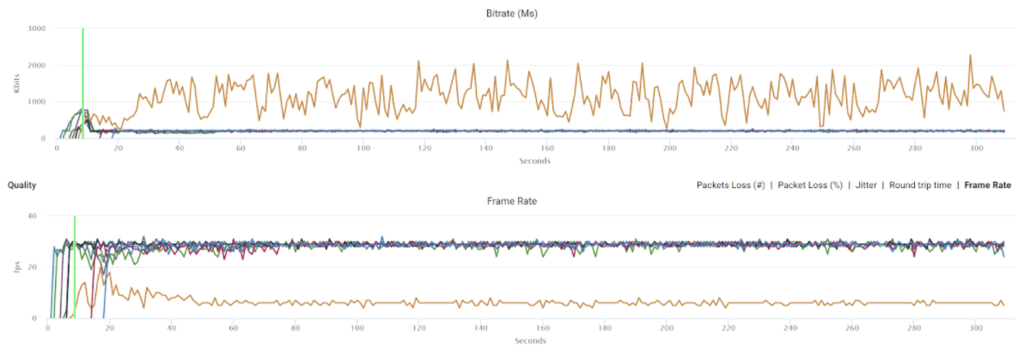
Seeing how each platform decides to work with simulcast, how they behave to adding more users to a group call, and how they operate in various use cases has shown us how different these implementations are.
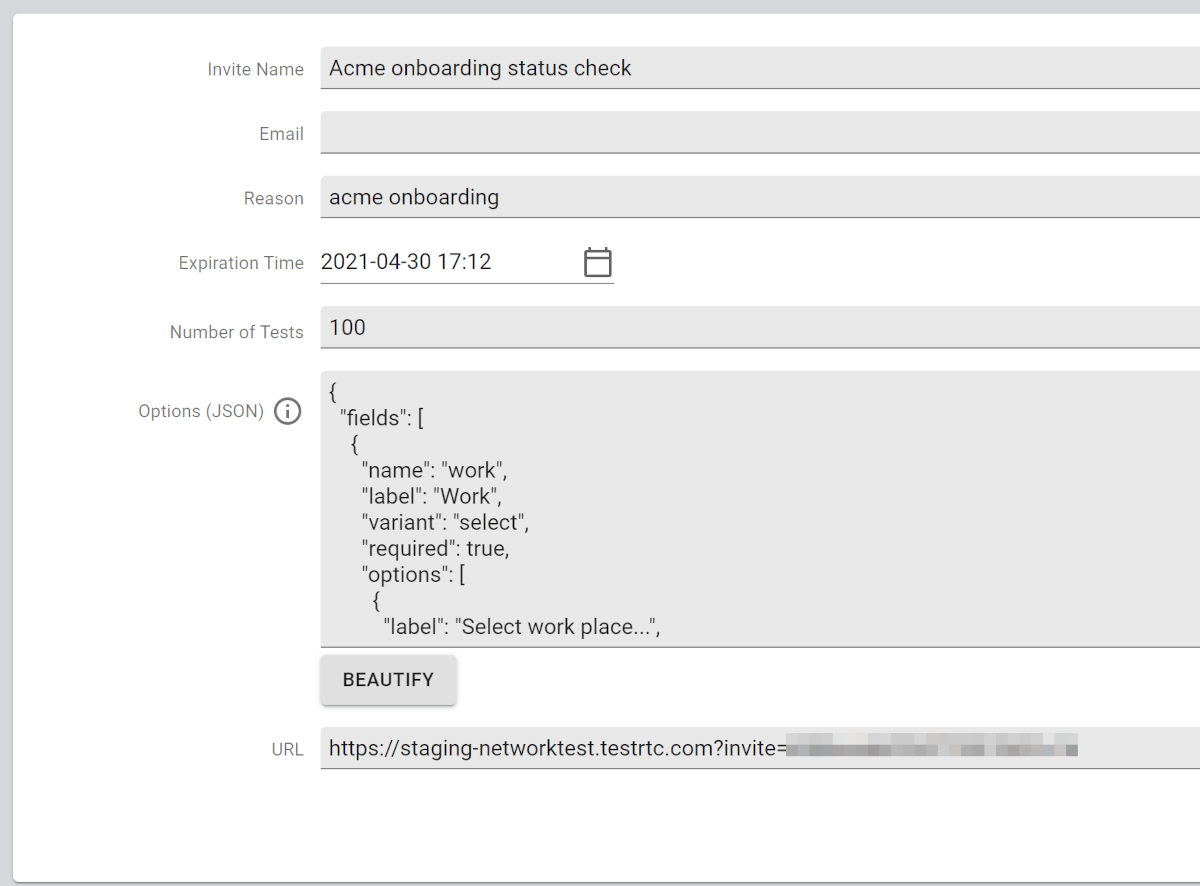
When generating a qualityRTC invite, you can have query parameters included such as region or account. You can also use these invites to add any additional fields you might need.
This is something you can configure using the Options JSON field of the invite:
You can place in the options either the fields or the queryParams or both as needed.
Adding optional fields
You can add custom optional fields to the network test which the user will need to fill in. This is useful if you’d like to collect additional information about the user, such as the location of the test (home or office), network type, etc.
The fields will be placed in the log and in the webhook.
The options now include an array of selection alternatives.
Each selection has a label and a value. The label is displayed to the user while the value is what will be placed in the log and the webhook if this option is selected.
You can add a first selection with a value of “none” which will place the label as an instruction to the user.
Conducting a WebRTC test is challenging, but the devil is in the details. testRTC’s cloud WebRTC testing and validation platform that scales with ease.
Testing WebRTC applications is challenging. From simple 1:1, through figuring out how to optimize for large group video calls to live broadcasts to thousands of participants or more; what you will immediately notice is the need for simple and powerful automation. Unlike other web technologies, WebRTC brings with it three unique characteristics:
WebRTC is a resource hog. This translates into complexities in allocating resources when conducting large scale tests
Highly interactive. A scenario involving multiple people requires multiple people, making scaling tests with a single human tester virtually impossible
Deciding success or failure using common web metrics is useless. WebRTC comes with its own set of metrics that needs to be gathered and analyzed
With the increasing demand of remote communications and collaboration, the use of WebRTC has significantly grown and skyrocketed. From a niche technology it is now mission critical for many organizations and people around the world.
testRTC has identified this need in 2015, investing in the creation of a self service, best in class platform for testing WebRTC at scale and on demand.
WebRTC testing is part web part VoIP in nature. On the one hand, you need to test a web-based application. On the other hand, you need to test a VoIP service.
This intersection of worlds brings with it a need to use innovative testing techniques that merge the best of both worlds.
As with any other kind of software testing, you will need to adopt the use of both manual and automated testing.
Manual testing offers the flexibility and intelligence of humans. This makes a lot of sense in WebRTC application augmen testing, simply because humans are the ones that directly interact with the service being tested autm. With manual testing it is important to use tools that enable us to easily collect and analyze WebRTC metrics. These speed up the testing process as well as make it more effective.
Automated testing offers the power of speeding up the testing process considerably and to evaluate scenarios that are impossible to achieve with manual testing, such as instantiating and validating hundreds or thousands of participants in a session. Without the use of automated testing, you end up relying mostly on your users to tell you what is broken with your application.
How to test WebRTC?
You can conduct WebRTC tests manually or in an automated fashion. In both approaches, there are a lot of moving parts you need to take into account.
Device resources
The most obvious aspect of testing WebRTC is the client side. WebRTC runs on various browsers and devices. Depending on your application, you will need to write down the list of combinations of devices your users might be using and focus on testing on these devices.
On each device, make sure to look at the CPU and memory consumption of your WebRTC application in real life scenarios. This will give you an indication of how your users are going to experience your service.
When growing the number of participants in a single group video call for example, it is important to test these, since in many cases, that is where your bottleneck of scalability is going to be.
👉 Validate that you dynamically change your application’s behavior to cater for the many different devices and the available resources they have.
Server-side infrastructure
With WebRTC, there are different types of servers that are used: signaling servers, media servers and STUN/TURN servers.
You need to make sure to test how these servers operate under stress and over long periods of time, conducting soak tests. Make sure to test for CPS – how many “calls” per second your service can handle. In most cases, trying to connect 1,000 users to your service in the exact same second is going to fail.
Find out what is the breaking point of your infrastructure – it might be CPU utilization, but in many cases, it will be pure network traffic – the number of packets certain servers can process (see also our article: Network Jitter).
👉 Check out below how convenient stress testing can be:
Network conditions
Networks aren’t static. They vary and fluctuate over time. You can start a session with a great network with pristine conditions only to see it degrade a minute later.
Some of the tests you will need to conduct are in these areas exactly. Figuring out if your application can cope with the dynamic nature of the network. Here you should check how quickly your media servers return to high bitrate and high frame rate operation after having some rough time of low bitrate or high packet loss.
Check how does the media server cope with different types of networks – multiple users joining over different network conditions – does each get the treatment and video streams he needs or does the service degrade to lowest common denominator?
👉 Your WebRTC application may work great at peak network performance, but you need to make sure it operates well where packet losses and bandwidth restrictions are a fact of life.
User behavior
There are two aspects here.
The first one, is that no matter the amount of automation and sophistication you plan on using, human behavior with an interactive WebRTC service is going to surprise you. You will need real people to test your service. Sad but true.
That said, there are areas where human testers don’t cut it for your testing. Consider this: In a session of 10 users, each user enters the session at his own laisure. Usually not at exactly the same time. What happens when meetings are larger? Or when your service grows?
There will be times when multiple users will actually try to join simultaneously. At the same time. To the same session. Or to separate sessions.
Test and validate for that. WebRTC services that seem to work really well often break if 100 or more browsers are trying to connect to them at the exact same instance in time.
Tools for WebRTC testing
For the most part, you will need to use more than a single WebRTC testing tool to provide better coverage of the necessary tests.
When you decide on which WebRTC testing tool to use, take into consideration the following aspects of the tool:
#1 – WebRTC traffic generation
First and foremost, a WebRTC testing tool should be able to generate WebRTC traffic.
Since WebRTC relies on external signaling protocols, this can be tricky at times.
Make sure that your testing tool is:
Capable of supporting the signaling protocol you use for WebRTC
Generates traffic that is as close as possible to the way your application behaves. This usually boils down to a tool that automates a browser instead of generates its own synthetic, pre-encoded traffic
Simulates various network conditions, to be able to test your WebRTC media servers and TURN servers properly, and as close as possible to real-life conditions
Grows dynamically to meet your needs as the size of the tests grow on your end. Especially when you conduct sizing or stress testing
Up to date when it comes to its WebRTC implementation. WebRTC behavior gets updated once a month or two, with each browser version release. Your WebRTC traffic generation tool needs to keep pace with these changes
Generating traffic is where many of the WebRTC testing tools focus today. This is done in one of two main techniques:
Using browser automation, building on top of Selenium for example, and relying on the browsers to handle and manage all WebRTC traffic on its own
Creating synthetic, pre-encoded traffic (or just echoing back what is received). A technique that is used mostly in large scale tests where hundreds of thousands of streams need to be tested and it becomes too expensive to use browsers
#2 – Users simulation
When you generate WebRTC traffic, be sure to think about user behavior as well.
In many cases, WebRTC sessions aren’t symmetric: one user takes the role of a lecturer, while the others are students. In other cases, you may have a few speakers in a discussion that is being streamed to a larger audience.
The tool you use should be powerful enough to handle different roles in a test scenario. Even within a symmetric WebRTC group video call, you will want to test screen sharing, which means there is now a role of a presenter within that group.
Giving roles should be an available option not only in what the user “does”, but also in how the user’s “machine” behaves and of how data is analyzed.
👉 At testRTC we offer powerful role assignment and synchronization mechanisms across the users that join a test, making orchestrating scenarios simple to manage.
#3 – Data collection
Now that we’ve generated traffic in WebRTC, designated roles to the various streams, the time has come to collect the data.
With WebRTC, there are a lot of data points that can be useful:
Console logs
WebRTC internal dumps
WebRTC metrics
Machine performance statistics
Screenshots
…
The more the tool you use is capable of collecting, the higher the possibility that you will be able to pinpoint and troubleshoot potential problems faster.
👉 At testRTC we collect everything and anything that we believe is useful for your debugging and analysis of WebRTC sessions. This include all WebRTC API calls and metrics, as well as console logs, machine performance data, screenshots and even optional trace routes and network log files
#4 – Analysis and visualization of WebRTC metrics
Have you ever tried looking at a webrtc-internals dump file?
This file is the first line of defence developers have in their bug squashing efforts with WebRTC. And yet, reading it is challenging.
Make sure the tool you use makes a better job of analyzing and visualizing WebRTC metrics. Things to look for in a WebRTC testing tool:
Collect and visualize webrtc-internals dumps
Ability to collect WebRTC metrics and analyze them without webtrc-internals (they aren’t always available)
Aggregate as well as drill down analysis of data from large number of users
Mechanisms to pinpoint outliers and failed streams easily
Define failure criteria to figure out easily pass/fail status of your tests
Drill down capabilities, going from a high level view down to the minute details of the results captured
👉 The more data at your disposal, the better suited you will be to debug and solve issues, but the harder it will be to read and analyze the results without a testing tool’s guidance.
#5 – Level of maintenance
As stated earlier, WebRTC is a work in progress. It is always changing.
Be sure that the WebRTC testing tool you use is well maintained and gets frequently updated and upgraded.
Today’s requirements are vastly different than last year’s requirements, as we are working with a technology that is currently in high demand with a lot of market focus and competition.
Things to consider when it comes to the maintenance work necessary for a WebRTC testing environment:
Upgrading browsers frequently
Dealing with browser automation tools upgrades (they should be aligned with the browser releases)
WebRTC depracations, changes and additions
👉 With testRTC these are things you won’t need to be dealing with, as it is part of our job to stay up to date with the most recent developments of WebRTC technology.
Types of WebRTC tests
When conducting tests of WebRTC applications, there are certain areas we need to be aware of – certain test types we should consider covering in our test plan. Here are the major areas.
End-to-end WebRTC testing
In most cases, you won’t need to test the WebRTC implementation itself. That’s up to the browser vendors to handle, along with their own WebRTC interoperability testing.
If you are using third party media servers or a CPaaS vendor, then you may or may not find focusing on testing that layer important to you. I find that different vendors and individuals have different opinions here.
What you should do is make sure to do end-to-end testing. Such tests encompass your whole application logic, and your focus there should be in validating the intersection points between WebRTC and the application logic.
P2P testing
If your application supports peer-to-peer, then there are no media servers to contend with. It makes some of the tests simpler to manage and conduct.
Things to validate with P2P:
Sizing and stress for your TURN servers and signaling servers
Different firewall configurations
For mesh based group scenarios (if you do them), you’ll want to invest a lot of time on testing, polishing and optimizing the experience
Call center WebRTC testing
Call centers require special care and attention when it comes to WebRTC testing. There are many reasons for this:
One leg of the calls reside in WebRTC while the other in PSTN or SIP
Stress testing is prime focus, as call centers already operate at scale and just need to validate that WebRTC doesn’t mess things up. This is doubly true for those who transcode Opus to G.711 or G.729 in the process
Stress testing for WebRTC
An important aspect of testing in WebRTC is stress testing. This is done to figure out the answer to one of the following 3 questions:
How much load can my server handle? This question is asked mainly about media servers and TURN servers
Does my load balancer work properly? This is the second order question, as many services require to load balance across multiple media servers
Can my application handle X users/rooms/sessions in parallel? This goes to check the service as a whole
Depending on how you operate your service and its scale, you will be asking one or more of these questions.
If you are interested to learn more on how our clients use our service, read these case studies:
A big chunk of what vendors do with WebRTC is group calls. Be it video or voice only calls, these are quite challenging to test. Getting enough real people to join a group call to be able to test it takes time and synchronization, and then being able to figure out and troubleshoot issues is close to impossible – especially when you can’t really know what is the quality of the network or the device the users have.
When dealing with WebRTC group calls, you will need to work hard on optimizing for the size of the group you wish to support – be it 10 users, 49 users in a gallery view, 100 users or larger groups.
Towards that goal, you need to use automation tools capable of the following:
Stable and predictable machines and networks to run with
Configurable networks, to test in varying conditions, dynamically controllable by you
Detailed visual analysis of the results, to ease your understanding of the test results
Test users coming in from different locations
Live broadcast testing
With live broadcasts you have a small number of broadcasters (publishers) and a larger number of viewers (subscribers). The challenge with many solutions is that they don’t offer video transcoding in the cloud and even if they do, you need to validate that it is being used properly.
In such a case, the following types of tests are necessary:
Stress the media servers at scale, with many viewers
Bring viewers from different geographies
Configure viewers with different network conditions
Dynamically change network conditions for some of the viewers
What you are looking for here is to understand the overall quality of the solution and to validate that viewers with poor connections don’t cause other viewers to have a poor experience as well.
Mobile testing for WebRTC
Mobile testing in WebRTC poses quite a challenge. The main problem here is the lack of proper automation – using cloud based solutions means that what’s in front of the mobile device’s camera is a static image at best or too dark to be useful. That’s because mobile devices are placed in racks inside data centers for this purpose.
You will be able to automate some of your testing, but the nuanced parts of media quality will be hard to achieve with automation.
There are 3 areas of testing you will need to handle:
Network. Understanding how mobile networks and devices affect your infrastructure. These types of tests can be simulated and automated without the use of actual mobile devices
Devices. Test against different devices and brands. Either through cloud automation or crowdsourced testing
Application. This can use cloud automation in the same way that other mobile applications use
Browser testing
Browser testing with WebRTC can either be done manually or automated locally.
There are 4 main browsers: Chrome, Safari, Firefox and Edge.
Many vendors resort to manual testing of the applications across browsers due to the frequent UI changes they are making or because of the complexity of automating testing of WebRTC across browsers. At testRTC, we offer automated testing for Chrome and Firefox at the moment – especially since our focus to date has been infrastructure testing.
Things to keep in mind while testing browsers:
Test multiple versions of each browser, as you will bump into them in the wild
Make sure to test in front of the beta releases to catch upcoming issues
Component testing
WebRTC has many moving parts: browsers, devices, application servers, web servers, TURN servers, media servers. And we haven’t even gotten to listing other infrastructure components such as databases and load balancers.
At times it is important to test each component separately. With WebRTC, that is mostly focused on TURN servers or media servers.
In such cases, you may even want to create simple dedicated web pages that can be used to test these components so as not to have to go through your whole application logic.
Advantages of WebRTC test automation
Testing WebRTC applications is different from testing other web applications:
WebRTC requires considerably more resources on the client and server side than most web applications
A WebRTC application is more sensitive and susceptible to network conditions and available device resources
In most WebRTC applications, there needs to be high synchronization of a test scenario across multiple devices and browsers
Metrics required to understand if a test is successful or not are very different in WebRTC than in other web applications
Relying on manual testing means that a lot of the predictability and observability of the tests conducted is lost. Automation of WebRTC tests, if done correctly and with the appropriate tools can greatly enhance the stability of your application.
Designing WebRTC tests that scale
There are several things you need to take care of when designing your application for WebRTC tests that scale. If you don’t do them early on, then adding them later can be challenging.
Here are some best practices for designing scale into your WebRTC automation testing:
Have the ability to configure test accounts for mock users with no captcha, OTP or 2FA on them. These are challenging to automate
Create scripts that can generate as many pre-configured test accounts as needed. Doing this manually is going to be daunting, time consuming and error prone
Prepare in advance an option to reduce the number of steps required in the UI to reach the media testing itself. Scheduling, form filling, and excessive selections and button clicking can all increase false positives in large stress tests for WebRTC
Design your test script to scale in 2 axis: number of total participants and number of participants in a single session. This will give you more flexibility in your testing
Have the ability to define different CPS (Calls Per Second) values, so that you can throttle and pace the entry of participants in large tests to fit your requirements
Make it easy to run stress tests. If it takes you more than a few minutes to prepare and start running for a large stress test then you are doing it wrong
Collect the metrics important to you from the test. You want to be able to understand the results quickly and be able to easily compare them with past test runs
testRTC service and how we can help
testRTC offers a self service platform for conducting WebRTC testing.
Our clients use us in a myriad of ways, anywhere from assisting them in manual testing, through continuous integration & regression testing up to large scale stress testing.
At the heart of the WebRTC testing service of testRTC there are 3 main technologies:
Geographically spread browser automation at scale
WebRTC metrics collection capabilities
Visual and programmable analysis of WebRTC test results
We are continuously investing in each of these areas to make sure our clients can efficiently create, run and analyse their test scenarios in the quickest and simplest way.
You can create an evaluation account and start testing your WebRTC application now:
WebRTC has grown in recent years from a niche technology to an important piece of the fabric of the internet and of our communication toolkit. If you are developing products with WebRTC, it is paramount that you treat it like the first class citizen that it is in your testing as well.
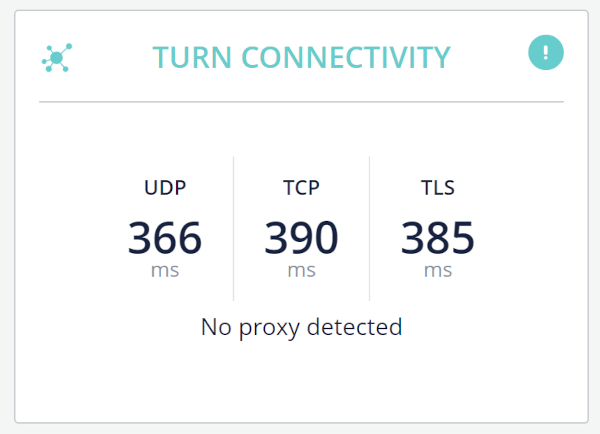
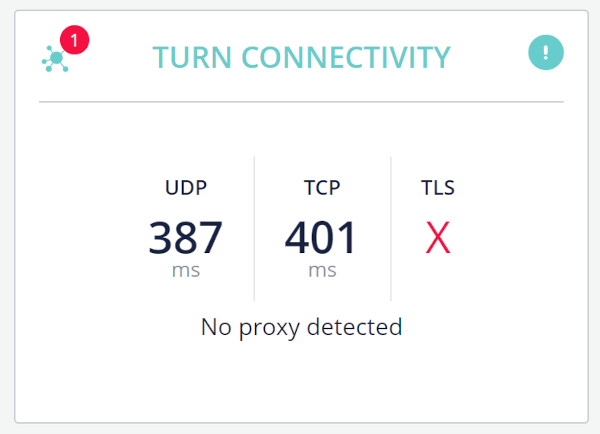
If you have a user running qualityRTC complaining that his sessions sometimes connect and sometimes doesn’t, and you get similar types of results in the TURN CONNECTIVITY tests of qualityRTC, then this might be due to a firewall configuration on the user’s side.
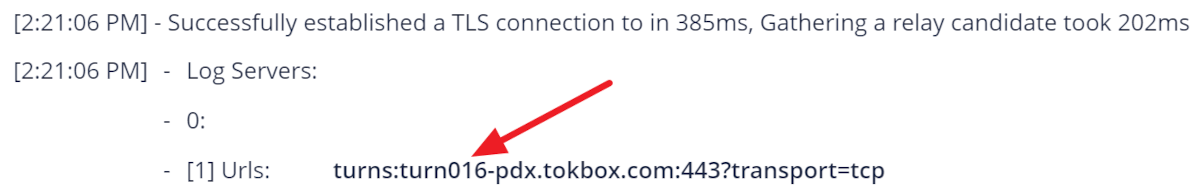
Here’s how a successful result might look like, along with the relevant log message for the TLS connection:
Here’s how a failed result might look like, along with the relevant log message for the TLS connection:
Why is that happening?
WebRTC is quite dynamic in nature. It uses multiple server types, multiple IP addresses, multiple ports and even runs over UDP, TCP and TLS – as needed.
This means that sometimes, sessions might get connected properly, while other times they might not.
In the example above, the TURN servers used are being allocated by the infrastructure vendor provide different TURN/TLS servers in each call. This means that each time, a different IP address is being connected to for the session.
Since sometimes it fails and sometimes it succeeds, it brings into suspicion the potential use of a firewall on the client side that is not configured properly.
What can you do?
The user conducting the tests should check if he has a firewall configured and turn it off (or fix its configuration).
We are asked from time to time if our platform can assist in catching lip sync issues, which are also known as A/V drift or other similar names.
The problem with lip sync testing is that it requires knowing the source media and being able to record, correlate and match it on the destination side. This is quite challenging with a generic platform like testRTC, especially when our control over what gets received is quite minimal:
The browsers themselves don’t match audio and video in the source properly with fake media. This causes an inherent lip sync issues with our own source media in some scenarios. This is because audio and video are “faked” separately, so if one is opened prior to the other they won’t be synchronized and even if they were, the browser may not view them as starting at the exact same point time
testRTC has no knowledge or understanding what the incoming media is and what source media this needs to be correlated with
Network conditions affect incoming media, changing its resolution, frame rate, etc.
Your application may process the media on the server side, changing it from the source and interrupting with lip syncing it programmatically
Due to the reasons above, we aren’t directly handling lip synchronization issues at testRTC. That said, there are several reasons for lip sync issues and A/V drifts to occur in WebRTC, which can be caught with testRTC: For the most part, A/V drift will occur not because the servers are “ruining” lip sync but rather because the resources on the client side can’t handle the load, so they throttle the incoming media and aren’t able to time the video with the voice.
To catch this on the client side, you can check certain elements in the testRTC results:
Look for the CPU load in the performance tab. Try keeping it below 90% at all times
The machines we provide operate on 2 cores by default, so if you are conducting a large video call, then you may hit CPU limits
In such cases, you can increase the core counts of your machines (ask our support for assistance)
Just be aware that many of your real users will have a similar experience, so our suggestion is to optimize for that type of machines as well
Check the jitter and latency
High jitter will result in bigger jitter buffers or lost packets, which may lead to loss of synchronization
High RTT (latency) may cause browsers to play back audio instead of waiting for the video to arrive
Look at the advanced WebRTC analytics
If the frames decoded is consistently lower than the frames received, then you may have a performance issue to deal with
If the time to decode a frame is higher than your frame rate (lets say 40 milliseconds on a 30 fps stream), then you will have a video drift issue
")