testRTC August 2021 Release Notes
testingRTC & upRTC
Analysis
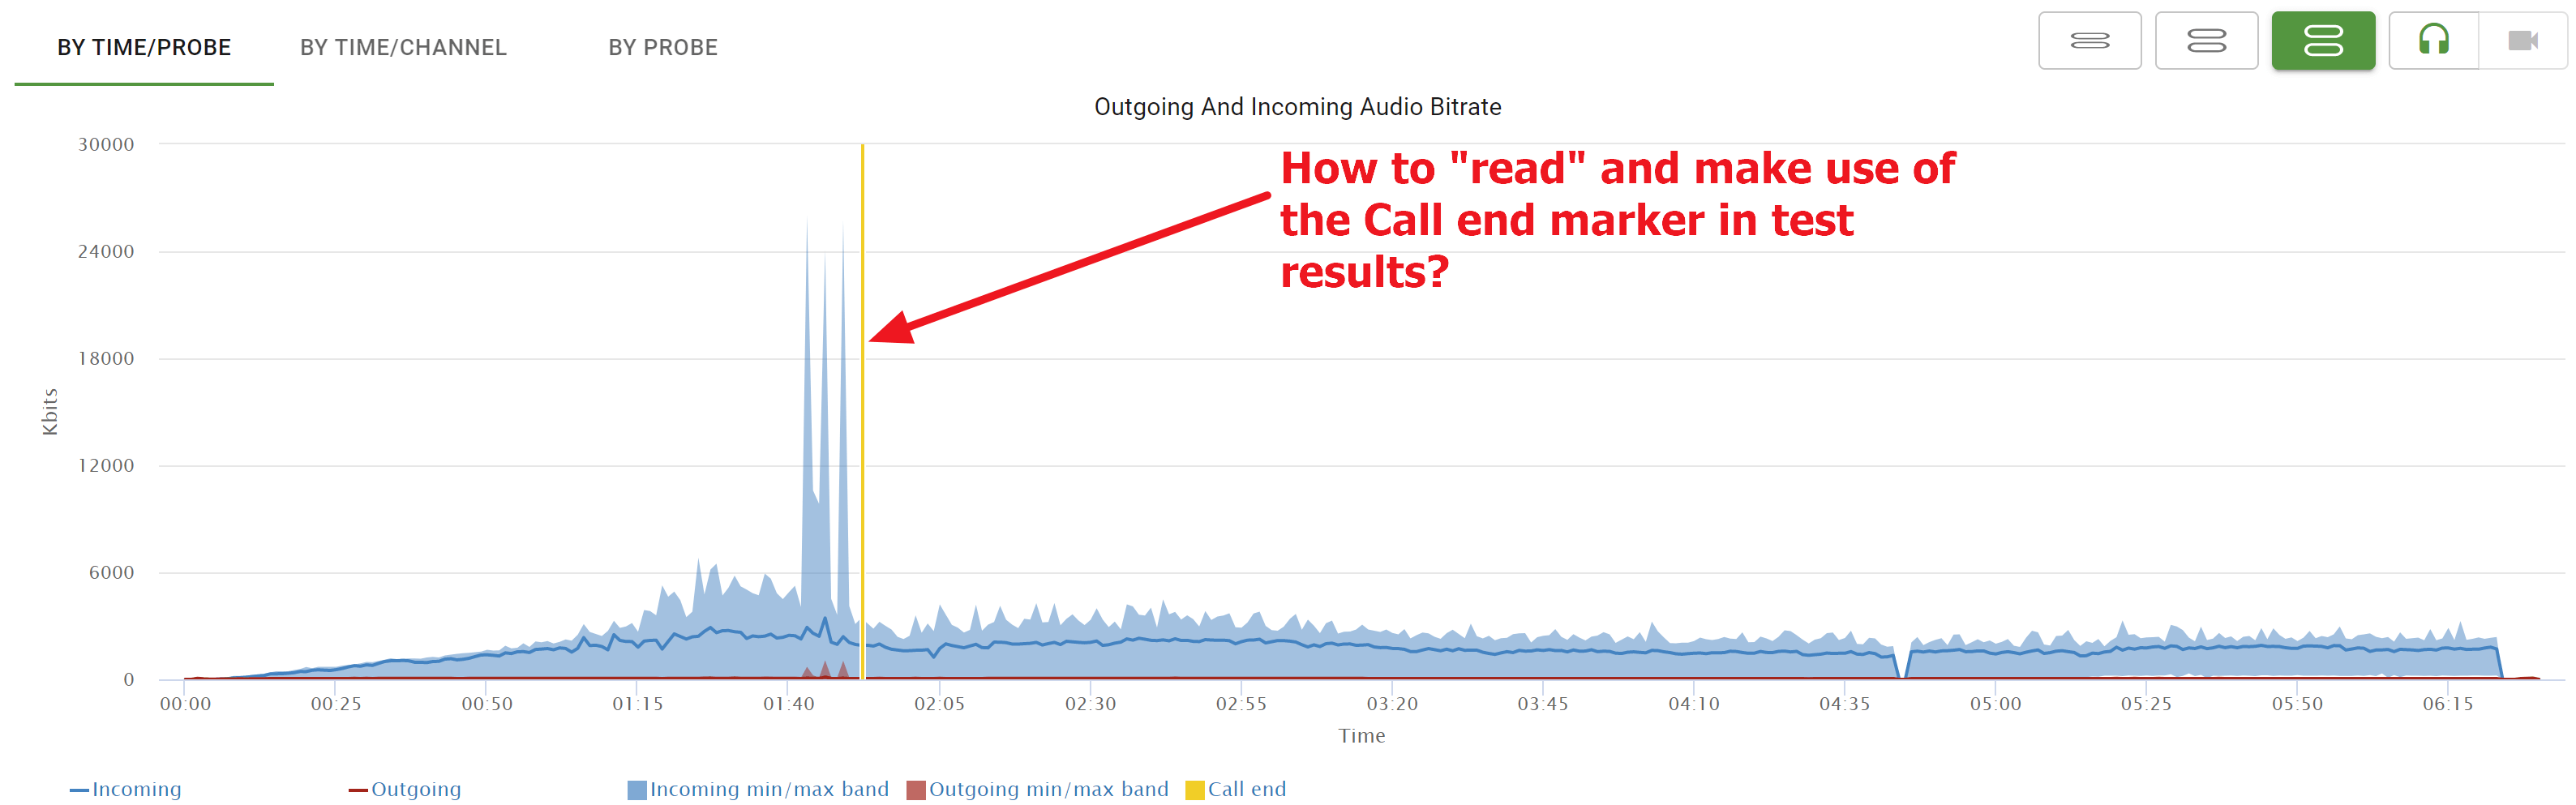
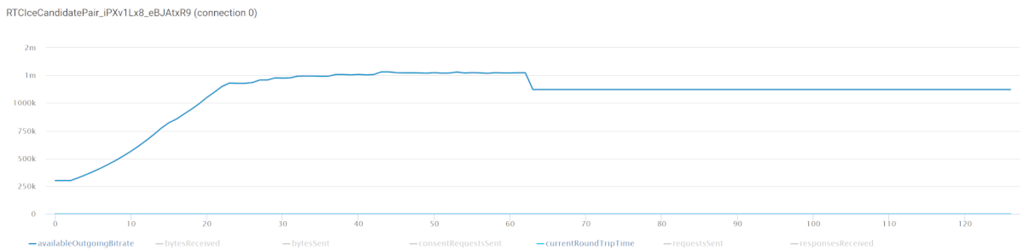
- High level charts of test results have been “modernized” to support our new charting scheme, where we show bitrates versus quality related metrics – same as we do on the probe level
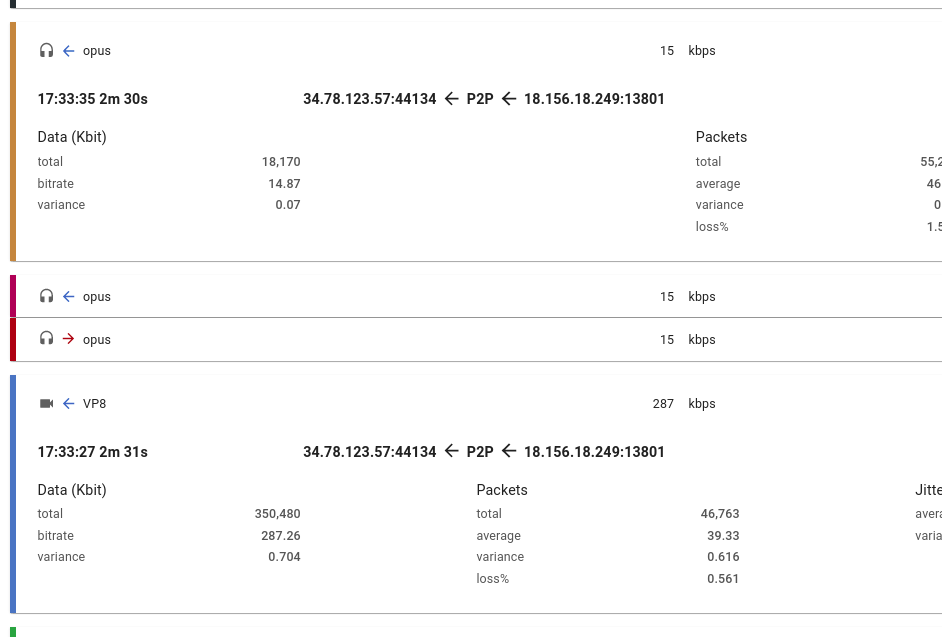
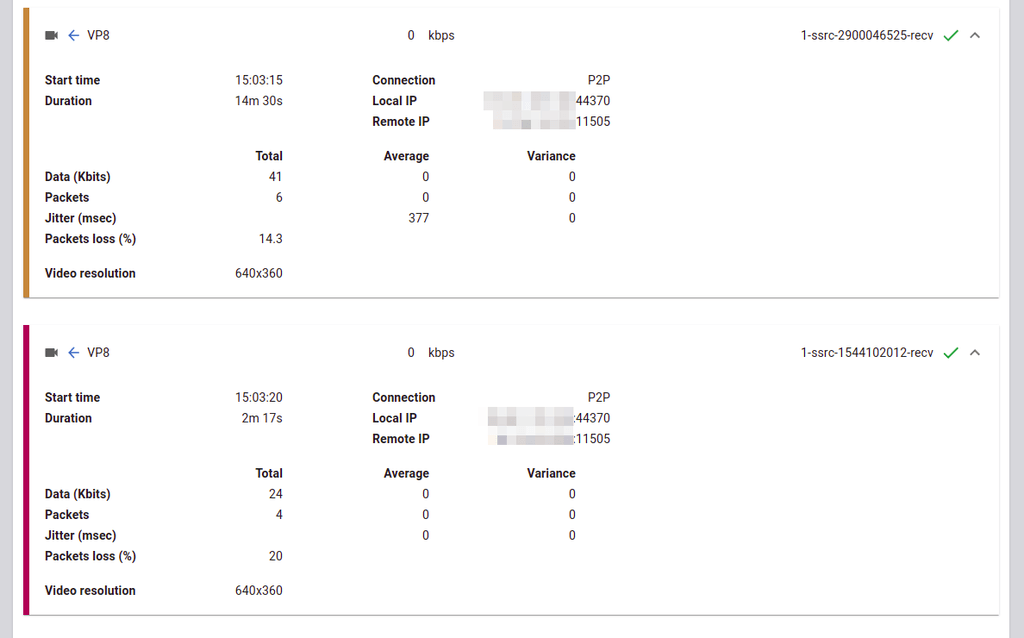
- We’ve revamped the channel view to make it easier to read. When you double click a channel – this is what you’re going to see now:
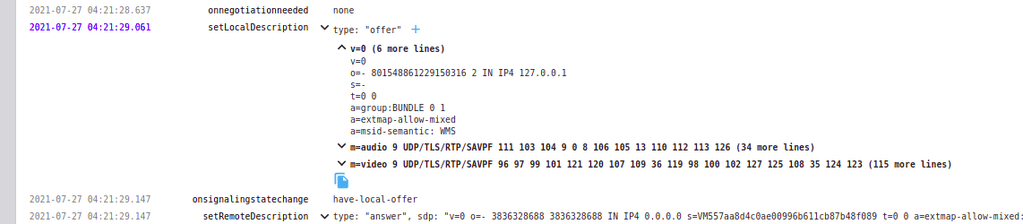
- Events log now parses SDP to make these messages easier to read
Nightwatch
We’ve upgraded the Nightwatch version used for scripting to the latest – 1.7.7.
This in turn, enables us to offer better scripting for your tests.
As a first step, you can now use the Nightwatch Testing Library for simpler DOM testing and manipulation.
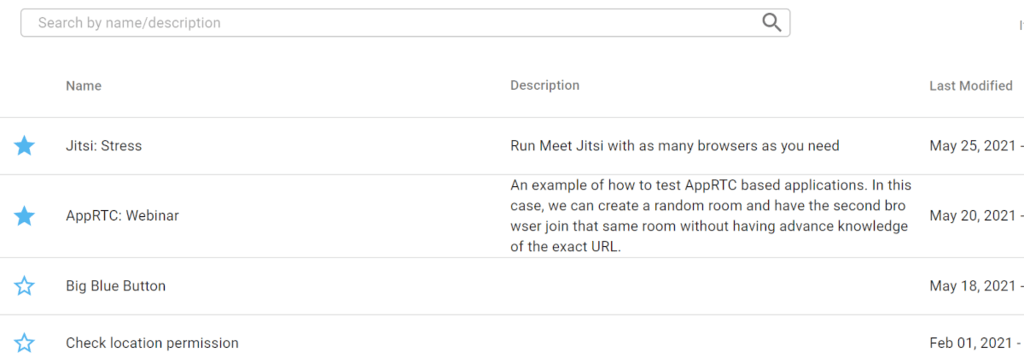
Here’s how this affect the Jitsi Sample:
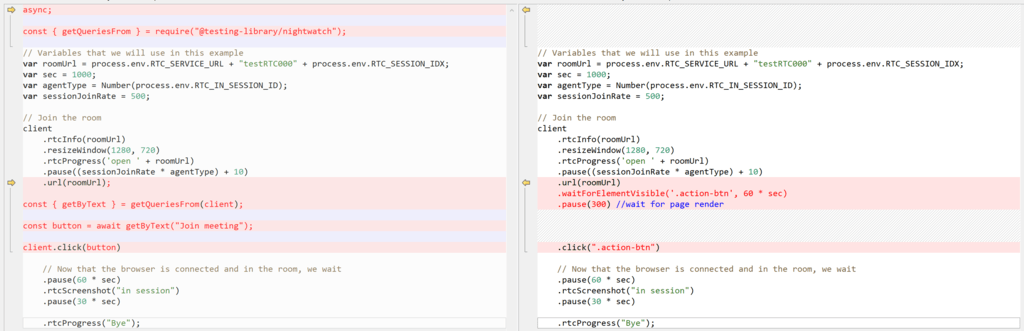
Left-hand side shows the code using the Nightwatch Testing Library.
Testing
- H.264 video codec is now supported when testing on Firefox browsers
- Additional environment variables were added to make scripting easier
- We’ve introduced process.env.RTC_EXTRA_TABS to make it simpler to handle switching windows and tabs in testRTC (especially when screen sharing)
- We now show the public IP address of our probe as part of the results
qualityRTC
- Analytics dashboard now shows traffic light colors for the collected tests, making them easier to review:

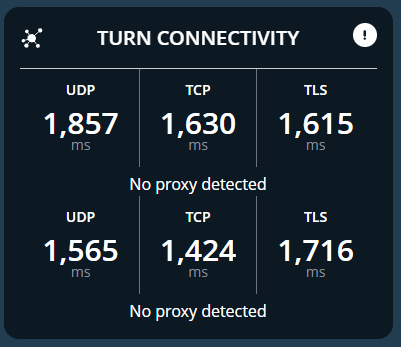
- CALL QUALITY and VIDEO QUALITY tests now issue a warning if connection occurred over TCP or TLS
- Video tests can now be conducted using virtual cameras instead of real ones
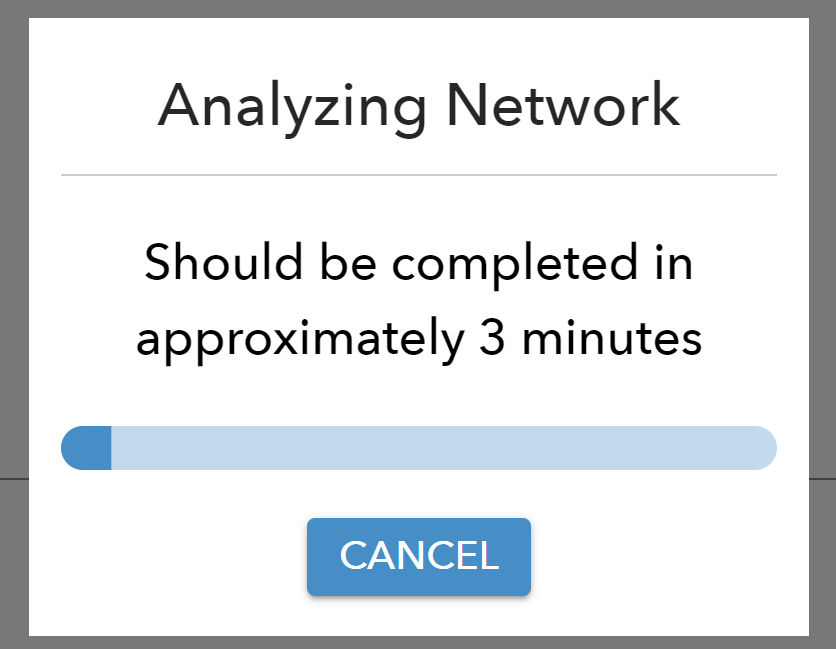
- We now optionally enable canceling tests that are being conducted. This is useful when you need to run qualityRTC on a touch based console with no keyboard connected. Learn more about qualityRTC touch support
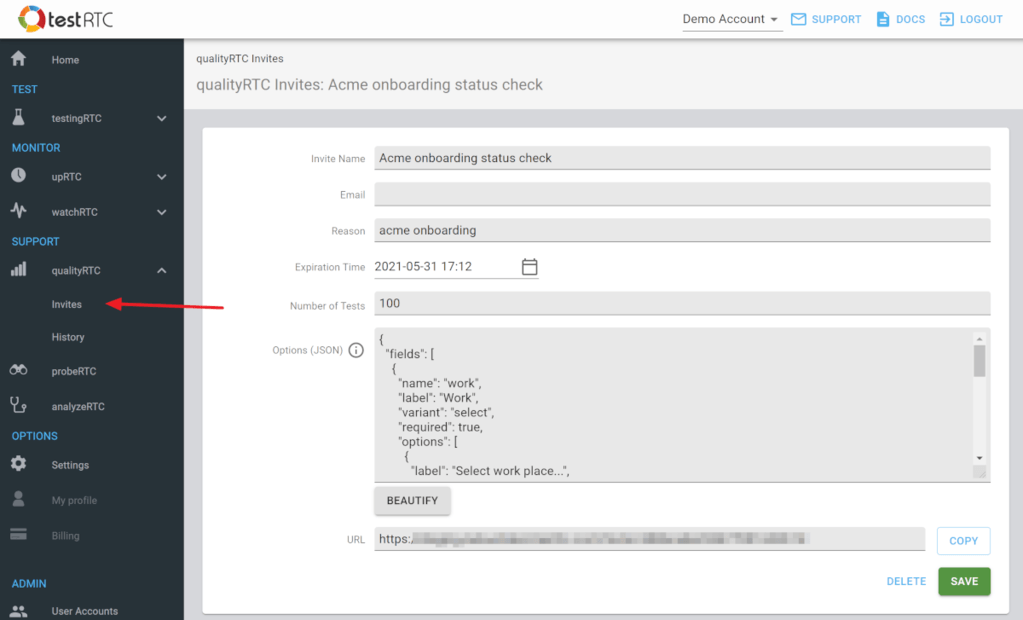
- qualityRTC invites are now more manageable, making tracing creator and expiration dates of invites easier from the dashboard
probeRTC
- Added the ability to compare results of two separate probes
- A new RESTART button is now available for running probes. This is useful mainly when using the installed probeRTC daemon applications
watchRTC
We’ve made tremendous progress with our watchRTC product. Here are some of the main improvements:
watchRTC SDK
The JS SDK has gone through some polishing, making it a lot more flexible and powerful to use
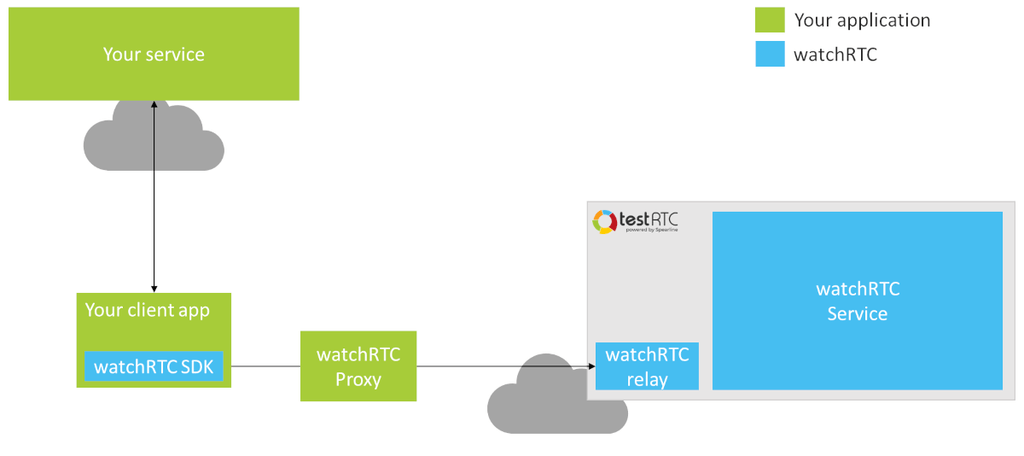
- We made it easy to integrate with both your own infrastructure and third party SDKs
- During this process, we’ve started adding proper release notes to the SDK’s installation page
- If you are running in a PWA and conduct sessions on different rooms one after the other, you can now easily modify the roomId and peerId dynamically
- You can now enable and disable data collection dynamically via the SDK
- You can now collect user’s rating and pass it on via the SDK by calling watchRTC.setUserRating()
- Distinguishing weeks and understanding day of week in the Highlights graphs
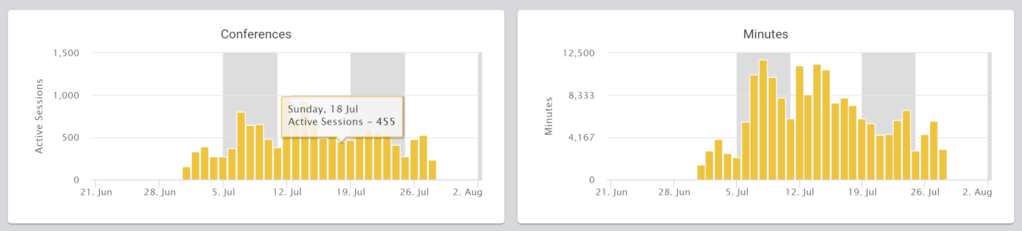
Highlight Charts
- We now show striped graphs to make it easy to see weekly trends
- When you hover your mouse over specific bars, it now also indicates the day of the week for the value you are reviewing
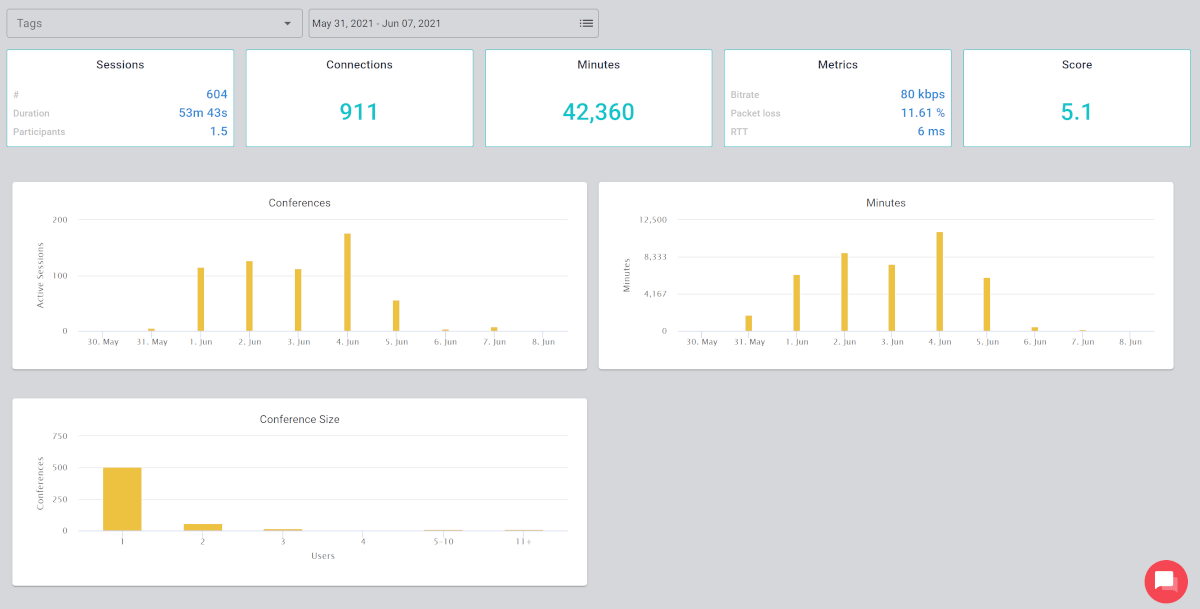
Trends Charts
There are now new trends charts available in watchRTC. These offer a closer look at the KPIs and quality metrics on your sessions.
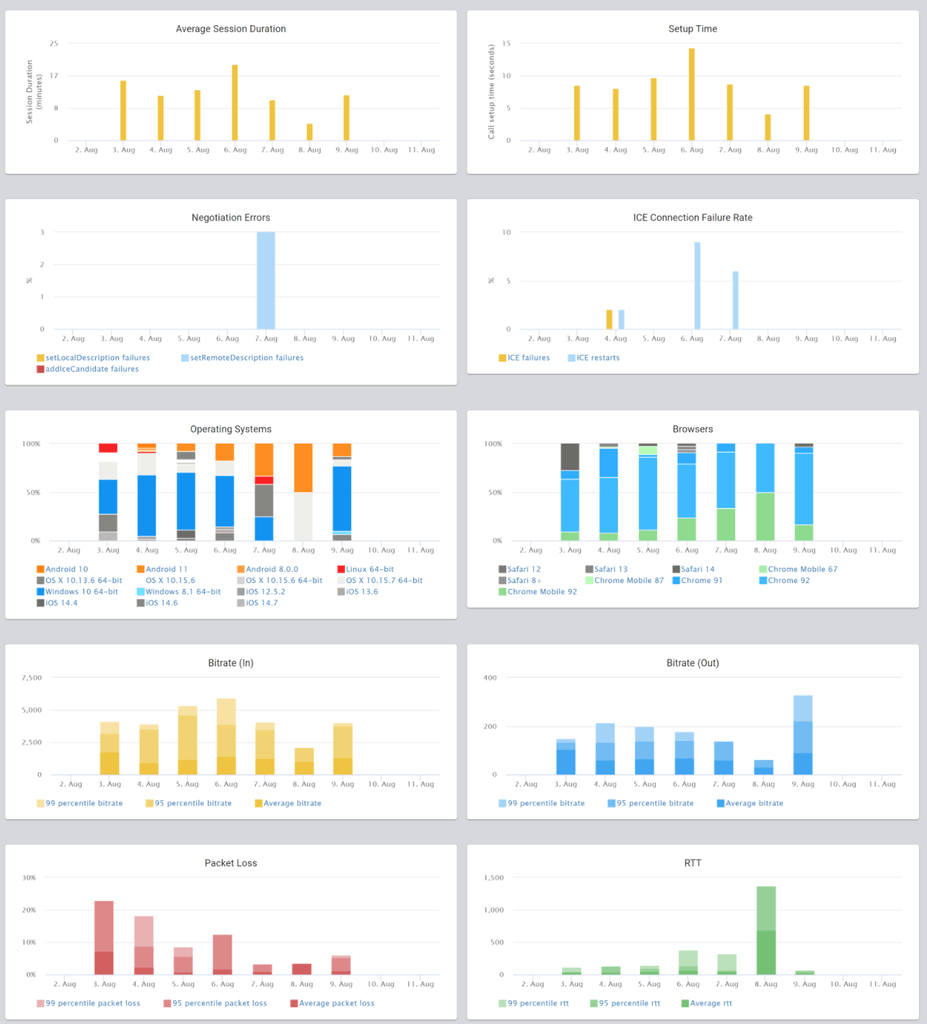
Things we report here include:
- Active sessions duration
- Setup time
- Negotiation errors
- ICE connection failure rate
- Operating systems
- Browsers
- Bitrate (in and out)
- Packet loss and RTT
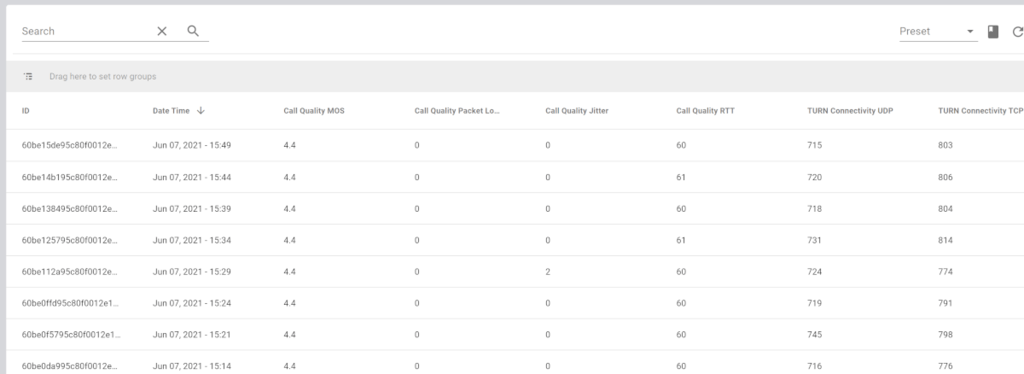
Drilldown
- You can export room level data to CSV format
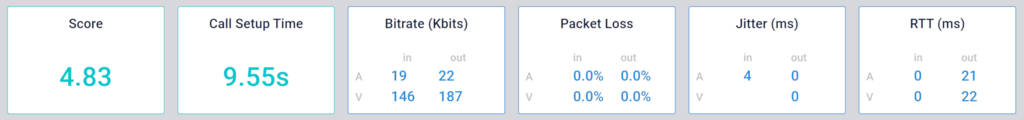
- We now show RTT information in the top ribbon of the rooms and peers:
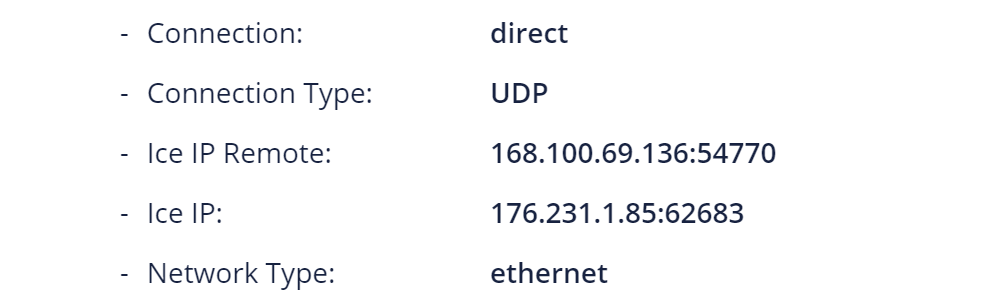
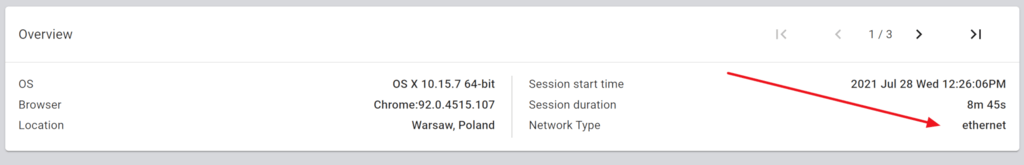
- Where possible, we now indicate the network type used in sessions conducted:
Other
- watchRTC now supports proxy data collection to ease on the need to handle firewall configurations
- You can set user ratings for a certain session via new REST API: PUT /watchrtc/room/{roomId}/peer/{peerId}/user-rating
- Added machine performance information to REST API: GET /testagents/{testAgentId}