All Posts by Tsahi Levent-Levi

How to measure re-ramp-up time for WebRTC video calls

An important aspect of performance measurement is to check how long it takes for your media server to re-ramp up back to a high bitrate after experiencing poor network conditions.

Re-ramp-up time

We’d like to show you how to simulate as well as measure that re-ramp-up time successfully with testRTC.

Here is how the result looks like:

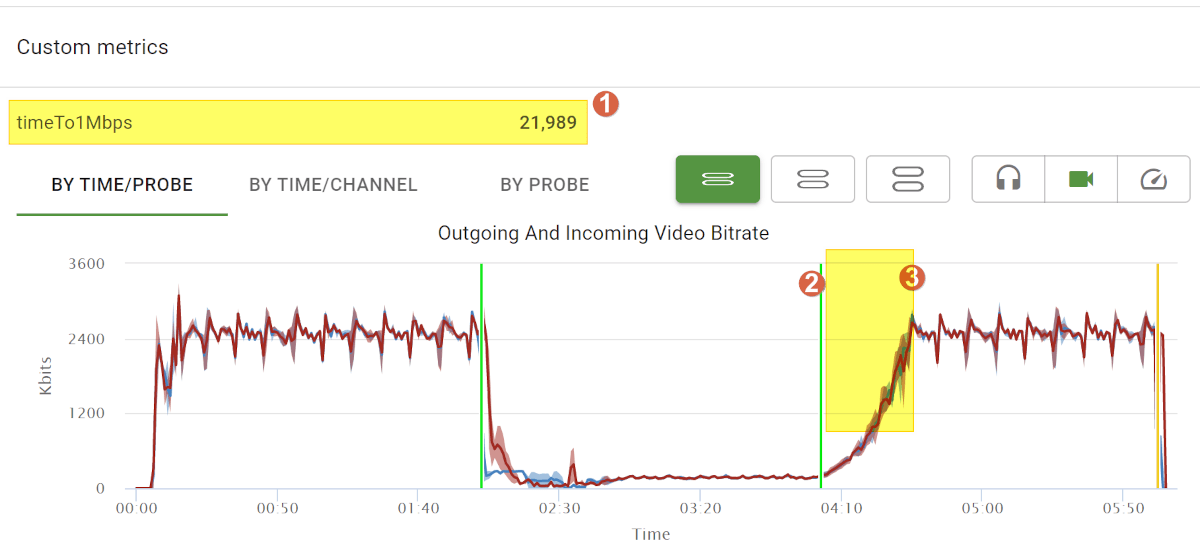
We’ve added some numbers to the image to focus on what has been added:

  1. A custom metric that calculates the re-ramp-up time to a metric called timeTo1Mbps. In the example above, it took 22 seconds
  2. An event that is placed to indicate the start time for the measurement. In our case, when we “unthrottle” the network
  3. The time that passes until the bitrate goes up again. In our case, we are interested in the time it takes to reach 1mbps

This is an important measurement to understand how your media server behaves in cases of poor network conditions – these conditions are often dynamic in nature and we’d like to make sure the media server adapts to them nicely.

The above screenshot (and the sample used here) was taken using AppRTC – Google’s peer-to-peer sample. You can see that the initial ramp up takes less than 5 seconds, but re-ramp-up takes over 20 seconds. Both of these values are going to be a lot worse for most media servers.

You will find the full test script used at the bottom of this article.

Explaining what we are doing

Once a session is connected, we are going to do the following:

  • Called .rtcSetMetricFromThresholdTime() to let testRTC know we want to measure re-ramp up time. We’ve indicated the event marked below and gave the expectation of “video.out.bitrate > 1000”
  • Wait for 2 minutes for the connection and bitrate to stabilize itself
  • Introducing poor network conditions. That is done by using .rtcSetNetwork(). In this test script, I arbitrarily chose to limit bitrate to 300kbps
  • Wait for 2 minutes under the poor conditions
  • Mark the time using .rtcEvent() and unthrottle the network. We did this by calling .rtcSetNetworkProfile() with an empty profile
  • Wait for 2 more minutes to give the connection the time to re-ramp up and stabilize

Here’s the main code pieces out of the whole script:

client
    .rtcSetMetricFromThresholdTime("timeTo1Mbps", "Good", "video.out.bitrate > 1000", "sum")

    // **** ACTUAL VIDEO CALL ****
    .pause(2*60*sec)
    .rtcSetNetwork({
        outgoing: {
            packetloss: 0,
            jitter: 0,
            latency: 0,
            bitrate: 300
        },
        incoming: {
            packetloss: 0,
            jitter: 0,
            latency: 0,
            bitrate: 300
        }
    })
    .rtcEvent('Bad', 'global')
    .pause(2*60*sec)
    .rtcSetNetworkProfile("")
    .rtcEvent('Good', 'global')
    .rtcScreenshot("in call")
    .pause(2*60*sec);Code language: JavaScript (javascript)

A few notes here:

  • Notice that the above is only implemented for one of the probes in the session and not on all of them. This allows us to observe how the other probes are affected and what the media server does in such cases
  • You can place the measurement on the receiving end instead of the sender and change it to “video.in.bitrate > 1000”
  • The actual bitrate we want to reach is arbitrary here and depends on the use case
  • We could also use it to measure ramp up time at the beginning of the session and not only after bad network conditions

Test Script Used

We’ve set the service URL to https://appr.tc and used the followingscript with 2 probes with a session size of 2:

/*
    This example measures recuperation time after poor network conditions
    
    SCENARIO
    * Browser 1 connects a session
    * Browser 2 joins the room
    * Browser 1 waits for 2 minutes
    * Browser 1 changes to a Poor 3G network for 2 minutes
    * Browser 1 removes network restrictions for 2 more minutes
    * Browser 2 measures the time for recuperation
*/


// Variables that we will use in this example
var probeType = Number(process.env.RTC_IN_SESSION_ID);
var sec = 1000;


if (probeType === 1) {
    // Browser 1 actions take place here

    // Open initial AppRTC URL and join a randomly allocated room
	client
    	.url(process.env.RTC_SERVICE_URL)
	    .waitForElementVisible('body', 10*sec)
	    .pause(1000)
    	.click('#join-button')
	    .waitForElementVisible('#videos', 10*sec)
	    
    	.pause(2*sec)
	    .rtcScreenshot("Alone in call")
	
	    // Send the room URL to the second browser
    	.url(function (result) {
    		this.assert.equal(typeof result, "object");
    		this.assert.equal(result.status, 0);
    		var roomUrl = result.value;
    		this.assert.equal(!!roomUrl, true);
    		
    		client
    		    .rtcInfo('Sending Room url %s', roomUrl)
        		.rtcProgress("Waiting @ " + roomUrl)
        		.rtcSetSessionValue("roomUrl", roomUrl);
    	})


    .rtcSetMetricFromThresholdTime("timeTo1Mbps", "Good", "video.out.bitrate > 1000", "sum")

    // **** ACTUAL VIDEO CALL ****
    .pause(2*60*sec)
    .rtcSetNetwork({
        outgoing: {
            packetloss: 0,
            jitter: 0,
            latency: 0,
            bitrate: 300
        },
        incoming: {
            packetloss: 0,
            jitter: 0,
            latency: 0,
            bitrate: 300
        }
    })
    .rtcEvent('Bad', 'global')
    .pause(2*60*sec)
    .rtcSetNetworkProfile("")
    .rtcEvent('Good', 'global')
    .rtcScreenshot("in call")
    .pause(2*60*sec);
    
} else {
    // Browser 2 actions take place here
    
    // Wait for Browser 1 to send us the URL for this call
	client
    	.rtcWaitForSessionValue('roomUrl', function (urlToJoin) {
    		client
    		    .rtcInfo('Joining ', urlToJoin)
    		    .rtcProgress("Joining " + urlToJoin)
    		    .url(urlToJoin)
    		    .waitForElementVisible('body', 30*sec)
    		    .pause(2*sec)
    		    
        		.rtcScreenshot("Joining")
    		    .click('#confirm-join-button')
    		    .waitForElementVisible('#videos', 10*sec);
    	}, 30*sec)


    // **** ACTUAL VIDEO CALL ****
    .pause(3*60*sec)
    .rtcScreenshot("in call")
    .pause(3*60*sec);
}


client
    .rtcProgress("Bye");Code language: JavaScript (javascript)

testRTC October 2021 Release Notes

Settings

We are introducing roles and permissions to testRTC 🎉

As a first step, you are now able to invite users to your account.

There are now two types of users: Account Admin and Developer. The only difference between them is that an Account Admin can invite users or remove users from the account.

All existing users have been configured to the role of Account Admin.

You will find this new capability under the Settings | Account users section.

Dashboard

We are continuing on improving the visual design of our service. This is needed in order to support the growing number of products and services we now have on offer, as well as to improve the efficiency of your workflow when you use testRTC.

Two things we did this time here:

1. Sidebar highlights

What we did this time was add some colors on the sidebar, so that you’ll have a better indication of where you are in our service.

2. Condensed mode

Many of our tables can now be switched to a condensed mode, so that you get more space for the data you want to see:

testingRTC & upRTC

Analysis

We now show CPU and memory information on the high level charts:

You get average, min and max CPU and memory use over the whole test run period AND per probe average, min and max values for CPU and memory. All that without needing to drill down to the single probe pages.

By the way, to make this happen, we also aligned the performance graphs with all the WebRTC metrics graphs so they now all share the same timeline, making it easier to analyze the results.

Oh – and while we’re still on the topic of the high level charts, they now include not only packet loss and jitter but also round trip time and frame rate.

Test Scripting

  • We’ve introduced rtcRequire() – you can now make use of any npm package in your test script.
  • Say goodbye to webrtc-internals
    • It took us time but we got there. We now heavily rely on other means to collect what we need from the running browsers. This has a lot of benefits compared to webrtc-internals
    • By default, we now won’t be opening or collecting webrtc-internals at all
    • You can re-enable it by adding #webrtc-internals:true to the run options
  • We’ve added support for complex expectations – you can now add and or or into your expectation statement when using rtcSetTestExpectation(). This can come in handy when you’d like to check if frames per second on video channels is above a certain value only if there’s any bitrate on these channels
  • When collecting pcap files, tests tended to fail due to the size of the files collected. We’ve now limited all packets collected to 100 bytes length (we truncate them). You can change that to a different value by using #pcap-file:X run option
  • CPU and memory information are now available on the probe level via our API. See GET testagents/{testAgentId}

qualityRTC

We’ve introduced a new URL parameter called context. You can use it to pass context information to the test and be able to view it in the log or collect it back on the webhook.

probeRTC

30 days view now has a striped gray-white background to the graphs to be able to see weekly delineation.

watchRTC

Please update to the latest version of our SDK. This is important to enjoy some of the new features (and to help us weed out some nagging collection bugs).

Live

Bruce Buffer Fighting GIF by UFC - Find & Share on GIPHY

Real time. We all want that.

A user complains. He is on a session. Just there. Sitting. Live. All alone. In the dark. With a problem.

What do you do for him? Ask him to open webrtc-internals? Hell no!

You just go to our brand new watchRTC Live – and dig into whatever’s wrong.

How. Cool. Is. That??? 😎

This is a new add-on feature we just introduced to watchRTC for our enterprise plans. Contact us if you want it enabled on your account as well.

Custom Keys

Goodbye tags hello custom keys!

We’ve thought tags would work. But they didn’t. So we switched to custom keys.

Here’s how this works:

  1. You talk to us and choose the keys you want supported
  2. For each, you can decide if it is for searching only or for aggregating results as well
  3. You tell us about it, add it via the SDK or REST APIs to your sessions
  4. And you’re good to go

This enables you to use metadata that fits with your own application and not only with things we thought you might want to use.

You can read more about custom keys.

We’ve revamped the operating systems and browsers graphs

  • In operating systems, we now bundle up the various versions of each operating system to make this view manageable
  • For browsers, we now show by default a “top 5” view of the main browsers used, and have the optional detailed view there as well

Analysis

  • A/V devices used in a session now appear on the peer’s overview section so you don’t have to dig into the Advanced WebRTC Analytics pages for that
  • Remote location has been added to the Overview as well, letting you know which server (or peer) this user is connected to
  • New machine information section in drill down
    • This will give you more insights to the machine your user is using
    • For the time being, the information there includes the user agent for the browser and the machine performance information we were able to collect

What IP addresses do you use for testing?

At times, our clients run their services in restricted networks, where they cannot have anyone from the public internet connect. This makes using our testing service a challenge, since by default, our service will allocate a machine on the cloud vendor we use and then dynamically be assigned an IP address.

By default, our service uses GCP for its probe machines. You can decide to open up the range of IP addresses that GCP publishes per region or for their whole network. As this may change from time to time, GCP has created an API for that: https://www.gstatic.com/ipranges/cloud.json

Oftentimes, our clients will open up their lab or network for our probes only when they conduct tests, closing it up again once done.

rtcRequire()

Enables you to install and use npm packages as part of your test scripts. npm is a package manager for JavaScript that makes it easy to share and reuse code. With npm support in testRTC, you can now leverage the ecosystem of packages and modules provided by the Node.js community.

rtcRequire() can be used by applications to use third party packages and enhance the capabilities of their scripts. This script command receives a package name and a function as an input. The function will operate in the context of the package.

Arguments

NameTypeDescription
namestringThe name of the package. This can also include a version number using the format <name>@<version>.
npmFunctfunction(object)The npm package can be used inside this function. Outside of it, it won’t exist.

Example

client.rtcRequire("jsonwebtoken", function(jwt) {
    var token = jwt.sign({ foo: 'bar' }, 'shhhhh');
    client.rtcInfo("Token: " + token);
});

client.rtcRequire("[email protected]", function(uuid) {
    client.rtcInfo("UUID: " + uuid());
});Code language: JavaScript (javascript)

watchRTC Live: real time access to ongoing WebRTC sessions

watchRTC Live is an optional add-on to watchRTC. It offers a unique real-time capability unlike any other.

When available, it offers you a live view of all users connected to your WebRTC application, and in real-time lets you drilldown into any user’s information to be able to drill down and troubleshoot any issues he may be complaining about.

The list of connected users will show you peer and room information in a searchable fashion to make it easier to find the user you’re looking for.

Rooms and peers in watchRTC

watchRTC collects metrics from WebRTC sessions to make them easy to analyze and review. Towards that end, you will need to tell watchRTC for each user joining, where it belongs to. This is done using the peerId and roomId configuration variables that you pass when using the watchRTC SDK.

peerId

A peerId represents a user on a device in a session.

  • A peerId should not include any PII. This means you shouldn’t place a name or an email address as your peerId, as these are identifiable and may be considered as privacy breach. It is preferable to use a different identifier here
  • The same peerId used inside the same roomId more than once will be defined as a single entity
    • If a user rejoins a session from the same device, it is advisable to assign him the same peerId
    • If a user joins a session from tow different devices, it is advisable to assign him different peerId values for each device
  • If you have multiple WebRTC peer connections being opened from the same device by the same user then it is advisable to associate them all with the same peerId
  • When using a 3rd party CPaaS vendor, it might make sense to use the associated identifier of the 3rd party connection with watchRTC’s peerId – this can make it simpler to troubleshoot and correlate between the two. You can also use a searchable custom key to achieve this
  • peerId’s aren’t exactly unique. You can reuse them across rooms

roomId

The roomId represents the session that holds multiple users in it.

  • A roomId should not include any PII. This means you shouldn’t place names that make this identifiable
  • The roomId represents a session and not a static room. If there is a static room where meetings are conducted one after the other, then each will be considered as a different entry in watchRTC and should probably have a different roomId
  • roomId’s aren’t exactly unique. You can reuse them. That said, our advice is to make roomId’s unique and to treat them more like sessions than rooms in your implementation logic

Selecting linkable names for rooms and peers

You can (and should) select room and peer names that make sense in your application. Be sure to select privacy adhering names and not use emails as peer names for example – this will make sure privacy is maintained by watchRTC.

If you choose names correctly, you will also be able to deep link into watchRTC and from watchRTC to your other systems.

Room closure and analysis

watchRTC collects the data from your used in realtime via the SDK. Once it deems a session as complete, it will “close” the room, analyze the results and make them available in the testRTC dashboard.

A “room” is created and starts collecting data once a user is assigned its peerId and a roomId and that roomId isn’t open.

As long as there are peers connected to the room, the room is considered open and active.

By default, once the last user disconnects from the room, the room is automatically “closed” and its data analyzed. If a peer will join the room at this point, then a new “room” entry will be created with the same roomId and it will start collected data from this new peer.

If needed, this logic can be modified so that rooms will stay open for a period of time (measured by minutes) before being closed and processed.

Configuring virtual spaces

There is a rather new concept of virtual spaces these days, where users traverse a 2D or 3D metaverse representing an office, event space or similar, conducting ad-hoc meetings as needed.

In such a concept, a room or a space is usually a static virtual location where many parallel conversations can take place.

To make the most of watchRTC for this use case, our suggestion is to follow this best practice:

  • Configure your peerId to represent a user on a specific device
    • Different users will have a different peerId (make the peerId unique per user)
    • Different devices for the same user should have a different peerId, maybe with a simple way to associate different devices of the same user
  • Configure your roomId on watchRTC to represent a specific ad-hoc conversation taking place in a virtual space
    • Different conversations within the same virtual space should have a different roomId
    • Make it simple to correlate the roomId to a virtual space if needed. You can achieve this by using a searchable or aggregable custom key called “space” which denotes the virtual space itself for example

Using custom keys in watchRTC

When you connect a session with watchRTC, you provide a roomId and a peerId. Oftentimes, this isn’t enough to offer the context you need. To compensate for that, watchRTC includes a custom keys mechanism which enables you to add whatever values you want to that peerId. This information can be your own internal index values, a specific client location, user type (doctor and patient for example) or anything else you see fit.

There are a few things to know about custom keys before you use them:

  1. The keys must be defined in advance
  2. Keys are defined for either search or search and aggregation

More on this below.

Setting values for keys

You can set values for keys in multiple ways. The most common one is via the SDK when you call watchRTC.init(), watchRTC.setConfig() or watchRTC.addKeys(). Another alternative is by calling the REST API after the fact.

If the keys haven’t been defined in your account, then they will simply be ignored and no error will be issued.

Once keys are set, they appear in History results of sessions.

Which API to use for your keys?

Since there are multiple ways to set keys, then you should understand and decide which one to use in your application.

Setting keys in watchRTC.init() is simple and straightforward. The challenge here is that init() should be called relatively quickly, and at that point you might not have the values at hand. A better approach would be to use either setConfig() or addKeys().

Calling watchRTC.setConfig() makes sense when you want the custom keys and their values to be persistent between sessions. If your web page allows joining and leaving multiple separate sessions, then keys and values passed in setConfig() will be maintained across these sessions.

Calling watchRTC.addKeys() is specific to the current active session only. It doesn’t “survive” closing the session and opening a new one – in such a case, the keys passed won’t make it to the next session (where as init() and setConfig() would). Calling addKeys() also overrides any previous values given to these custom keys throughout the duration of the current session.

Single key, multiple values

For a peer, you can set multiple values for the same key.

This is useful for example, if you’d like to indicate which media servers your peer is connected to and you can connect to multiple servers concurrently.

In order to set multiple values to the same key, you can simply place the value as an array of values when calling the SDK:

watchRTC.addKeys({ single: "value1", multiple: ["value2_1", "value2_2"] });Code language: JavaScript (javascript)

In the example above, a custom key called single gets the value of value1 while a custom key called multiple gets two values: value2_1 and value2_2.

Defining custom keys and types

If you want to use custom keys, you will need to contact our support and indicate what keys you wish to use.

During that process, we will configure on your account the keys you need.

There are two types of keys:

  1. Searchable – searchable custom keys are keys that you can use to search for a certain peerId. They don’t need to have unique values, but should not have many peers with the same value either. These are best used to correlate between information you know on your end and sessions you’d like to review on watchRTC
  2. Aggregable – aggregable custom keys are keys that can be used to filter data in Highlights and Trends dashboards. These are great when you want to understand how certain users, devices, locations, etc behave versus the rest of your population

What custom keys can/should you define?

Custom keys are a simple yet powerful tool. They can be used in many different ways.

Here’s some ways that we’ve seen our clients make use of them:

  1. Determine the user’s role in a session. For example, DOCTOR and PATIENT
  2. Assign to a specific customer account, for those who have large customers
  3. Indicate which media server instance the session connected to
  4. Use for report creation in aggregate
  5. Add peer or room specific metadata: name, internal identifier, etc
  6. A/B testing
1

WebRTC Video Diagnostics for your application (done properly)

WebRTC video diagnostics should be tackled with a holistic approach that offers an end-to-end solution for your users and your support team.

Let’s go through this rabbit hole of network testing – and what testRTC has to offer.

Dev Tools: Build vs Buy

Build vs. Buy

What I find fascinating about developer tools is the discussions you get into. Developers almost always underestimate the effort needed to do things and overestimate their skills. This is why 12 years later, the post by Jeff Atwood about copying Stackoverflow still resonates with me (read it – it is golden).

In our line of business at testRTC we get it a lot. Sentences like “we have something like this, but not as nice” or “we are planning on developing it ourselves”. Sometimes they make sense. Other times… not so much.

Over time though, the gap between an in-house tool to a 3rd party commercial alternative tends to grow. Why? Because in-house tools are bound to be neglected while 3rd party ones get care and attention on a regular basis (otherwise, who would adopt them?)

You see this also with WebRTC video API vendors (CPaaS): Most of them up until recently provided media server infrastructure with client side SDKs to connect to them. Anything else was a bonus. In the last year or two though, many of these API vendors are building more of the application layer and giving it to their customers in various ways: from ready-made iframe widgets, through UI libraries to group calling SDKs and fully built reference applications.

Twilio took it a step further with their RTC Diagnostics SDK last year and then this month the Video Diagnostics App. Both of these packages are actually reference code that Twilio offers for developers so they can write their own network testing / diagnostics / precall / preflight implementation a bit more easily.

This begs the question – what makes diagnostics such an issue that it needs an SDK and an app as references for developers to us?

Our WebRTC diagnostics and troubleshooting interaction pyramid

If we map out our users and their WebRTC configuration/network issues, we can place that in a kind of a pyramid diagram, where the basis of the pyramid are users that have no issues, and the more we go up the pyramid, the more care and attention the users need.

WebRTC diagnostics

Our purpose in life would be to “push” as many users as we can down the pyramid so that they would be able to solve their connectivity issues faster. That would reduce the energy and strain from the support organization and will also result in happier customers.

Pushing users down the pyramid requires better tooling used by both our end users AND our support team.

The components of WebRTC diagnostics

When you are thinking of assisting end users with their connectivity or quality issues over WebRTC, you’re mainly thinking about peripheral devices and networks.

There’s this dance that is going to happen. A back and forth play where you’re going to ask users to do something, they will do it, you’ll look at what they did – rinse and repeat. Until the problem is solved or the user goes away frustrated.

Objective of WebRTC diagnostics

What we want to do is to reduce the amount of back and forth interactions and if possible make it go away entirely.

Here are the things the user will be interested in knowing:

  1. Are my peripherals (microphone and camera) set up correctly?
  2. Can I connect to the service?
  3. Am I getting a good quality connection?

But then there are the things our support would like to understand as well:

  1. Can the microphone or camera the user has cause issues?
  2. What machine is he running on exactly, and with what middleware?
  3. Where is he coming from?
  4. How is the user’s network behaving in general?
  5. Does he have a stable connection with a “clean” network?
  6. Did anyone configure their firewall in any restrictive way?

As you can see, there’s a slight difference in the requirements of the end users while they tries to solve the problem versus what support would need to help them out.

Oh, and then there are the differences between just voice services and video services, where WebRTC video diagnostics are a bit trickier in nature.

Let’s review what components we’re going to need here.

1. A/V Setup/configuration

Setup

You want to let the users understand if their microphone and camera work. And for that, you need to add some settings screen – one that will encompass the use of these devices and enable users to pick and choose out of the selection of devices they have connected. It is not unheard of to have users with multiple microphones and/or cameras (at any given point in time, my machine here shows 3 cameras (don’t ask why) and 4 different microphone alternatives.

This specific configuration is also tricky – you need to be able to handle it in two or three different places within your application: at the very least, on the first time someone uses your service and then again inside a session, if users want to switch between devices mid-session.

For the most part, I’d suggest you take care of this setup on your own – you know best how your UI/UX should be and what experience you’re after for your users.

2. Precall/preflight connectivity check(s)

Connectivity Checks

Some like it, others don’t. The idea here is to have the user go through an actual short session in front of the media server, to see if they can get connected and understand the quality of the connection. This obviously takes time (30+ seconds to get a meaningful reading usually).

It is quite useful in the sense of preparation:

  • When the session is important enough to have people join a wee bit earlier;
  • Or when the user can be forced to go through the hoops of waiting for this

Bear in mind that such a connectivity check should better happen in front of the media server or at the very least the data center that the user will get connected to in his actual session.

Also note that for WebRTC video diagnostics, the tests here are a bit different and more rigorous, especially since we need to test for much higher bitrates (and usually for slightly longer periods of time).

3. Automated data collection

Automated Data collection

We’re getting to the part that is important to the support team more than it is to the end user.

Here what we’re after is to collect anything and everything that might be remotely useful to our needs. Things like:

  • The type of network the user is on
  • How is he connected to the service?
  • What are the names of the devices they have?
  • Where is the user located geographically?
  • Do we know what specific microphone and camera they are using?
  • What operating system and browsers do they use?

Lots and lots of questions that can come in handy to figure out certain types of breakages and behaviors.

We can ask the user, but:

  1. They might not know, or have hard time finding that information (and we don’t want to burden them at this point any further)
  2. They might be lying to us, usually because they aren’t certain (and sometimes because they just lie)

Which means automating that collection of information somehow, which means being able to glean that information with as little work and effort as possible on the user’s side.

4. 360 network testing

Network testing

Let’s assume the user can’t connect to your service or even that they experience poor quality due to some bandwidth limitations or high packet loss. Is that because of your infrastructure or their home/office network?

Hard to say. Especially if all you have to go with is the metrics on your server or the webrtc-internals dump file from the user’s device. Why? Because the story you will find there will be about what happens in front of your service alone.

What you really need is a 360 view of your user’s network. And for that, you need a more rigorous approach. Something that would intentionally test for network connectivity on various protocols, try to understand the bandwidth available, connect elsewhere for “comparison” – the works.

The hard thing here is that to properly conduct such tests and collect the data you will need to install and configure your own specialized servers for some of the tasks. These aren’t going to be the ones your WebRTC application infrastructure uses for the day to day operations – just ones that are used for troubleshooting such user issues.

You can do without this, but then, your results and the information you will have won’t be as complete, which means figuring out the trickiest user issues will be… trickier… and will take more time… and will cause more frustrations for said user.

5. Workflow

Workflow

Then there’s the workflow.

A user comes in. complains.

What now?

Do you wing it each time? Whenever a user complains – do the people in support know what to do? Do they have the process well documented? Do you guide or hint to users how they can solve the issues themselves?

Thinking of that workflow, assuming you have templated emails and responses readily available, how do you deal with the user’s responses? How do you make sense of the data they send back? What if the user goes off your script?

And while we’re at it, are you collecting the complaints and analysis and storing it for later analysis? Something you can use to understand what types of typical issues and complaints exist and how you can improve your infrastructure and your workflow?

This part is often neglected.

Our qualityRTC solution for WebRTC diagnostics

We’ve got a solution for the WebRTC audio or WebRTC video diagnostics challenge. One that takes care of the network testing in ways that build your self service and hands on support for users – in a way that fits virtually any workflow.

If you want to really up your game in WebRTC diagnostics – for either voice or video scenarios – with Twilio, some other CPaaS vendor or with your own infrastructure – let us know. We can help using our qualityRTC network testing solution.

What to do if the Javascript SDK doesn’t seem to collect any data?

Validate the following:

  1. watchRTC.init() MUST be called before any call to RTCPeerConnection or those connection will not be captured
    • Using a CPaaS SDK or any other third party WebRTC library? Make sure to include it AFTER you include AND call watchRTC.init()
    • That said, do note that until a peer connection is actually opened, you won’t see any network traffic related to watchRTC
  2. Are you sure the HTML page the session is running from is in the domains captured by watchRTC?
    • When you onboarded, you were asked which domains you wish to cover
    • If the domain used is not in that list, then it will simply be ignored

Now that we covered the basics, follow these debugging steps.

Enable additional debugging

Add to the URL of your web application /?watchrtc=debug

This will add additional debug messages that will make it easier for you and our support figure out the issue faster.

Find the connection ID

In Chrome, open the dev console and filter for watchrtc messages.

Search for a “connection established” message. It should look similar to this:

What you’re looking for is the connection ID and the SDK version. When contacting our support, provide these values.

Are you connected to our servers?

In Chrome, on the dev tools, open the Network tab. See if you can find a connection to a watchRTC / testRTC server.

It should look similar to this:

What we want here is to make sure that there’s a websocket connection opened (wss:// one).

Found it? Great!

Now go to the Messages tab. We want to make sure that there are periodic messages on that connection going towards the server. The information there will be compressed, so the content is less important than just seeing that there are messages.

Assume these will occur anywhere between once a second to once a minute or two, depending on how your account is configured.

Enable verbose console logs

You can enable verbose console logs which can greatly help with debugging. Our support may occasionally ask for it if you reach out for assistance around connectivity.

To do so, just open the URL of your application and add watchrtc=debug to it.

If your application’s website is https://myapplication.com then you can use https://myapplication.com?watchrtc=debug

Common integration issues

  • Calling watchRTC.init() after opening a peer connection
  • Calling watchRTC.init() after including a third party WebRTC SDK (such as Vonage’s opentok)
  • Setting the peerId and roomId only after opening a peer connection
  • Using the wrong API key
  • Not loading the SDK dynamically when using server side rendering frameworks like Next.js

webrtc-internals and getstats parameters

At testRTC we try hard to simplify the analysis process. We do this by visualizing the results as much as possible and making the important information pop out. While at it, we also make sure you always have access to as much data as you need, so we collect everything we can for you.

WebRTC offers a slew of statistics and metrics. These are made available through our results in the various products via the Advanced WebRTC Analytics section. This information as given “as is” and it is assumed you’ll know what to do with it.

That said, we have written a few articles explaining the contents of webrtc-internals and the meaning of the most important metrics in WebRTC’s getstats interface:

  1. webrtc-internals and getstats parameters – a detailed view of webrtc-internals and the getstats() parameters it collects
  2. active connections in webrtc-internals – an explanation of how to find the active connection in webrtc-internals – and how to wrap back from there to find the ICE candidates of the active connection
  3. webrtc-internals API trace – a guide on what to expect in the API trace for a successful WebRTC session, along with some typical failure cases

1 4 5 6 7 8 32