All probes allocated by testRTC use an NTP server to synchronize their clocks. The server in use is Google’s NTP (more about it here: http://time.google.com/).
If you configure your servers to the same NTP servers, you will be able to synchronize the logs across testRTC and your infrastructure to the same timestamps.
Also note that all times in testRTC logs are using UTC timezone for the same reason. When showing the results in the UI, we convert the time to the browser’s timezone.
When using the watchRTC SDK, we need to be able to bind with the WebRTC APIs before Vonage Video API is loaded.
👉 Vonage Video API is also know as OpenTok or TokBox.
In general
Make sure you call watchRTC.init() prior to including the opentok.min.js script file in your web page
If opentok.min.js is loaded prior to calling watchRTC.init() no metrics or data will be collected
If you use opentok-react
Vonage has a project known as opentok-react. It is a popular starting point for some developers.
If this is the case, then you will need to get our watchRTC SDK to load and initialize prior to including opentok.mis.js. To achieve that, follow these steps:
Go to root file, the one where you import watchRTC SDK and use watchRTC.init() function
Here’s what this does: This delays the opentok script from being injected and overriding everything that the watchRTC SDK needs until YourComponentName is rendered.
watchRTC is a passive monitoring tool that enables you to collect, track and analyze your user’s usage patterns of your service. This is enabled by integrating the watchRTC SDK as a part of your application. Once integrated, your users’ sessions will be tracks and their metrics collected by watchRTC, making them accessible to you on the watchRTC dashboard for analysis and drilldown.
Architecture Components
watchRTC is built out of 2 main components:
Client SDK – integrated into your client application
It silently collects WebRTC related events and metrics and sends them to our backend
The client is designed to be compact as to not consume to many resources
Dashboard – the Dashboard is where your support team can analyze the results, either in aggregate or by drilling down to specific sessions and peers
Dashboard views
The dashboard offers multiple views, where each view has its own purpose:
Highlights – shares a bird’s-eye view of the aggregated data
Trends – review the qualitative nature of your deployment
History – drills down to individual sessions/rooms and peers/clients
Live– optional add-on, offering real-time access to ongoing WebRTC sessions
Jitsi Meet is a very popular open source video conferencing engine.
If you are using it, then the script below is a great starting point.
Preparation
There is a “Jitsi example” script in any account created on testRTC. It is used as a sample and starting point for those who are evaluating our service.
The script itself creates a random room on meet.jit.si and then enters that room. If you use the service manually, it ends up looking something like this:
That blue “Join meeting” button? It usually doesn’t exist if you install and host your own Jitsi server “out of the box”. In such a case, make sure to comment out the following lines from the test script code shared at the end of this article:
Why comment them out? Because these wait for the “Join meeting” button to appear and then click it. If you don’t have that in your Jitsi service, then the test script will fail on it, waiting for a button that will never appear on screen.
Using the test script
In testRTC, create a new test script:
Copy the code from the bottom of this article to your test script (or use the existing sample in your account)
Decide the number of probes you want to use
2 Concurrent probes will be good starting point
Set the Session size to the number of concurrent probes for this sample
Replace the Service URL of the script with the URL where your Jitsi Meet server is installed
Test execution
Run the script. It does everything for you.
If you want, you can join the same room from your browser once you see the URL in the progress messages of the test.
Test script code
/*
This example shows how to automate Jitsi based scenarios in testRTC
SCENARIO
* Browser joins room URL
* Browser runs for 2 minutes
SCALING
To scale the test, change the number of concurrent users and/or the
number of users in the session (look at #session:2 in Run Options).
THINGS TO PLAY WITH
* Probe configurations (look after the script):
- Location of probes
- Media files to use
- Network configuration and quality
- Browser version
* Number of concurrent users (in a paid account. Evals limited to 2 max)
* Session size (Run Options; #session:2 value)
* Join with your own browser to the URL of the test
(try opening https://meet.jit.si/testRTC0 when the test is running)
*/// Variables that we will use in this examplevar roomUrl = process.env.RTC_SERVICE_URL + "testRTC000" + process.env.RTC_SESSION_IDX;
var sec = 1000;
var agentType = Number(process.env.RTC_IN_SESSION_ID);
var sessionJoinRate = 500;
// We set a few expectations. If these don't happen, the test will fail// In Jitsi case, we want to make sure we have:// 1. At least 2 incoming A/V channels// 2. No more than 2 outgoing A/V chanels (2 due to Jitsi's P2P4121 mode)// 3. Media being sent and received
client
.rtcSetTestExpectation("audio.in >= 1")
.rtcSetTestExpectation("audio.out >= 1")
.rtcSetTestExpectation("video.in >= 1")
.rtcSetTestExpectation("video.out >= 1")
.rtcSetTestExpectation("audio.in.bitrate > 0")
.rtcSetTestExpectation("audio.out.bitrate > 0")
.rtcSetTestExpectation("video.in.bitrate > 0")
.rtcSetTestExpectation("video.out.bitrate > 0");
// Join the room
client
.rtcInfo(roomUrl)
.resizeWindow(1280, 720)
.rtcProgress('open ' + roomUrl)
.pause((sessionJoinRate * agentType) + 10)
.url(roomUrl)
.waitForElementVisible('.action-btn', 60 * sec)
.pause(300) //wait for page render
.click(".action-btn")
// Now that the browser is connected and in the room, we wait
.pause(60 * sec)
.rtcScreenshot("in session")
/* //Now Lets switch to a 3G network
.rtcSetAdditionalInfo("Network degrades to Regular 3G mid call")
.rtcEvent("Network 3G", "global")
.rtcSetNetworkProfile("Regular 3G")
.pause(30 * sec)
.rtcScreenshot("3G")*/
.pause(30 * sec)
.rtcProgress("Bye");Code language:JavaScript(javascript)
qualityRTC invites is a mechanism provided to Enterprise plans of qualityRTC.
This mechanism enables support staff to generate unique invitations to conduct network tests using qualityRTC which are preconfigured. The configuration of an invite can include existing form field values and even new custom fields generated for the purpose of using the specific invite.
Availability
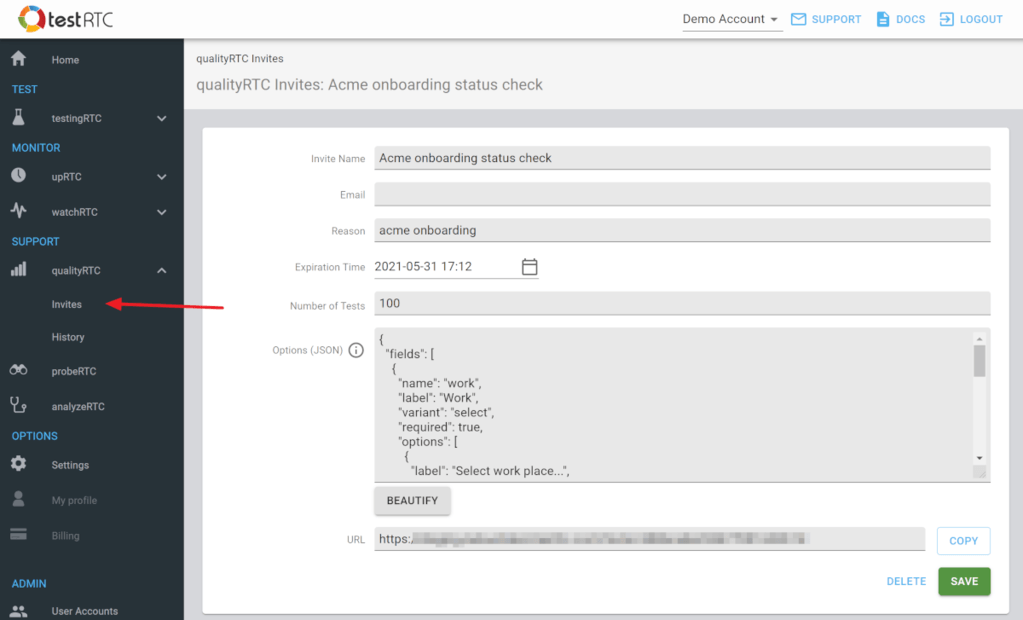
If enabled in your account, then the qualityRTC menu on the sidebar will now be split and show a new Invites sub menu.
Selecting that sub menu item will bring you to a new table which manages existing invites in qualityRTC.
You will be able to add, modify and delete existing invites. Invites that expired will automatically be removed from this table after a few days time.
Use
When creating an invite, you will be able to fill out the following entry fields:
Invite Name – an internal verbose name for you to identify the invite with
Fields associated with your qualityRTC configuration – these can be kept empty if you wish the end user to fill them in
Expiration Time – the last date the invite will be valid. After that date, trying to use an invite link will fail
Number of Tests – the number of times the invite can be used by users
Options – additional optional custom fields and values. You can read more about the Options JSON structure
Integrations
Invites can be created via API calls
The results table can be embedded as an iframe in your web application
Notes
Once created, the invite will generate a URL. You can send this URL to users to conduct their network tests
All results collected by an invite that was used will be shown both on the bottom of the invite page as well as on the History table of qualityRTC
If you are using qualityRTC invites, you can configure the main network test page to work exclusively with it, barring users from using it without a specific invite link
qualityRTC supports internationalization of its user facing frontend.
You can either select to have English as the only language for your qualityRTC setup, or have it support internationalization. When internationalization is selected, the following rules apply.
There are several ways in which the language can be selected:
Machine’s default language – by default, qualityRTC will choose a language that is configured as the default for the user’s device. If the default isn’t supported by testRTC, it will revert to English automatically
Selecting via URL flag – you can add ?lang=<LANGUAGE> to the page URL to select a specific language
UI based – an optional dropdown menu on your web page can be provided letting the user explicitly select the language
The results are stored in English in the log and the support teams can access the results and view the UI in any language they see fit, regardless of what the user users during the test.
Supported languages
qualityRTC supports the following languages:
English
Arabic
French
German
Japanese
Portuguese
Spanish
Notes:
Your customization might require modifying the dictionary to fit your needs
Additional languages can be made available as part of the setup of your account
testRTC offers specialized assertion and expectation commands that are meant to automatically determine the pass/failure status of a test run or a monitor run.
These mechanisms are listed here:
Expectations
Expectations are special testRTC mechanisms that are calculated at the end of a test run or a monitor run. These can be used to look at metrics and determine if a test passed or failed based on user defined thresholds.
You can explicitly force failure or warning in the probe or the whole test.
.rtcWarning() – add a warning to the probe’s status with a specific warning message
.rtcFail() – fail the probe in the test with a specific error message
.rtcFailAll() – fail the probe and attempt to stop the test by failing all probes in the test with a specific error message
Nightwatch assertions
Nightwatch scripting language has its own assertion mechanisms that can be used in testRTC. Our suggestion is to try and use the above primitives instead where possible.
Indicate expected outcome for the specific probe execution. This is used to decide if a test has successfully passed or failed.
Unlike .rtcSetTestExpectation(), this script command enables you to create your own calculation as an asset. Your function will be called at the end of the test run, letting you decide what to do with the metrics collected and determine if the test should pass or fail.
If you want to create a custom expectation based on events in the session then use .rtcSetCustomEventsExpectation(). You can also check other assertions and expectation commands available in testRTC.
Arguments
Name
Type
Description
asset-name
string
The name of the asset holding the expectation calculation
Asset
To create a custom expectation, you first need to add a special asset to your project:
Once added, you can modify the expectation asset’s code with the calculation you’d like to do over the data.
The asset will be called multiple times – once for each channel that got collected for this probe:
To decide which channel you are looking for, you can look at the local variables direction and channelType
You can also check the startTimestamp, endTimestamp and interval between the metric values. The interval is given in seconds
metricValues store the actual statistics collected. You have access to bits, packets, loss and jitter
Your final verdict should be placed in the result variable
Example
// This code will be called on each test iteration and on each channel.// Next data you will have per each data channel: // direction: "send" | "recv" - direction of data in channel// channelType: "audio" | "video";// startTimestamp: number; - channel start// endTimestamp: number; - channel end// interval: number; - data frequency ( 1 means 1 value/sec )// metricValues: {// bits: number[];// packets: number[];// loss: number[];// jitter: number[];// };// keep thisconst result = {
passed: true,
errMessage: ""
};
// example calculationsconst array = metricValues.loss;
const avgLoss = array.reduce((total, value) => total + value, 0) / array.length;
if (avgLoss > 1) {
result.passed = false;
result.errMessage = "Data loss is too big!";
}
// keep this
result; Code language:JavaScript(javascript)
The code above will place an error on each channel where the average packet loss value is bigger than 1.
testRTC allows you to share key/value pairs between the probes that are part of the test run. This script command together with .rtcSetTestValue() can be used for such information sharing and for synchronization across probes.
This script command will wait until the requested key is received in the test run. The callback function will be invoked and its a single parameter will hold the value provided in the call to .rtcSetTestValue() by another probe. If the time indicated passes without receiving the value, this command will fail.