All Posts by Tsahi Levent-Levi

VoIP Network Tests in the era of WebRTC

Not sure what got to me last week, but I wanted to see what type of network testing for VoIP exists out there. This got me down memory lane to what felt like the wild west of the 90’s world wide web.

You can do that yourself! Just search for “voip network test” on Google and check what the tests look like. They come in exactly two shapes and sizes:

  1. A generic speed test
  2. Download a test app

None of these methods are good. They are either incorrect or full of friction.

The ones hosting these network tests are UCaaS vendors, trying to entice customers to come their way. The idea is, you run a test, and they nicely ask you how many phone lines you’d like a quote for…

So what’s wrong with that?

1. Generic speed tests aren’t indicative of ability to conduct VoIP calls

Most of the solutions I’ve found out there were just generic speed tests. Embedding a network test page of a third party or going to the length of installing your own speed testing machine, which is fine. But does it actually answer the question the user wants answered?

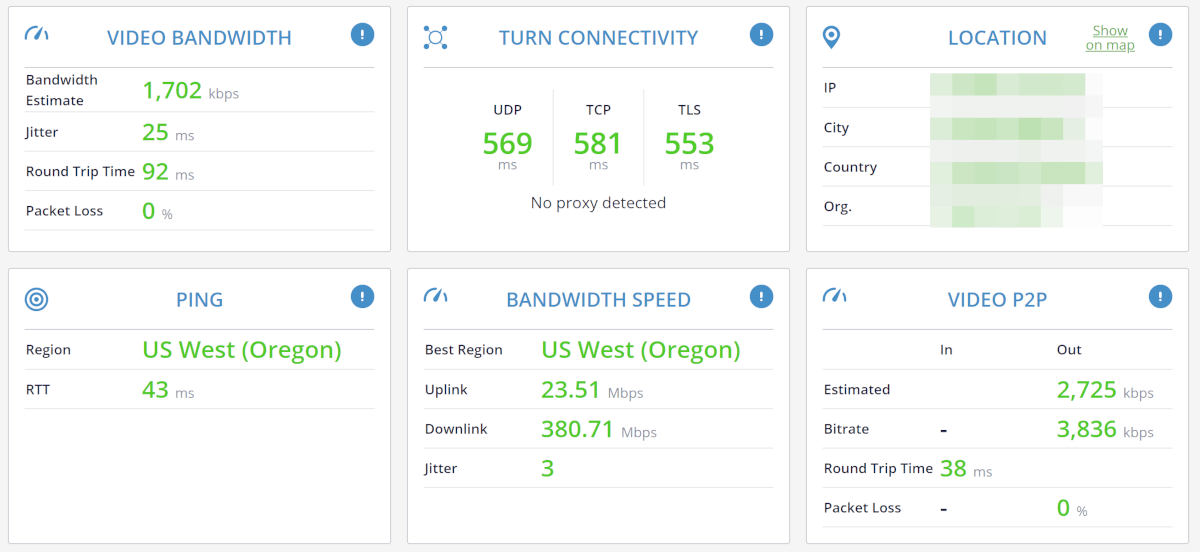
Here’s an interesting example where bandwidth speeds are GREAT but support for VoIP or WebRTC – not so much:

Great bandwidth, but no UDP available – a potential for bad VoIP call quality

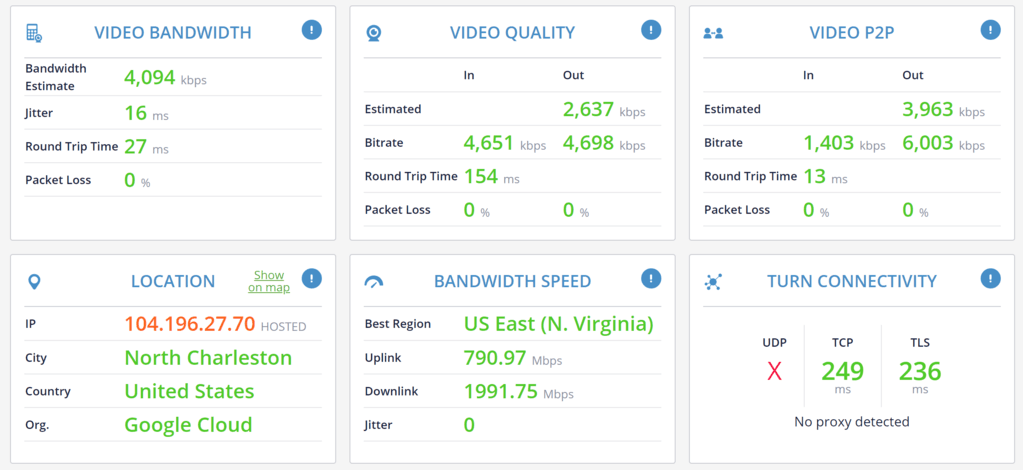
I’ve used our Google Cloud machines to try with. It passes the speed test beautifully. What does that say about the quality I’ll get with it for VoIP? Not much.

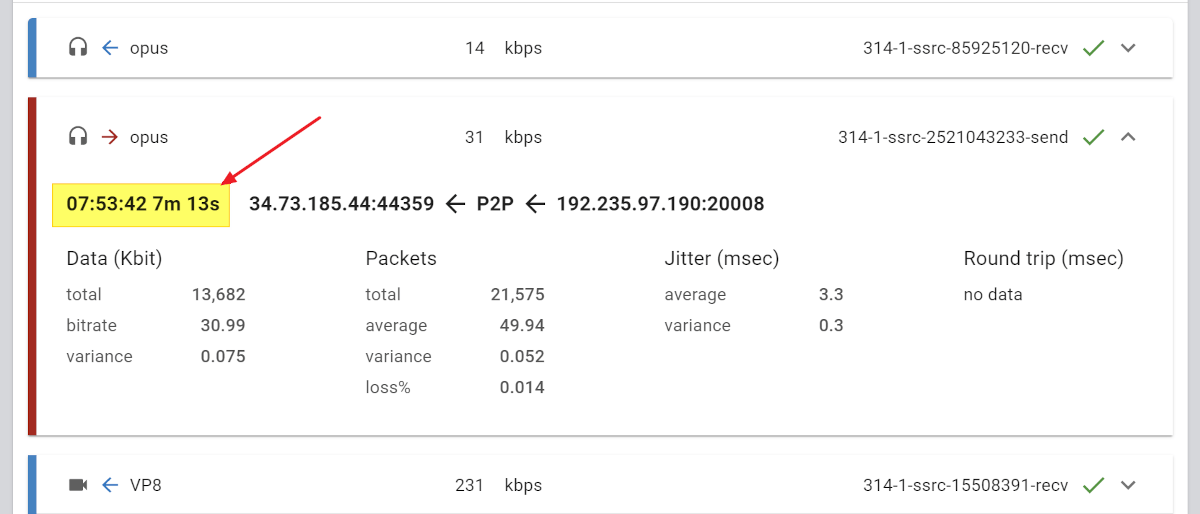
For that same device on the same network, I am getting blocked over UDP. VoIP is conducted over UDP to maintain low latency and to handle packet losses (which happen on any network at one point or another).

This isn’t limited only to wholesale blocking of UDP traffic. Other aspects such as the use of a VPN, throttling of UDP, introduction of latency, access to the media devices – all these are going to affect the user’s experience and in many cases his ability to use your VoIP service.

👉 Relying only on a generic speed test is useless at best and misleading at worst.

2. Downloading test apps is not what you expect to do in 2021

In some cases, speed test services ask you to download and install an application.

There’s added friction right there. What if the user doesn’t have permission to install applications on his device? What if he is running on Linux? What if the user isn’t technically savvy?

I tried out one out one of these so called downloaded speed tests.

I clicked the “Start test” button. After some 10 seconds of waiting, it downloaded an executable to my machine. No further prompts of explanations given.

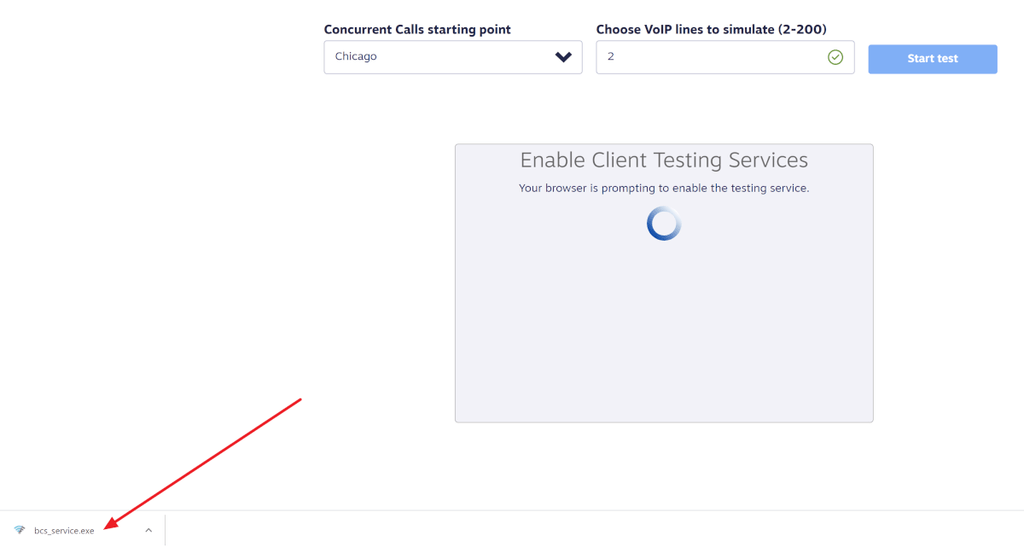
That brought the Windows 10 installation screen, with a name different than that of the vendor whose site I am on.

Deciding to install, I clicked again, only to be prompted by another installation window.

Next clicks? EULA, Opt-in, Folder selection, Finish

So… I had to agree to an EULA, actively remove an opt-in, select the folder to install (had a default there), reminded that it is running in the background now (WHY? For what purpose?), and then click on Finish.

It got me results, but at what cost and at what friction level for the end user?

In this specific case – before I even made a decision to use that service provider. And I had to:

  • Click on 6 buttons to get there
  • Sign a legal document (EULA)
  • Opt out from something (so it won’t leave ghosts on my machine)
  • Remember to go and delete what was downloaded

And there’s the challenge here of multiple popups and screen focus changes that took place throughout the experience.

The results might be accurate and useful, but there are better ways.

👉 Having a downloadable installed test adds friction and limit usability for your users.

What to look for in a VoIP network test?

There’s a dichotomy between the available solutions out there: they are either simple to use and grossly inaccurate, or they are accurate and complex to use.

Then there’s the fact that they answer only a single question – is there enough bandwidth. Less so to other network aspects like firewall and VPN configurations.

From our own discussions with clients and users, here’s what we learned in the last two years about how VoIP network tests should look like:

  • Simple to use
    • Simple for the end user to start the test
    • Simple for the support/IP person to see the results
    • Simple to read and understand the results
  • Specific to your infrastructure
    • A generic test is great, but isn’t accurate
    • Something that tests the network needs to test your infrastructure directly. If that’s impossible, then the best possible approximation to it
  • Supports your workflow
    • Ability to collect data you need about the user
    • Easily see the results on your end, to assist the client
    • Customizable to your business processes and use cases

Check qualityRTC

In the past two years or so we’ve been down this rabbit hole of VoIP network testing in testRTC. We’ve designed and built a service to tackle this problem, with a lot of help from our customers, we’ve improved on it and still are, to the point where it is today:

A simple to use, customizable solution that fits to your infrastructure and workflow

Within minutes, the user will know if his network is good enough for your service, and your support will have all the data points it needs to assist your user in case of connectivity issues.

Check out our friction-free solution, and don’t forget to schedule a demo!

Let's talk about you

Get a personalized demo of the testRTC Platform

Testing large scale WebRTC events on LiveSwitch Cloud

If you are developing WebRTC applications that target large scale events – think hundreds of users in a single “room”, then you should continue reading.

LiveSwitch Cloud by Frozen Mountain is a modern CPaaS offering focused around video communications. Naturally it makes use of WebRTC and relies on the long heritage and capabilities of Frozen Mountain in this space. Frozen Mountain has transitioned from a vendor that specializes in SDKs and media servers you can host on your own to providing also their managed cloud service. In essence, dogfooding their technology.

One of the strong markets that Frozen Mountain operates in is the entertainment industry, where large scale online virtual events are becoming the norm. A recent such testRTC client used our WebRTC stress testing capabilities to validate their scenario prior to a large event.

This client’s scenario included segmenting the audience of a live event into groups of 25 viewers that could easily be monitored by producers in a studio control room and displayed to performers as a virtual audience that they could see, hear, and interact with during the event. We settled on 36 such segments, totalling 900 viewers in this WebRTC stress test.

Here is a sample test run from the work done:

The graph above shows the 900 WebRTC probes that were used in one of these tests. The blue line denotes the incoming average bitrate over time of the main event as seen by each of the viewers. The redline is the outgoing bitrate. Since these viewers are used to convey an atmosphere to the event, there was no need to have them stream high bitrates – having 900 of them meant a lot of pixels in aggregate even at their low bitrate. You can see how the incoming bitrate stabilizes at around 2mbps for all the viewers.

This graph shows for each individual probe out of the 900 WebRTC browsers that we had what was the average bitrate they had throughout the test. It is a slightly different view towards the same data that is meant to find outliers.

There are slight variations to a few of the probes there, which shows a stable system overall.

What was great about this one, is the additional work Frozen Mountain did on their end: The viewers were split into segments that had to be filled randomly, as they would in real life. Each user joining in, coming in at his own pace, as opposed to packing the segments one after the other with people like automatons.

The above animation was created by Frozen Mountain to illustrate the audience. Each square is a user, and each segment/pool has 25 users in it. You can see how the 900 probes from testRTC randomly fill out the audience to capacity.

Testing for live WebRTC events at scale

We are seeing a different approach to testing recently.

As we are shifting from nice-to-have and proof-of-concepts to production systems, there is a bigger need to thoroughly test the performance and scale of WebRTC applications. This is doubly true for large events. Ones that are broadcasted live to audiences. Such events take place in two different industries: entertainment and enterprise.

Within the entertainment industry, it is about working alongside the pandemic. Being able to bring the audiences back to the stadiums and theatre halls, alas remotely. With enterprises it is a lot about virtual town halls, sales kickoffs and corporate team building where everyone is sheltered at home.

In both these industries the cost of a mistake is high since there is no second chance. You can’t really rerun that same match or reschedule that town hall. Especially not with so many people and planning involved to make this event happen.

End-to-end stress testing is an important milestone here. While media server frameworks and CPaaS vendors do their own testing, such solutions need to be tested end-to-end for scale. Bottlenecks can occur anywhere in the system and the only real way to find these bottlenecks is through rigorous stress testing.

Being able to create a test environment quickly and scale it to full capacity is paramount for the success of the platform used for such events, and it is where a lot of our efforts have been going to these recent months, as we see more vendors approaching us to help them with these challenges.

What we did on our end was solve some bottlenecks in our infrastructure that “held us back” and enabled us to assist our clients only up to 2,000 probes in a single test. We can now do more of it and with higher flexibility.

testRTC February 2021 Release Notes

Account Settings

We are starting to flesh out the user-facing account settings and profile settings. As such, you will see a new sidebar menu:

We are starting to build up the account configuration and user settings area of testRTC, starting with the testing and network testing products.

Here’s what you are now able to do through the settings screen:

  1. Update your API key
  2. Configure qualityRTC’s email delivery, webhook and password
  3. See who has access to the project

Webhooks

As we expand our user base and products portfolio, we get more and more requests for integrations. These include the need to provide webhook support.

We decided in this release to streamline and standardize the way we invoke webhooks and to offer richer formatting options. These now include templating, AWS SNS and CloudEvents among other options.

Check out our webhook formatting options.

Testing & Monitoring

Analysis

We’ve overhauled our graphs on the single probe results. The new view is a lot more powerful. Here’s a quick overview of what that means:

To make things even better, in the Advanced WebRTC Analytics, we’ve gone ahead and polished the interface as well:

  • Static metrics that had no real use were removed
  • Metrics we thought were less important are now disabled by default
  • A toggle button was added to the legend, to make it easy to quickly select one or two metrics and display only them

Stress Testing

  • We now ignore #har-file and #pcap run options on tests with more than 4 probes or longer than 10 minutes. These log files are heavy and affect performance, so we make sure to disable them on stress tests
  • With large tests there’s a pagination mechanism to go through the probes. The pagination buttons are now placed at the bottom of the table as well as at the top
  • We are deprecating #no-internals run option and replacing it with a #webrtc-internals run option:
    • Not setting it will collect webrtc-internals for tests with a #timeout shorter than 30
    • Setting it to true will always collect webrtc-internals
    • Setting it to false will not collect webrtc-internals
  • We’ve added the pagination bar for the probes list in test results to both the top and the bottom of the probes list. This makes it easier to navigate through them

Testing

  • We now automatically allow using HTML5 Geolocation APIs in tests
  • Exporting test results of a single test now provide more metrics
  • Exporting test results of multiple tests from the History page now… works
  • The API now includes an option to change the session size of a test when running it, making it easier to create programmable variations of tests

Monitoring

Monitoring ribbons have been rewritten to make them more useful.

They now include information about the last 15 days, showing the distribution of daily monitor runs.

qualityRTC

We’ve got a new page on our website for qualityRTC! But I am guessing you’re here for the new capabilities of this product 😉

  • When there are any issues found, the log button will show a red indication of that
  • In the same spirit, when a specific test has issues found for it, it will list them next to its icon. Clicking the icon on the top left corner of each results widget will get you right to the relevant point in the log
  • We’ve made camera and microphone access failures more verbose and explanatory, making them easier to figure out and troubleshoot
  • We now collect and log the cores count of the machine running the test
  • New silent test: GPS Location. We can now collect the GPS location of the user and place it in the log
  • New silent test: Hardware availability. We can now try and figure out if hardware acceleration is used for video calls
  • Call Quality test
    • The widget now writes to the log both incoming and outgoing metrics
    • Call Quality widget can now be configured to show one of 3 different layouts:
      1. Inbound only – this is the default view we had until today
      2. Combined – shows in a single column the highest value from inbound and outbound metrics for packet loss and jitter
      3. Detailed – double column, splitting inbound and outbound
    • We now put in the log additional information such as the network type and IP+port pair of the connection
  • Location widget
    • Can now be configured to not display the “show on map” link
    • IP insights add-on will also indicate cloud hosted machines
  • Privacy
    • Those with BI Analytics enabled can now delete test results
    • We can now automatically scrape email and IP addresses from test results after a configurable number of days
  • Entry fields in test can now be hidden if provided via URL parameters
  • BI Analytics grid improvements
    • We’ve made searching the table easier with a new global search option at the top of the grid
    • We now shows video metrics as well if these are collected by your configuration
  • Clients who have the account field configured can now edit its value in the backend dashboard

probeRTC

Installable service

  • We can now offer probeRTC as an installable daemon application
  • This works for Windows and Mac

Video graphs

  • probeRTC is being adopted by more clients. Up until now, our focus has been call centers, but it seems other types of vendors are in need of this service as well – ones that also handle video calls
  • This is why in this release, we’ve added graphs for the video tests that probeRTC can conduct

watchRTC

We are working on a new product for passive monitoring of your users’ WebRTC metrics.

This is still running in private beta with select clients. We are expanding the list of clients we work with on it on a weekly basis – reach out to us if you want to join the beta.

How to test screen sharing using testRTC

Like everything else you can do with WebRTC, screen sharing is natively supported by testRTC. There are though a few things you should be aware of and prepare in advance with if you want to test and validate your screen sharing feature with testRTC.

1. Understanding browser tabs in testRTC

When using screen sharing, you are going to move between tabs.

testRTC may or may not open chrome://webrtc-internals tab for its own use, which can confuse certain scripts.

This is why we make use of process.env.RTC_EXTRA_TABS environment variable. You can learn more about switching windows and tabs in testRTC.

2. Use run options to grab the whole screen

You can’t automate the screen picker modal of Chrome. What you can do instead is let Chrome know you wish to override that modal and always capture the whole screen.

To do that, add the following string to your run options:

#chrome-cli:auto-select-desktop-capture-source=Entire screen,enable-usermedia-screen-capturingCode language: PHP (php)

3. Pick a video to share

With WebRTC, a user is likely to click a screen sharing button and then move on to a different tab in his browser or a different application that he is sharing. You’d want to do that as well, to keep the screen that WebRTC encodes as dynamic as possible.

For that purpose, think of a YouTube video that you would want to share. My preference is a movie preview, but that’s not always what you’re looking for. Here are two alternatives we use from time to time:

  1. A rather static presentation (this link)
  2. Big Buck Bunny – a classic… (this link)

Notice that we use the following URL format for YouTube:

youtube.com/embed/?playlist=<video-id>&autoplay=1&loop=1

  • embed causes the video to load in full screen mode
  • autoplay will… auto play the video
  • loop will cause the video to loop once completed, so you don’t have to worry about its length

4. Tab switching

Once you click the share button on your UI, it is time to open a new and open that YouTube video URL.

Here’s how we do it usually:

function startedSharing() {
    client
        .rtcEvent('Screen Share ', 'global')
        .rtcScreenshot('screen share')

        .execute("window.open('" + videoURL + "', '_blank')")
        .pause(5 * sec)

        // Switch to the YouTube tab
        .windowHandles(function(result) {
            var newWindow;
            newWindow = result.value[1+Number(process.env.RTC_EXTRA_TABS)];
            this.switchWindow(newWindow);
        });
}
Code language: JavaScript (javascript)

A few observations here:

  • You can place this function as one of your assets
  • Adding an event using rtcEvent() at the beginning comes in handy when you’ll view the resulting graphs in the end
  • The videoURL is that YouTube URL we’ve shared earlier. Use a variable for that so it will be easier to search and modify based on your needs
  • Actual window switching is done using pure Nightwach commands

If you want/need to switch back and stop screen sharing, you can use this piece of code:

function stoppedScreensharing() {
    client.windowHandles(function (result) {
        var newWindow;
        newWindow = result.value[Number(process.env.RTC_EXTRA_TABS)];
        this.switchWindow(newWindow);
    });
}Code language: JavaScript (javascript)

Just don’t forget to click the stop screen sharing button in your UI afterwards.

5. Select who is going to screen share

Use our sessions mechanism to split your test into sessions (a session is a room usually). In each session, have a single probe screen share and the rest designated viewers.

Here’s how you can do that:

var probeIdx = Number(process.env.RTC_IN_SESSION_ID);
var sec = 1000;

if (probeIdx === 1) {
    // Screen share here
}

client.pause(60*sec);

if (probeIdx === 1) {
    // Stop screen sharing here
}Code language: JavaScript (javascript)

6. Take a screenshot on the viewers’ side

For debugging purposes, you can use rtcScreenshot() to take a screenshot of what gets shared for those who aren’t screen sharing.

How Blitzz shifted to self service WebRTC network testing with testRTC

The Blitzz Remote Support Software is a flexible, scalable, and affordable solution for SMBs, mid-market, and well-established enterprises. Blitzz is helping service teams safely and successfully transition to a remote environment. The three-step solution to powerful visual assistance requires no app download. Customer Care Agents can clearly see what’s happening and offer remote guidance to quickly resolve issues without having to travel to the customer.

Keyur Patel, CTO and Co-founder of Blitzz describes how qualityRTC supports blitzz.co:

qualityRTC helped us focus on what we do best, and that’s providing an easy to use solution for remote video assistance over Browser; instead of having to worry about diagnosing different network issues. We really enjoy the direct support and quick communication the team at qualityRTC has given us in setting up and further developing our integration with them.

Here’s a better way to explain it:

Blitzz selected testRTC’s network testing product, qualityRTC. With it, they are able to quickly assist its clients when they encounter connectivity or quality issues with the service. We’ve been working closely with Blitzz in recent months, in order to fit the measurements and tests to their needs. One of the things that were added due to this partnership was our Video P2P test widget. I thought it would be interesting to understand what Blitzz is doing exactly with testRTC, and for that, I reached out to Keyur Patel, CTO and Co-founder of Blitzz

Understanding networks and devices

Blitzz aims to offer a simple experience. For that, it makes use of WebRTC and the fact that it is available in the browser. This makes it easy for the end users and there is no installation required for it. You can direct end users towards a URL and it will open up in their browser. The challenge though, is that with the proliferation of devices out there, you don’t control which exact browser and device is used by each user.

On the customer’s side, the agents are almost always operating from inside secure and restricted networks. They also have limited bandwidth available to them. When deploying the service to a new customer, this question comes up time and time again:

Can the agents connect to the Blitzz infrastructure?

Are the required ports opened on the firewall by the IT team? Do they have enough bandwidth allocated to them?

Finding suitable solutions

Solving connectivity issues is an ongoing effort. To that end, Blitzz were using a combination of analysis tools available freely on the Internet. These included test.webrtc.org, speed testing and the network diagnosis tool available from the CPaaS provider they were using.

This worked out well, but it was not very efficient. This process would take a couple of meetings, going back and forth, in order to collect all of the information, troubleshoot things and retries to get things done right.

It wasn’t the best experience, asking customers to go through 3 different URLs to make sure and validate that they had full connectivity.

Using qualityRTC

Keyur was aware of testRTC and knew about qualityRTC. Once he tried the tool, he saw the potential of using it at Blitzz.

After a quick integration process, Blitzz were able to troubleshoot customer issues with ease. This enabled them to provide a sophisticated service instead of gluing together multiple alternatives.

qualityRTC shined once the pandemic hit, and agents started working from home. Now the agents were running on very different networks, each in his one environment. While it was fine asking for an IT person to run multiple tools when onboarding to the service, doing that at scale increased the challenge.

By using qualityRTC, Blitzz was able to direct its customer base to a single tool. This allowed the agents to quickly and efficiently conduct these speed tests and connectivity tests, especially at times where quality of internet services was fluctuating.

Streamlining the process

“When we needed a solution for testing P2P connectivity based on our use case, the team at testRTC were able to quickly add features and deliver it in qualityRTC tool.”

Blitzz has embedded qualityRTC in their application for most of their users to diagnose connectivity issues during a video session. This allows end users to self test and diagnose issues by looking at the results on their own. If for some reason they still had to reach Blitzz Support, Blitzz support team could quickly review the log data collected by qualityRTC from their Network Test.

qualityRTC helped Blitzz increase customer satisfaction and reduce the friction in onboarding over several thousand customer care agents in a matter of days. This also reduced the number of support tickets as end users had all the information needed for resolving connectivity issues through the qualityRTC test portal.

Today, qualityRTC is an integral part of the Blitzz solution. This enables Blitzz to offer a better customer service and experience, while maintaining lower support costs.

Webhooks in testRTC

testRTC enables the use of webhooks to catch a rich set of events within the system. These can be used for testing as well as monitoring. These are most often used for things like;

  • Notifications
  • Run results
  • Custom alerts

URL only

If you place in the webhook the URL only, we will be sending it out as a JSON object.

https://dummy.url

JSON object

The webhook configuration below sends the information as a JSON object in the body of the message.

{
   "format": "json/object",
   "url": "https://dummy.url"
}

JSON text format

If you are planning to integrate the webhook with something like Slack or Zapier, then the best approach is to use a JSON text format, where we “stringify” the information.

{
   "format": "json/text",
   "url": "https://dummy.url"
}

You can read more on sending test results via webhook to Slack.

CloudEvents

Here is how to send our webhooks as CloudEvents v1.0 format:

{
   "format": "cloudevent",
   "url": "https://dummy.url"
}

The above will send the webook to “url” formatting the body of the message as CloudEvents format.

Amazon SNS

If you plan on sending the webhook to Amazon Simple Notification Service, then you can use the following format:

{
    "provider": "aws-sns",

    "secretAccessKey": "xxx",
    "region": "xxx",
    "accessKeyId": "xxx",

    "roleArn": "xxx",
    "topicArn": "xxx",

    "body": {
      "Server": "TestRTC",
      "Instance": "<%this.runName%>",
      "Severity": "TestRTC",
      "Message": `testRTC Alert for <%this.testName%> 
      <%this.runName%> 
      error:<%this.error%> 
      url:<%this.resultUrl%> 
      failure:<% this.failureScreenshot %>`,
    }
}

Custom body templating (limited application)

Note: Custom body templating is not available for all products. It can only be used with testingRTC and upRTC

For testingRTC and upRTC, you can also format our webhook as you see fit using our body templating format. Below is an example for it.

{
    "url": "https://testrtc-webhook-director.netlify.app/.netlify/functions/slack-message-director",
    "body": {
      "testRunId": "<%this.testRunId%>",
      "testName": "<%this.testName%>",      
      "userName": "<%this.userName%>",      
      "projectName": "<%this.projectName%>",
      "projectId": "<%this.projectId%>",      
      "status": "<%this.status%>",
      "concurrentUsers": "<%this.concurrentUsers%>",
      "numberOfProbesSuccess": "<%this.numberOfProbesSuccess%>",
      "numberOfProbesWarning": "<%this.numberOfProbesWarning%>",
      "numberOfProbesFailure": "<%this.numberOfProbesFailure%>",
      "totalTestTimeMin": "<%this.totalTestTimeMin%>",
      "score": "<%this.score%>",
      "runName": "<%this.runName%>",
      "runType": "<%this.runType%>",
      "error": "<%this.error%>",
      "additionalInfo": "<%this.additionalInfo%>",     
      "failureReasons": "<%this.failureReasons%>",
      "failureScreenshot": "<%this.failureScreenshot%>",
      "resultUrl": "<%this.resultUrl%>"
    }
  }

Custom variables

You can pass certain variables to the webhook in its advanced format. This is useful for collecting information and when you want to format the message itself.

VariableDescription
testRunIdIdentifier of the specific test execution
testNameThe name of the test script
projectNameThe name of the testRTC project running this test
runNameThe random name allocated for the specific test execution
runTypeThe type of execution. Will be either test or monitor
statusThe status of the test execution (essentially, if it succeeded or failed)
errorAssociated error message in case the test failed
additionalInfoThe information provided via rtcSetAdditionalInfo()
failureReasonsTextual reason for failure
failureScreenshotURL to the screenshot taken on failure, if such exist
scoreMedia score for the test execution
resultUrlURL to the test result for easy access
concurrentUsersTotal number of probes in the test execution
numberOfProbesSuccessNumber of probes in the test execution with a successful result status
numberOfProbesWarningNumber of probes in the test execution with a warning result status
numberOfProbesFailureNumber of probes in the test execution with a failure result status
totalTestTimeMinFull length of the test execution in minutes
userNameThe name of the user who executed the test

Note: You can integrate these variables anywhere in the body section of your webhook by placing them in <% %>

For example:

{
  "url":"https://webhook-destination.com",
  "body":{
    "testRunId":"<%this.testRunId%>",
    "testName":"<%this.testName%>",
    "runName":"<%this.runName%>",
    "status":"<%this.status%>",
    "error":"<%this.error%>"
  }
}

What network ports does qualityRTC use?

For its own use, qualityRTC requires port 443 to be open and reachable.

For anything that is WebRTC infrastructure specific, the required ports are similar to those of the service being tested. This is due to the fact that qualityRTC integrates with that infrastructure to conduct its connectivity and network quality checks.

testRTC December 2020 Release Notes

New Product: watchRTC in Private Beta

We have now added a new passive monitoring service, which collects metrics and data from real users running your system.

Why use testRTC for this?

  • Enjoy the same look and feel, as well as the level of depth and analysis we offer today in our testingRTC and upRTC product – but on your own users’ sessions
  • Fast to load, simple to use. Just as you’d expect from our other services

For now, this product is in private beta. If you’d like to join the private beta, contact us.

Facelift

We’ve introduced a new dashboard recently, to better fit the growing number of product lines we now offer at testRTC.

The new dashboard makes the information more accessible and will show data only to the products you’ve licensed, reducing clutter.

We also introduced estimated test runs for qualityRTC and we plan on expanding it to other products soon.

Other than that, we added more breadcrumbs to make navigating back and forth easier.

Testing & Monitoring

Analysis

In recent months we’ve seen an increase in the size of tests our clients want to run. We are working hard these days in improving and beefing up our service:

  • Large tests results load slightly faster, using less memory and CPU while doing so
  • We are now calculating scores properly when some of the probes fail to connect or collect media results

As in previous releases, we’re making it easier to read and analyze the results:

  • Probe results now indicate the session sizes, so you don’t need to browse back
  • Channels now show their start time and duration when you expand the channel details

Stress Testing

Large tests are different in nature. We’ve seen many clients using a growing number of probes in their tests recently, and we’ve added a few unique features towards these use cases:

  • Best effort. Tests with more than 50 probes in them will run in a new best effort mode. This means that if not all probes were allocated at the beginning of the test (something that has a higher probability of happening the larger the test is), then the test will still execute with a lower number of probes. Learn more here

Testing

  • .rtcCallWhenDone() is a new script command that enables you to create a function that will be called when testRTC wraps the test script – even if it fails prematurely
  • .rtcCaptureCallData() now allows choosing the tab holding chrome://webrtc-internals. This is useful for restrictive services such as proctoring applications
  • .rtcSetMetricFromThresholdTime() can now be used to calculate the time from a given event until metric values reach certain thresholds. This can be used for performance and bandwidth estimation purposes
  • .rtcSetTestExpectation() – support for new metrics:
    • We now support machine specific expectations such as CPU, memory and network data
    • We now support more getstats metrics such as NACK and PLI counts
  • A new environment variable RTC_SESSION_COUNT can be used to get the number of sessions allocated in a test
  • Tests now collect machine performance metrics by default. You can use the run option #perf:false to disable this collection if needed

APIs

We’ve introduced more metrics out of test results so you can now collect and build your own dashboards:

  • /testruns/{testId}/?detailed=true now retrieves more metrics data out of a test run
  • /testagents/{testAgentId}/files was added. Now you can download the collected test data such as browser log and webrtc-internals dump file
  • APIs got polished a bit, some were added a few additional fields

qualityRTC and probeRTC

We’ve got the release notes for these products separately this time, published earlier.

qualityRTC/probeRTC December 2020 release notes

rtcSetMetricFromThresholdTime()

Calculate the time it takes for a media related metric value to reach a certain threshold from an event and store that time in a custom metric.

Arguments

NameTypeDescription
keystringThe name of the metric to set.
event namestringThe name of the event to start the timer from. Events are created using rtcEvent().
criteriastringThe criteria threshold where the timer should be stopped. Similar to rtcSetTestExpectation().
aggregatestringThe type of aggregation to use for this custom metric across agents in the same test run:   “sum” – Sum the metric’s value across all agents “avg” – Calculate the average of this metric’s value across all agents.

Supported criteria

The following criteria are supported:

  • [video|audio].[in|out].bitrate – expressed in Kbits
  • video.[in|out].fps – expressed in integer values

Code examples

client
  .rtcSetMetricFromThresholdTime("timeTo1Mbps", "CallStart", "video.out.bitrate > 1000", "avg");Code language: JavaScript (javascript)

The example checks the time it took the probe to reach 1 Mbps of outgoing video bitrate, placing it in a custom metric called timeTo1Mbps and aggregating it as average across probes in the test.

testRTC December 2020 Release Notes for qualityRTC

The December release here is LARGE, so we’re splitting it into two separate announcements. First one is about qualityRTC and probeRTC – our support facing solutions.

qualityRTC: Network Testing

We are seeing tremendous interest and adoption of qualityRTC, as such, we have been iterating quickly on client requests and feedback for this product.

In general, the documentation for qualityRTC in our knowledge base has been needed up considerably.

New tests

  • A new silent DNS Settings test is now available
    • In it, we try to figure out the DNS servers configured for the user
    • The result is written in the log and includes a list of IP addresses, their geographic location and corporation they belong to
  • Out-of-the box support for Frozen Mountain LiveSwitch is now available
  • We can now collect the device names for microphone and camera and place it in the test log
  • We now offer Speed testing machines and TURN servers as on premise installations. If you would like to run accurate tests for your data center, then these are now available

New features

  • The Video Quality widget now provides more information, splitting metrics between incoming and outgoing media streams
  • Since the LOG is becoming a more important part of the test results, we’ve decided to make its window larger. Expect additional improvements here moving forward
  • Test ID now shows on the result page, making it easier to communicate between the end user and your support team
  • Email and reason fields can now be customized
    • Clients can change them to anything they see fit (name and case number, etc)
    • Additional fields can be added if needed
  • A new configuration enables discouraging search engines from indexing your network testing page
  • You can now use ?run= URL parameter to run only specific tests out of the tests conducted. Learn more here
  • We have added a new account field that can be used as a URL parameter. Learn more here
  • We’ve optimized how we load the qualityRTC page for our users
    • The page is now considerably smaller in size and faster to load
    • We now load only the pieces of tests you need and do that on demand
  • We can now configure a webhook for tests conducted in qualityRTC
    • The webhook will be invoked whenever a test was executed, or when certain test result thresholds are met (warnings or faulty results)
    • A JSON blob with all metrics collected is provided (more details here)
    • This means you can now collect and analyze that data within your own BI environment
  • Alert thresholds are now available. Up until now, you either received an email on each test conducted or never. You can now receive such an email only if certain threshold conditions are met
  • BI/Analytics table has been improved
    • If new tests are available, they will now be indicated on a new refresh button
  • Grouping now shows averages on metrics collected. The screenshot below marks in yellow the average values of the specific location that was expanded (there were 3 network tests conducted in that location)
  • Export function exports more data, including browser, operating system and device names
  • You can now search for a specific network test result based on its id
  • Added the IP address, so you can group or search by it

probeRTC: Zero install network probes

  • Alert thresholds are now available. When the probe’s results are within the acceptable limits you can now configure it to send out an alert email
  • We’ve created a new explainer video about this product

1 8 9 10 11 12 32