qualityRTC enables the use of client specific accounts.
By default, users can enter their email and reason. There is a possibility of adding additional custom fields for the user to fill out, but there is also an option to add an account field.
The account field can only be populated via the ?account= URL variable.
Once populated, it will appear in the backend dashboard for you to filter and review.
This enables easy grouping and identification of certain network tests to specific accounts and organizations.
If you need us to enable support for the account field in your project, let us know.
When conducting large stress tests, there is always a possibility that the number of probes you have asked to be allocated will not be granted. This isn’t due to testRTC directly, but rather due to the cloud vendors we use: The larger the number of probes we need to dynamically allocate in the cloud, the more the probability that some of these probe allocations will fail due to the cloud vendor’s own reasons.
This can be frustrating and wasteful when it comes to resource planning, and in many cases, what you actually want is to get as close as possible to that target number – allocating and running 996 probes instead of 1,000 would be a reasonable compromise for most.
When will best effort be invoked?
For that reason, from a certain test size (50 probes or more), testRTC will switch to using its Best Effort mode. This means that tests will run even if some of the probes fail to allocate for whatever reason.
In best effort mode, you will only be charged on probes that were actually allocated and used for the test run.
One important aspect here is that if a certain threshold of probes cannot be allocated, we will still fail the test and not run it – assuming that if you want a test with 1,000 probes and only 50 could be allocated – you’re not interested in it any more. That threshold is set to 5% by default and is configurable.
How to manually set best effort mode on and off?
You can use #probe-failure-moderun option, with the following values:
Value
Description
auto
This is the default value of the best effor mode. Let testRTC decide automatically if it makes sense to use best effort mode or not: Below 50 probes in a test, the test runs only if all probes were successfully allocated Above 50 probes and with session size smaller than 10, the test runs in be-session mode (see below) Above 50 probes and with session size 10 or larger, the test runs in be-probe mode (see below)
exact
Force testRTC to run the test only if all probes were successfully allocated
be-probe
Allow testRTC to run tests even if not all the probes were allocated. Use all probes that were allocated in the test
be-session
Allow testRTC to run tests even if not all the probes were allocated. Make sure to use probes only if they fill out the sessions properly. For example, if the session size is configured to 4, and on best effort 497 probes out of 500 were allocated successfully, then only 496 will be used for the test.
The failure threshold of best effort is set to 5% and can be configured using #best-effort-thresholdrun option.
As a company designed and built around WebRTC, we understand both VoIP and Web worlds, and the challenges and opportunities that they bring. Our insights, together with inputs received from leading WebRTC solutions providers and developers were translated into WebRTC expertise and testing best practices.
Our testRTC solution was designed and implemented with the goal to help you to test, operate, and optimize your WebRTC applications by following the described testing best practices.
If you decide to use testRTC or not is something you need to decide on your own. That said, here are tests you should conduct on your WebRTC product. It is the baseline that we suggest our customers focus on first with their products.
This best practices guide covers the following test areas:
Here the focus is to test different types of call and situations:
Peer to Peer, typically 2 participant call running for longer duration – 20 min / 40 min / 60 min / 90 min
Group calls with a different number of participant
Group call running for longer duration – 20 min / 40 min / 60 min / 90 min
Participants joining, ending and rejoining from ongoing call
New participants joining and old participants ending the call
Find Max Session Size: the number of participants that can fit into a single session together
Check metrics (bitrates, packet loss and general stability) versus smaller session sizes
Find where metrics start to deteriorate and when metrics are unacceptable
2. Media Testing
The Idea is to used different media types and check how the bitrates and other metrics are handled:
Use 1080p inputs and see how it affects session bitrate and server-side load
Use 720p and VGA inputs and see if bitrate gets lowered considerably (WebRTC has a tendency of over-using bandwidth in lower resolutions by default)
Work in different simulated networks and see how it affects metrics
Note that the media files of testRTC come in different resolutions. The browser later scales down this raw input media to the resolutions needed for its own scenario.
3. Network Testing
Check Calls in different network conditions and combinations: look for how bitrates are maintained and changed to accommodate different bandwidth availability.
Combine 3-1 and 2
Simulate mid-call High packet loss or High Latency conditions
Simulate Call Drops for different users and check how the recovery takes place
Simulate Bandwidth change in the call and check how the service handles these. E.g. From Wifi to 4G to 3G to 2.5 G
Above should be done for the different type of users and how the situation is handled need to be reviewed
One of the leading factors to quality issues with WebRTC is the distance between the user and your backend infrastructure. Even if there is a nearby server, there can be limiting factors such as the use of a VPN service by your customer or just bad routing rules, that get your user connected to the wrong server.
Here is how bad routing tend to look like in qualityRTC:
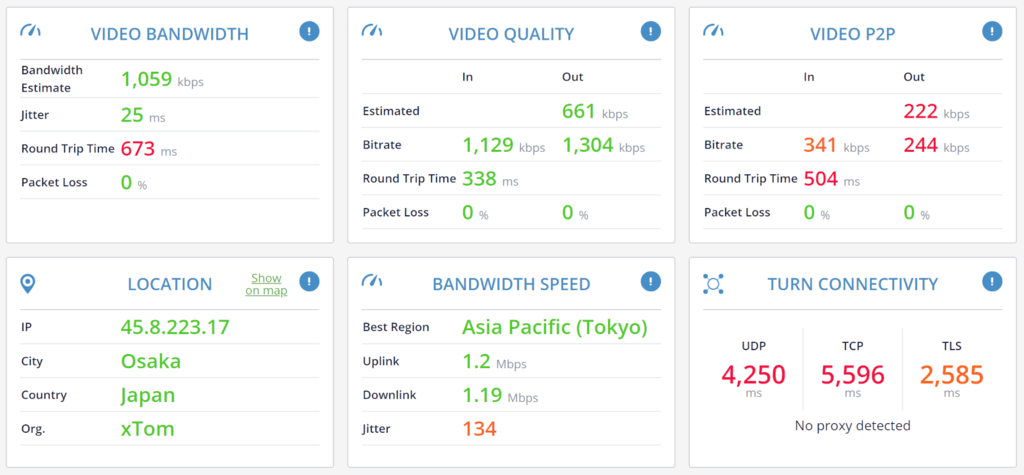
The WebRTC network test above was conducted in Israel, using a ProtonVPN client that was connected to a VPN server in Japan.
Here’s what we can see:
VIDEO BANDWIDTH shows very high Round Trip Time (marked in red). This will result in poor quality and high latency for a video conversation
VIDEO QUALITY and VIDEO P2P also show high Round Trip Time values
VIDEO P2P shows low bitrate (it usually gets to 2Mbps)
LOCATION shows the user is in Japan, while we know he is located elsewhere (in Israel)
BANDWIDTH SPEED shows high jitter on uploading and downloading over HTTPS, with very poor connections of around 1.2Mbps
TURN CONNECITIVTY shows slow connection times, but is still capable to connect UDP
What to do in such a case?
Ask your user if he is using a VPN. If he is, suggest removing it or configuring it in a way to allow WebRTC traffic to go unhindered for your service
qualityRTC is quite suitable for testing network conditions of WebRTC video applications. These can be web and video conferencing and collaboration applications, telehealth services, remote education applications, etc.
There are 3 test widgets uniquely developed to address WebRTC video specific issues:
VIDEO BANDWIDTH – for understanding general outgoing available video bandwidth
VIDEO QUALITY – for direct connectivity tests to media servers
VIDEO P2P – for testing peer-to-peer connection scenarios
These widgets can be customized to work directly with your video backend infrastructure.
Here is our qualityRTC demo in action for a video-based application:
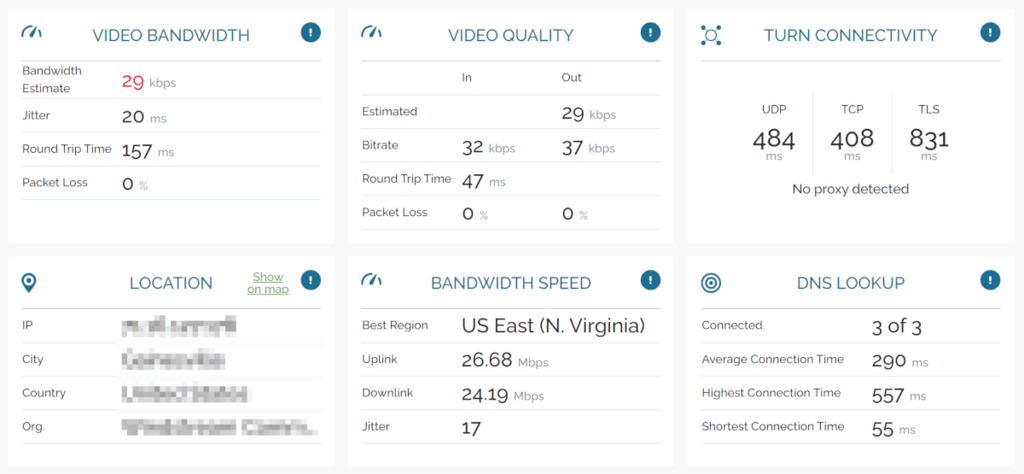
In the screen shot below, a user comes with a result in qualityRTC that shows low VIDEO BANDWIDTH bitrates while BANDWIDTH SPEED is showing high bitrates.
Here is what we can glean out of the information:
TURN CONNECTIVITY shows that the user’s network is open to UDP traffic and round trip time is low (the time it takes to connect to the UDP and TCP TURN servers is below 500ms)
Both VIDEO BANDWIDTH and VIDEO QUALITY shows bitrate estimation of 29 kbps which is very low
VIDEO QUALITY shows bitrates of 32-37kbps for the actual video sent and received, which is very low
BANDWIDTH SPEED shows high bitrates of 24-26Mbps on the uplink and the downlink
BANDWIDTH SPEED refers to HTTPS traffic, taking place over TCP.
VIDEO BANDWIDTH and VIDEO QUALITY traffic takes place over UDP by default.
The reason for the difference might stem from throttling of UDP traffic that is done by the user’s firewall.
What to do in such a case?
Check if UDP is being throttled directly for that user
Check if the firewall is configured to block P2P encrypted traffic or bittorrent traffic. Such features are known to also block and throttle WebRTC traffic
“testRTC is the defacto standard for providing reliable WebRTC testing functionality.”
Paul Fisher, CTO and Co-Founder at Vowel
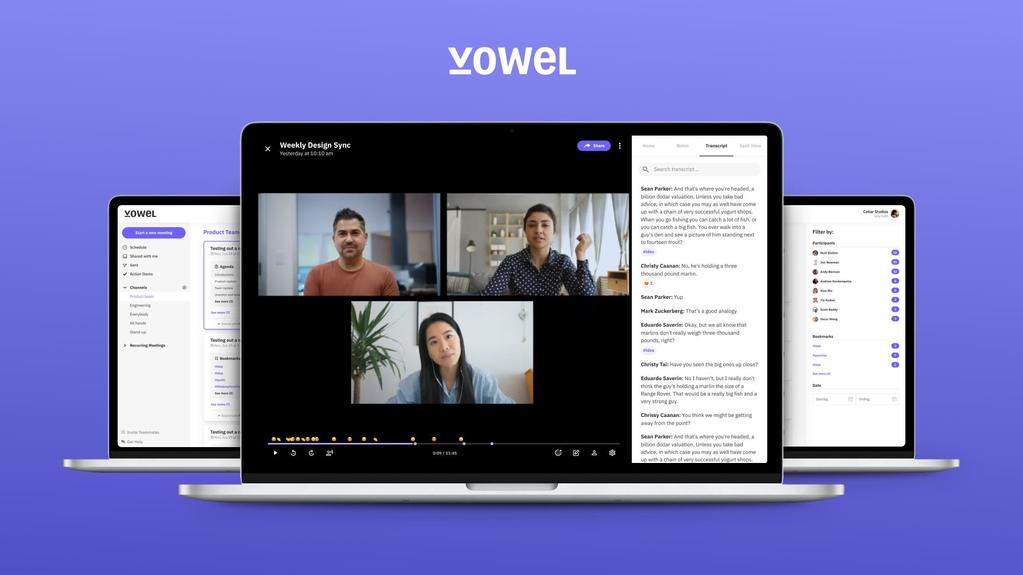
There are many vendors who are trying to focus these days on making meetings more efficient. Vowel is a video conferencing tool that actually makes meetings better. It enables users to plan, host, transcribe, search, and share their meetings. They are doing that right from inside the browser, and make use of WebRTC.
Vowel has been using testRTC throughout 2020 and I thought it was a good time to talk with Paul Fisher, CTO and Co-Founder at Vowel. I wanted to understand from him how testRTC helps Vowel improve their product and its user experience.
Identifying bottlenecks and issues, scaling up for launch
One of the most important things in a video conferencing platform is the quality of the media. Before working with testRTC, Vowel lacked the visibility and the means to conduct systematic optimizations and improvements to their video platform. They got to know testRTC through an advisor in the company, whose first suggestion was to use testRTC.
In the early days, Vowel used internal tools, but found out that there’s a lot of overhead with using these tools. They require a lot more work to run, manage and extract the results from the tests conducted. Rolling their own was too time consuming and gave a lot less value.
Once testRTC was adopted by Vowel, things have changed for the better. By setting up a set of initial regression tests that can be executed on demand and through continuous integration, Vowel were able to create a baseline of their implementation performance and quality. From here, they were able to figure out what required improvement and optimization as well as understanding if a new release or modification caused an unwanted regression.
testRTC was extremely instrumental in assisting Vowel resolve multiple issues around its implementation: congestion control, optimizing resolution and bandwidth, debugging simulcast, understanding the cause and optimizing for latency, round trip time and jitter.
Vowel were able to proceed in huge strides in these areas by adopting testRTC. Prior to testRTC, Vowel had a kind of an ad-hoc approach, relying almost entirely on user feedback and metrics collected in datadog and other tools. There was no real methodical way for analyzing and pinpointing the source of the issues.
With the adoption of testRTC, Vowel is now able to reproduce issues and diagnose issues, as well as validate that these issues have been resolved. Vowel created a suite of test scripts for these issues and for the scenarios they focus on. They now methodically run these tests as regression with each release.
“Using testRTC has had the most significant impact in improving the quality, stability and maintenance of our platform.”
This approach got them to catch regression bugs earlier on, before potentially rolling out breaking changes to production – practically preventing them from happening.
Reliance on open source
Vowel was built on top of an open-source open source media server, but significant improvements, customizations and additional features were required for their platform. All these changes had to be rigorously tested, to see how they would affect behavior, stability and scalability.
On top of that, when using open source media servers, there are still all the aspects and nuances of the infrastructure itself. The cloud platform, running across regions, how the video layouts, etc.
One cannot just take an open source product or framework and expect it to work well without tweaking and tuning it.
Vowel made a number of significant modifications to lower-level media settings and behavior. testRTC was used to assess these changes — validating that there was a marked improvement across a range of scenarios, and ensuring that there were no unintentional, negative side effects or complications. Without the use of testRTC, it would be extremely difficult to run these validations — especially in a controlled, consistent, and replicable manner.
One approach is to roll out directly to production and try to figure out if a change made an improvement or not. The challenge there is that there is so much variability of testing in the wild that is unrelated to the changes made that it is easy to lose sight of the true effects of changes – big and small ones.
“A lot of the power of testRTC is that we can really isolate changes, create a clean room validation and make sure that there’s a net positive effect.”
testRTC enabled Vowel to establish a number of critical metrics and set goals across these metrics. Vowel then runs these recurring tests automatically in regression and extracts these metrics to test and validate that they don’t “fail”.
On using testRTC
“testRTC is the defacto standard for providing reliable WebRTC testing functionality.”
testRTC is used today at Vowel by most of the engineering team.
Test results are shared across the teams, data is exported into the internal company wiki. Vowel’s engineers constantly add new test scripts. New Scrum stories commonly include the creation or improvement of test scripts in testRTC.Every release includes running a battery of tests on testRTC.
For Vowel, testRTC is extremely fast and easy to use.
It is easy to automate and spin up tests on demand with just a click of the button, no matter the scale needed.
The fact that testRTC uses Nightwatch, an open source browser automation framework, makes it powerful in its ability to create and customize practically any scenario.
The test results are well organized in ways that make it easy to understand the status of the test, pinpoint issues and drill down to see the things needed in each layer and level.
testRTC runs in the cloud by default. The probes we use that simulate live users come from the public internet. As such, if your WebRTC implementation is installed on a local network, on a machine or a lab, and you need it tested, then the way to go is to do the following:
Use ngrok (or similar)
You can configure a public server to act like a proxy that tunnels all signaling towards your local server.
Since you are using a local server, the certificate used is going to be self signed. Chrome doesn’t like these types of certificates, so you’ll need to tell Chrome to just ignore it.
For that purpose, add to the run option of the test the following line:
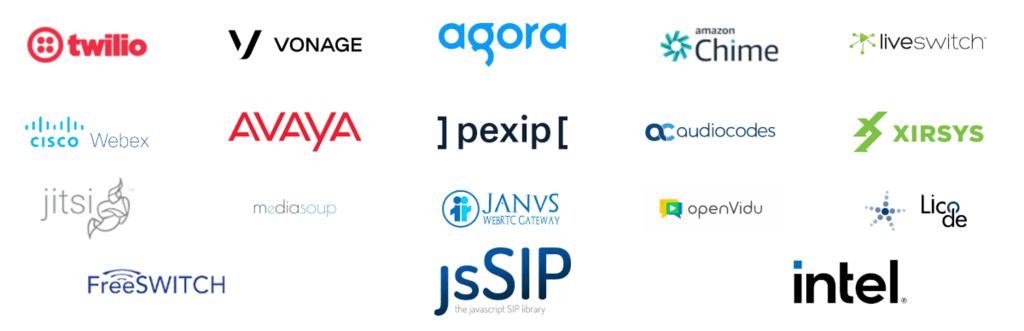
qualityRTC is designed to work with virtually any WebRTC infrastructure. In the initial setup and customization page of onboarding a new client to qualityRTC, we implement the necessary parts to get these integrations up and running.
Our team has been doing that for quite some time, and we have an extensive and growing library of backend WebRTC servers that we’ve already integrated with.
Here are some of the supported implementations we have (if you use them, then the setup part of onboarding to qualityRTC will be simpler):