Category Archives for "Analysis"

We acquired Callstats 🥳 What does that mean for the future of WebRTC monitoring?

Spearline has acquired Callstats.  

We have some exciting news to share! After acquiring testRTC a year ago. WebRTC monitoring is now in the best hands.

If you’re not aware, Callstats offers a passive monitoring solution for WebRTC applications. You embed their SDK (software development kit) within your application, it then siphons the metrics it needs to its servers for further analysis – similar in many ways to our watchRTC product.

Before continuing, I’d like to welcome all the Callstats customers to the Spearline family. We are here to help you and grow together with you.

For me personally this is a very exciting day. Co-founding testRTC and operating it for many years, we’ve been following Callstats from the sidelines. A year ago, Spearline acquired testRTC and here I am now, as the Chief Product Officer at Spearline –  looking after the roadmaps of all the communication testing and monitoring products. 


Why we’ve acquired Callstats 

Our success has been and continues to be, dependent on your success. We know many of you already use WebRTC technology or are accelerating its adoption.

In the WebRTC monitoring market,  Callstats and NIH (the not-invented-here approach of companies developing their monitoring solution in-house) were our main competitors.

However, following on from our acquisition of testRTC last November and now Callstats –  we’re now the world leading vendor in WebRTC testing and monitoring. No other vendor can offer this breadth of solutions, but we won’t stop there.


Where do we go from here?

We strive to be the global leader in testing and monitoring communications technologies. 

Acquiring the top two brands in WebRTC testing and monitoring enables us to grow our market and provide you with the world’s leading all-encompassing ready-to-test solutions, no matter what technologies you use for your critical business communications. 


If you are a customer of either testRTC or Callstats – rest assured that we have your back. We will continue to serve you in the best possible way (this is what Spearline does). Our roadmap for 2023 is jam-packed with features and capabilities to help you with your WebRTC journey.

If you aren’t a customer of testRTC or Callstats but you are using WebRTC – you should ask yourself why that is:

  • Are you sure you can handle your testing and monitoring needs alone?
  • Is such an investment in tooling and not in your core business justified?
  • Will you be able to develop and maintain this tooling for years to come?

I invite you to contact us. To see demos of what our WebRTC solutions can do for you. And to talk with our dedicated team of experienced engineers and professionals on how we can make your life easier.

How can watchRTC improve your WebRTC service operations?

watchRTC is our most recent addition to the testRTC product portfolio. It is a passive monitoring service that collects events information and metrics from WebRTC clients and analyzes, aggregates and visualizes it for you. It is a powerful WebRTC monitoring and troubleshooting platform, meant to help you improve and optimize your service delivery.

Learn more about watchRTC

It’s interesting how you can start building something with an idea of how your users will utilize it, to then find out that what you’ve worked on has many other uses as well.

This is exactly where I am finding myself with watchRTC. Now, about a year after we announced its private beta, I thought it would be a good opportunity to look at the benefits our customers are deriving out of it. The best way for me to think is by writing things down, so here are my thoughts at the moment:

What is watchRTC and how does it work?

watchRTC collects WebRTC related telemetry data from end users, making it available for analysis in real time and in aggregate.

For this to work, you need to integrate the watchRTC SDK into your application. This is straightforward integration work that takes an hour or less. Then the SDK can collect relevant WebRTC data in the background, while using as little CPU and network resources as possible.

On the server side, we have a cloud service that is ready to collect this telemetry data. This data is made available in real-time for our watchRTC Live feature. Once the session completes and the room closes, the collected data can get further analyzed and aggregated.

Here are 3 objectives we set out to solve, and 6 more we find ourselves helping with:

#1- Bird’s eye view of your WebRTC operations

This is the basic thing you want from a WebRTC passive monitoring solution. It collects data from all WebRTC clients, aggregates and shows it on nice dashboards:

The result offers powerful overall insights into your users and how they are interacting with your service.

#2- Drilldown for debugging and troubleshooting WebRTC issues

watchRTC was built on the heels of other testRTC services. This means we came into this domain with some great tooling for debugging and troubleshooting automated tests.

With automated testing, the mindset is to collect anything and everything you can lay your hands on and make it as detailed as possible for your users to use it. Oh – and be sure to make it simple to review and quick to use.

We took that mindset to watchRTC with a minor difference – some limits on what we collect and how. While we’re running inside your application we don’t want to interrupt it from doing what it needs to do.

What we ended up with is the short video above.

From a history view of all rooms (sessions) you can drill down to the room level and from there to the peer (user) level and finally from there to the detailed WebRTC analytics domain if and when needed.

In each layer we immediately highlight the important statistics and bubble up important notifications. The data is shown on interactive graphs which makes the work of debugging a lot simpler than any other means.

#3 – Monitoring WebRTC at scale

Then there’s the monitoring piece. Obvious considering this is a monitoring service.

Here the intent is to bubble up discrepancies and abnormal behavior to the IT people.

We are doing that by letting you define the thresholds of various metric values and then bubbling up notifications when such thresholds are reached.

Now that we’re past the obvious, here are 5 more things our clients are doing with watchRTC that we didn’t think of when we started off with watchRTC:

#4 – Application data enrichment and insights

There’s WebRTC session data that watchRTC collects automatically, and then there’s the application related metadata that is needed to make more sense out of the WebRTC metrics that are collected.

This additional data comes in different shapes and sizes, and with each release we add more at our clients request:

  • Share identifiers between the application and watchRTC, and quickly switch from one to the other across monitoring dashboards
  • Add application specific events to the session’s timeline
  • Map the names of incoming channels to other specific peers in a session
  • Designate different peers with different custom keys

The extra data is useful for later troubleshooting when you need to understand who the users involved are and what actions have they taken in your application.

#5 – Deriving business intelligence

Once we started going, we got these requests to add more insights.

We already collect data and process it to show the aggregate information. So why not provide filters towards that aggregate information?

Starting with the basics, we let people investigate the information based on dates and then added custom keys aggregation.

Now? We’re full on with high level metrics – from browsers and operating systems, to score values, bitrates and packet loss. Slice and dice the metrics however you see fit to figure out trends within your own custom population filters.

On top of it all, we’re getting ready to bulk export the data to external BI systems of our clients – some want to be able to build their own queries, dashboards and enrichment.

#6 – Rating, billing and reporting

Interestingly, once people started using the dashboards they then wanted to be able to make use of it in front of their own customers.

Interestingly, not all vendors are collecting their own metrics for rating purposes. Being able to use our REST API to retrieve highlights for these, and base it on the filtering capabilities we have, enables exactly that. For example, you can put a custom key to denote your largest customers, and then track their usage of your service using our APIs.

Download information as PDFs with relevant graphs or call our API to get it in JSON format.

#7 – Optimization of media servers and client code

For developers, one huge attraction of watchRTC is their ability to optimize their infrastructure and code – including the media servers and the client code.

By using watchRTC, they can deploy fixes and optimizations and check “in the wild” how these affect performance for their users.

watchRTC collects every conceivable WebRTC metric possible, optimization work can be done on a wide range of areas and vectors as the results collected capture the needed metrics to decide the usefulness of the optimizations.

#8 – A/B testing

With watchRTC you can A/B test things. This goes for optimizations as well as many other angles.

You can now think about and treat your WebRTC infrastructure as a marketer would. By creating a custom key and marking different users with it, based on your own logic, you can A/B test the results to see what’s working and what isn’t.

It is a kind of an extension of optimizing media servers, just at a whole new level of sophistication.

#9 – Manual testing

If you remember, our origin is in testing, and testing is used by developers.

These same developers already use our stress and regression testing capabilities. But as any user relying on test automation will tell you – there are times when manual testing is still needed (and with WebRTC that happens quite a lot).

The challenge with manual testing and WebRTC is data collection. A tester decided to file a bug. Where does he get all of the information he needs? Did he remember to keep his chrome://webrtc-internals tab open and download the file on time? How long does it take him to file that bug and collect everything?

Well, when you integrate with watchRTC, all of that manual labor goes away. Now, the tester needs only to explain the steps that caused the bug and add a link to the relevant session in watchRTC. The developer will have all the logs already there.

With watchRTC, you can tighten your development cycles and save expensive time for your development team.

watchRTC – run your WebRTC deployment at the speed of thought

One thing we aren’t compromising with watchRTC is speed and responsiveness. We work with developers and IT people who don’t have the time to sit and wait for dashboards to load and update, therefore, we’ve made sure and are making it a point for our UI to be snappy and interactive to the extreme.

From aggregated bird’s eye dashboard, to filtering, searching and drilling down to the single peer level – you’ll find watchRTC a powerful and lightning fast tool. Something that can offer you answers the moment you think of the questions.

If you’re new to testRTC and would like to find out more we would love to speak with you. Please send us a brief message, and we will be in contact with you shortly.

Understanding a call center agent’s network in a WFH world

As we settle into 2022, it seems like call center agents may continue in their WFH (work from home) mode even beyond the pandemic. This will be done either part time or full time, for some agents or for all of them.
The reasons for that are wide and varied, but that’s probably a topic for another time. This time, I’d like to discuss what we are going to do moving forward, to ensure that those reaching out to your call center get the best call quality possible, even when your agents are working from home.

The shift of the call center agent to WFH

Since the pandemic started, those who are able to work remotely have been directed to do so. That includes call center agents – the people who answer the phone when we want to complain, book, order, cancel or do a myriad of other activities in front of businesses.
The whole environment and architecture of the call center has changed due to the new world we live in today.

In the past, this used to be the call center:

The call center PBX, the network connections to the agents, the agent’s environment (room), computer and phone have all been in our control and in our office facilities.

Now? It looks more like this for an on premise call center:

With an on premise call center and work from home agents, we’re likely to deploy an SBC (Session Border Controller) and/or a VPN to connect the agents back to the office. It adds more moving parts, and burdens the internet connection of the office, but it is the fastest patch that can be employed and it might be the only available solution if you can’t or don’t want to run your call center in the cloud.

Or this for a cloud call center:

In a cloud call center, the agents connect directly to the cloud from their home office.
Just like the on premise call center, the cloud solution ends up with some new challenges. Mainly – the loss of control:

  • We don’t control the network quality of the agent
  • The environment of the agent is out of our control
  • It is likely that the device and peripherals of the agent are still in our control. But that’s not always the case either

And, even with our best intentions in asking the agents to be on ethernet, on a good network and in a quiet environment, they can struggle with doing it well enough.

Can you hear me now?

With work from home call center agents our main challenge becomes controlling their home environment and network.

At home, agents will have noise around them. Kids playing, family members watching television, the neighbors renovating (I had my share of this one during the pandemic), or traffic noises from the street. By using better headsets and noise suppression these can be improved and even solved.

The network is the bigger headache though. Many of your agents are likely to be non-technical in nature. How do they configure their home network? Which ISP are they using and with which communication bundle? How are they even connected to the network – via wifi or ethernet? How far are they from the wifi access point? Who else is using their home network and how? How is their network configured?
The answers to the questions above are going to affect the network quality and resulting audibility of their calls.
Since we can’t control their network, we at least want to understand it properly to be able to make intelligent decisions, such as routing calls to agents that have better networks and environments or to assist our agents in improving their network and environment.

Assessing a WFH call center agent’s environment

They say that knowing is half the battle. In order to solve a call quality problem you should start from understanding what is causing it, and that comes from understanding the network and environment of your agent.
There’s no specific, single solution or problem here, which is why the process usually takes a lot of back and forth interactions between the agent and the IT/support helping them out remotely.

What are the things that you’d like and need answers to?

  • What machine, operating system and browser is the agent using?
  • Are they using a headset? Is it a bluetooth one? Is it the one provided to them for this purpose?
  • Where is the agent located exactly? What ISP are they connected through?
  • Is the agent using a VPN? Are they behind a firewall? Has someone configured the agent’s DNS servers inappropriately? (you’ll be surprised)
  • Are their calls directed to the correct call center in a region nearby?
  • Can their calls flow over UDP or are they forced over TCP?
  • Are all of your applications needed by the agent available and reachable?
  • What does the agent’s network look like? Is it fiber? ADSL? Something else? Is their uplink accommodating enough for calling services?
  • How much VoIP traffic can their network handle?
  • When the agent connects to the PBX, what call quality do we measure?
  • Is his network clean or noisy with packet losses and jitter?
  • What’s the latency like?

Getting answers to these questions quickly and accurately reduces the handling time of such issues. This is what our clients use our qualityRTC product for – to get the data they need as fast as possible to help them resolve issues sooner.

What’s your workflow?

Each call center has its own nuances – different infrastructure to test and different locations.
You have your own workflow and support process to tackle issues. Do you empower agents with self service, or keep close tabs on when and how network tests are conducted?
Some would rather have agents test their network daily at the beginning of the shift, while others want that to take place only when issues arise.
Large call centers usually need access to the data for BI purposes. Others want to map all their call center agents’ status once in a while – just to understand where they stand.

We’ve built qualityRTC with the help of the biggest call center providers out there, so we’ve got you covered no matter your workflow. qualityRTC is flexible to the level you’ll need to help you in reducing your support strains of WFH agents and get you focused on what really matters – your customers.

If you want to really up your game in WebRTC diagnostics – for either voice or video scenarios – with Twilio, some other CPaaS vendor or with your own infrastructure – let us know. We can help using our qualityRTC network testing solution.


2

Network Jitter or Round Trip Time – which is more important in WebRTC?

Network Jitter or Round Trip Time – which is more important when testing or monitoring a WebRTC application?

You’ve got your WebRTC application. You have users communicating with it. How do you know they are having a good experience? How do you know you’ve placed your servers in the right locations? Got the routes properly configured? Do you need to add a new server in Frankfurt? Or maybe it would be better to beef up your Australian presence?

These answers require looking at the users you have and the quality they are getting. And when the time comes to look at WebRTC quality, you’ll hear a lot the terms network jitter, latency and round trip time thrown around.

So which one is more important to track and focus on with WebRTC? Is it network jitter or maybe it is round trip time?

I’d say both. But not exactly…

Let’s try to break this down to understand it better.

Network vs “glass to glass”

We can look at these metrics, and especially latency and round trip time in different ways, where the first question to ask is what exactly are we measuring?

The illustration above is a simplified version of the network traffic in a WebRTC session. We don’t have servers here and we don’t have a lot of other components. Rest assured that each component along the way can add latency and even affect jitter.

What I did in the illustration is also delineated 3 different areas:

  1. The peripheral, where the media is acquired and played. Screens, microphones, cameras, speakers – they all add inherent delays and some of it can be considerable. Bluetooth devices for example are notorious for adding delays (anyone said iOS 15?)
  2. WebRTC processing, on its own, designed and built to reduce delays and jitter, but a contributor to it as well. This is doubly true in media servers that you own and operate but also true for browsers you don’t control and your users are using to access your service
  3. Network, which is what we’re trying to measure, at least in this article

Here’s the thing: for the most part, in most use cases, you have little control or knowledge of the peripherals being used. Measuring their own effects is also hard and in many real world applications impossible. So we are going to ignore peripherals.

WebRTC processing and the network are usually bunched together and there’s little in the way of splitting them up. Based on what you see and experience, you will need to decide if the issue is the network (=infrastructure and DevOps) or WebRTC  processing (=software bugs and optimizations).

Network Jitter vs Round Trip Time (or Latency)

To me, the difference between network latency and round trip time is akin to the difference between weather and climate: Weather reflects short-term conditions of the atmosphere while climate is the average daily weather for an extended period of time at a certain location.

In the same token, jitter reflects short-term conditions or more accurately inconsistencies in the flow of packets over a network while round trip time (or latency) is the average time it takes for packets to flow through the network for a longer period of time and from one location to another.

Network Jitter answers the question how inconsistent the network is.

Round Trip Time (or Latency) answers the question how much delay is there in the network.

What’s “Network Jitter”?

In a WebRTC session, we will be sending over packets continuously. On a voice call, in many cases, a packet will be sent every 20 milliseconds. With video, we will be sending packets to reach 30 frames per second, and there are more than a single packet per frame usually, which means hundreds of packets every second.

Assuming the network experiences no packet loss, then we expect to receive the same number of packets in the same frequency.

Let’s look at a span of 200 milliseconds of audio from a sender’s perspective versus a receiver’s one. That’s 10 packets worth of data:

The sender sends an SRTP audio packet every 20 milliseconds in the illustration above, but the receiver doesn’t receive them exactly every 20 milliseconds – they are somewhat jittery… and that’s what we’re measuring with network jitter.

What contributes to network jitter?

Mainly the network.

When you send packets over the internet, who guarantees that what gets sent is actually received and in a timely manner?

Think about the post office. Not all letters delivered get to their destination, and not all letters delivered get to their destination with the same latency (=on time). The same is true for a computer network, and the more complex the network, the harder it gets to do this properly.

Here are some things that can affect network jitter badly:

  • The user’s network and his location
    • Poor location. A user connecting from inside an elevator over cellular or sitting far away from his WiFi access point will result in bursty connections that will introduce high jitter and packet loss
    • Congested network. Either the local one (your daughter on TikTok and your son on Fortnite while you’re trying to have a conversation over WebRTC; an office with too many people on the Internet on a slow connection; 50,000 people in a stadium trying to do Facebook Live at the same time) or the path to the WebRTC infrastructure being clogged by network traffic
    • Faulty hardware. A bad ethernet cable… a true story: we had a client some time ago stress testing his service, only to find that packet loss (and jitter) originated from a faulty cable in his data center
    • CPU. Local resources on a user’s device or your TURN and media servers in itself can add jitter. If the CPU of a machine starts throttling, the end result is going to be jitter (and packet loss)

Things that end up causing jitter on top of just jitter are packet loss (we never did receive what was sent), duplication of packets (yes, that can happen) and reordering of packets (if they are out of order, there’s definitely jitter, just with an added headache).

Why is network jitter a bad thing?

Why is this bad? Because if we want to smoothly playback the audio and video being sent, we need to align it yet again towards what the sender intended. Or more accurately, towards what the microphone and camera captured on the sender side.

If we don’t align the incoming media, the audio will not sound natural and the video will look choppy. If you want to experience this firsthand, just make sure the CPU of the device you are using is busy doing other things while being on a video call.

How does WebRTC compensate for jitter?

This is something that all VoIP services have, which is a jitter buffer. A jitter buffer is a software component that collects the received packets and decides when to play them out. It is used to handle lip synchronization (playing out audio and video together in sync), to reorder packets, and to take into account the jitter on the network.

If we know that jitter can be around 30 milliseconds, then the jitter buffer can wait for at least that time before playing back packets, so that whenever we need to play back a packet in a smooth manner, that packet has already been received.

Since network jitter is dynamic in nature, so is WebRTC’s jitter buffer – it is an adaptive jitter buffer that tries to understand how much jitter there is on the network, and increase or decrease the buffer size (length) based on what the network exhibits. Why do we do that? Because too little jitter means bad user experience due to dropped packets or improper playback and too high a jitter means adding to the latency of the playout, which we don’t want in real time interactive WebRTC sessions.

Do we look at “Latency” or “Round Trip Time”?

Latency, round trip time and delay are words that get dumped together. Also RTT – which is the acronym for round trip time. While there are nuances between them, and what exactly each one means, the lower they are the better the experience will be and the better interactive the session can be.

Here’s how I usually look at these and categorize them:

Latency for me is the time it takes for a packet of data to get from one point in the network to another.

Round trip time is the time it takes for a response packet to get back.

You can argue around latency and delay and decide if they should include or shouldn’t include the peripheral’s built in delay or even the delay added by WebRTC processing in end units or servers in the network.

For round trip time, the argument can be around the processing time needed to handle the incoming message and then send out the reply to it (if don’t incorrectly, this can add a considerable delay on its own).

And how do you measure latency exactly? If the clocks on the two devices aren’t fully in sync, how can you measure it? The result is, that in most cases, and WebRTC is no different, you rely on the round trip time instead – if I send a message and wait for a response, all I need to do is check the time that passed. And that’s exactly what you can glean out of the RTCP reports and WebRTC statistics.

What contributes to round trip time?

Besides the things that affect jitter, you’ll find here also the route taken by the packets over the network.

Here’s how I usually explain it – lets say your TURN server or media server or gateway is located in “East US”. That’s the generic name we all give to our first cloud data center choice.

Why? We want a global service, but we try to target the US first, so it needs to be in the US. And on the maps, the best alternative to also reach Europe is the east coast. So we end up with US East on one of the cloud vendors. At least until we grow and distribute our service.

What happens if the session takes place between 2 people who are both located in Paris and the session is routed through our media servers in the US?

That most probably will take a longer route both geographically and when measured in time, which ends up adding to the latency of the session. In many cases, it also means a higher packet loss as there are more opportunities along that route to lose packets.

This means that the way we design our infrastructure, deploy it around the globe and configure it has a considerable impact on the round trip time users are going to experience.

Why is high round trip time a bad thing?

More latency means it takes time from what we do until the other side can hear or see it.

For live streaming (somewhat related to WebRTC), the effects of latency are simply to explain. Here’s a good video for that:

If you are dealing with surveillance cameras, then latency is bad. When you’re in an interactive session – a 1:1 conversation or a group meeting, then you’ll be expecting latency of below 200 milliseconds. Anything above that would be noticeable and nagging. You won’t know when someone finished speaking so you can contribute to the conversation right after him for example.

So we’d like to have low round trip time as well as low network jitter for a good interactive experience in WebRTC applications.

How does WebRTC compensate for high round trip time?

It doesn’t. Not really. You’re on your own. You’ll need to decide where to place your servers and how to configure the routes between them to reduce latency.

Solutions we’ve seen recently range from:

  • Placing more media servers and TURN servers in more data centers closer to where your users are
  • Using third party TURN servers that are highly distributed (think Subspace and Cloudflare)
  • Go for a service such as AWS Global Accelerator to end up with an optimized route

At the end of the day, you’ll need to invest energy or money or both in order to improve round trip time as you grow your service.

We didn’t talk packet loss

Here’s something you should understand – high round trip time or network jitter can easily cause packet loss.

If there’s congestion on the network, you might end up with packet loss since a network switch or router along the path of your packets decided to drop some of your packets because it is congested.

But if the packets arrive too late (because of high round trip time or high jitter), then playing them might not be an option anymore – their time has passed. In such a case, WebRTC would simply drop the packet even though it received it. The real time nature of WebRTC doesn’t allow it to buffer data forever.

Network jitter and round trip time – are these an infrastructure problem or an end user problem?

Both.

At times, network jitter and round trip time can occur due to infrastructure issues – anything from faulty cables, bad network configurations or just machines that are too busy to process data fast enough.

Other times, your user is to blame. Either due to his device or the network he is using.

Then there’s the network. If everyone is currently trying to access the network, there are bound to be clogged routes, even if only periodically.

It is going to be your job to try and understand where the problem originates from.

How to fix network jitter and round trip time using testRTC’s tools?

Glad you asked 😀

testRTC offers tools for the full life cycle of WebRTC applications. For the most part, fixing jitter and round trip time is going to be part of the operations work on your end – understanding where traffic is routed through and how to redirect it elsewhere (including the possible need to add new regions and servers).  Here’s where you’ll meet network jitter and round trip time in our services:

testingRTC

Our WebRTC testing service enables you to conduct integration, regression, function, non-functional, sizing, load and stress testing.

In all tests we collect network jitter and round trip time for all simulated probes in a session. We treat your service as a black box, launch our machines from different locations around the globe (you define which ones) and collect that as part of the metrics we store. We make it available on the channel level, browser level and test level as an aggregate of everything. Access to it is offered via the dashboard and through APIs. You can even add your expectations of these values and cause tests to fail based on your thresholds. If you want, you can dynamically change these values for each browser in the test and see how this affects your service.

upRTC

upRTC is our WebRTC active monitoring service. Its main purpose is to understand the behavior of your infrastructure. It does that by bringing predictability to the user side and his network, so you can be sure that every time the monitor’s browser runs in front of your infrastructure they behave the same from the side of the network.

Here, looking at network jitter and round trip time and setting thresholds for them to alert you via email and webhook is the way to go.

watchRTC

watchRTC offers WebRTC passive monitoring. It hooks up to your users’ devices and collects their WebRTC metrics. This gets processed, aggregated and analyzed. Part of the metrics we collect and share is network jitter and round trip time. We do that on the individual channel level, the peer level, the room level and in aggregate across complex filters:

The purpose of it all is:

  1. To let you understand what your end users are experiencing
  2. Assist you in tracking down outliers in device types, operating systems, networks, locations, etc
  3. Drill down to a certain user’s complaint when needed

qualityRTC and probeRTC

With qualityRTC and probeRTC we help your support and users answer the question “how can I improve my connectivity to your service?”

This is done by a series of tests, many of them collecting network jitter and round trip time data

Talk to us

Need to figure out your network jitter? Have a round trip time and latency issue with users?

Come and talk to us. I am sure we will be able to help you figure out the issues.

WebRTC performance comparison testing (and a whitepaper)

How do you compare the performance of 2 or more WebRTC services? How about comparing the performance of your service to itself over time, or on different configurations? We’ve added the tooling to answer this question to testRTC.

TL;DR – We’ve published a whitepaper on WebRTC performance comparative analysis sponsored by Vonage. You can download and read it here: Vonage Is Raising Video Quality Expectations for Live Interactions in the Post-pandemic Era

How it all started

Vonage approached us with an interesting request a few months back. They wanted to validate and compare the performance of the Vonage Video API to that of other leading vendors in the video CPaaS domain.

We couldn’t refuse the challenge:

  • testRTC was already collecting all the metrics
  • Our focus is on providing stable and reproducible results
  • So it was fairly obvious that this is something within our comfort zone

What we were missing were a few APIs and mechanisms in our platform to be able to collect the information programmatically, to reduce the time it took to analyze the results for the needs of conducting comparisons.

Designing performance testing for WebRTC

We sat down with the Vonage team, thinking together on the best approach to conduct this analysis. The end result were these general requirements:

  1. Be able to compare a scenario across different video API vendors
  2. Support multiple scenarios
  3. Make sure to include stable network, dynamic network changes, different screen sharing content
  4. Different group sizes

With that in mind, there were a few things that were needed to be done on our end:

  • Create the initial sample applications to use during the tests
  • Write test scripts in testRTC in a generic manner, to be able to conduct a standardized comparison
  • Develop simple CLI scripts to run the whole test batch across the use cases and vendor implementations
  • Add the necessary means to easily compare the results (=export metrics easily and programmatically to a CSV file)

Along the way, we’ve added a few features to testRTC, so now everyone can do this independently for his own service and infrastructure.

You will find a lot more details about what scenarios we picked and the metrics we decided to look at more closely in the whitepaper itself.

The new toys in our WebRTC toolset

If you are interested in the main features we’ve used and added to enable such comparative analysis of WebRTC services, then here’s what I found useful during this project we did:

  1. Machine metrics data collection. We had that data visualized but never collected as numeric values. Now that we have, it is useful for objective comparisons of test results
  2. Added a new script command that can calculate the time from an event that occurs until a given WebRTC metric value is reached. For example, checking how long it takes for the bitrate to reach a certain value after we’ve removed a network limit
  3. When retrieving the result status from a test run results, we now provide more metrics information such as bitrate, packet loss, CPU use, custom metric values, etc. This can then be collected as WebRTC performance KPIs
  4. Executing tests via the APIs can now also control the number of probes to allocate for the test. We used this to use the same script and run it multiple times, each with a different number of browser in the call scenario
  5. Script to run scripts. We’ve taken the Python script that Gustavo Garvia of Epic Games used in our webinar some two years back. At the time, he used it to invoke tests sequentially in testRTC from a Jenkins job. We modified it to generate a CSV file with the KPIs we were after, and to pass the number of probes for each test as well as additional custom variables. This enables us to write a single test script per vendor and use it for multiple scenarios and tests

Assuming such benchmarking is important to you and your application, let us know and we’ll help you out in setting it up.

What I learned about comparing WebRTC applications

This has been an interesting project for us at testRTC.

Comparing different vendors is never easy, and in WebRTC, where every feature can be implemented in various ways, this becomes even trickier. The ability to define and control the various conditions across the vendors and use cases made this simpler to deal with, and the fact that we could collect it all to a CSV file, converted to a Google Sheet and from there to graphs and insights was powerful.

Getting a group video call to work fine is a challenging task but a known one. Getting it to work well in varying conditions is a lot harder – and that’s where the differences between the vendors are more noticeable.

Performance Whitepaper: A comparative analysis of Vonage Video API

The last few months have been eye opening. We looked at the various scenarios, user behavior and network shaping issues that occur in real life and mapped them into test scripts. We then executed it all multiple times and analyzed the results. We did so on 3 different vendors – Vonage and two of its competitors.

Seeing how each platform decides to work with simulcast, how they behave to adding more users to a group call, and how they operate in various use cases has shown us how different these implementations are.

Make sure to download this free whitepaper from the Vonage website: Vonage Is Raising Video Quality Expectations for Live Interactions in the Post-pandemic Era

2

Network monitoring: 8 benefits of active monitoring in WebRTC

Call it WebRTC active monitoring or WebRTC synthetic monitoring, the concept is rather simple. What you are trying to do is run a scenario from real browsers the same way a user would. Why? So you can see (=track and monitor) your WebRTC application the way your customers do.

You know pingdom? It is a service that pings your website every couple of seconds. If it fails to get a response – you receive an email that your website is down. A simple and straightforward solution. There are many similar services out there and they work beautifully. If all you’re after is to answer the question “is my website still up?”

This, though is different than asking the question “is my website working properly?”

How do you go about monitoring a website for that? You dig one or two levels deeper, specifically, by putting on probes that load your webpages and look for indication that these pages are fresh and not erroneous. Why? Because a ping test of a website can be happy with this kind of a result:

That’s Google Calendar being down a few weeks back. I am not sure that a ping test would notice that, as a page does load.

The path to synthetic/active monitoring

What would an IT person do? Add more metrics that he can track. CPU use, memory use, network traffic. And then add more metrics from the application: page views, open sessions, etc.

These metrics are prone to two problems:

  1. Seasonality changes their behavior. Think weekend or holiday traffic versus regular days, or opening hours versus night time
  2. The lights might be on but there’s nobody home. All looks fine, but somehow a user is unable to login or get connected to a certain service due to breakage in the connection of two internal systems. Since monitoring is done on low level metrics, such cases might be missed

The next step for our IT person would be to have a probe act like a user to going through the system to understand its behavior. These probes conduct synthetic monitoring, where they act like real users going through the system.

The same applies to WebRTC applications as well.

8 benefits of active monitoring in WebRTC

Call it WebRTC active monitoring or WebRTC synthetic monitoring, the concept is rather simple. What you are trying to do is run a scenario from real browsers the same way a user would. Why? So you can see (=track and monitor) your WebRTC application the way your customers do. And once you automate it and run it frequently, you can gain insights and understanding that you just can’t get in any other way.

Here are 8 benefits that got customers like Vidyo to use testRTC for monitoring their WebRTC cloud deployment:

#1 – Predictability and Objectivity

When you run an active monitor you are in control. You know where the probes are coming from, what is the performance of the machines they use offer, and what their network conditions are. And if you don’t, then running that active monitor in the same scenario a couple of times will create the baseline you need.

With that information, you can now run the scenario as an active monitor, and if all goes well the results will be consistent. The moment something changes – there’s a pretty high level of confidence that something changed in your WebRTC deployment. That’s predictability.

The fact that the metrics collected and analyzed results are based on machine automation, you also gain objectivity. While it will be hard to say how bad a jitte value of 120 is versus 100, it will be easy to say that if you had a jitter value of 100 for a few months and now that has changed to 120 in the monitor you are running, then things changed for the worse, and it would be wise to check why.

#2 – End-to-End

When we deploy a monitor with a new client of ours at testRTC there’s almost always a learning period of a month or two. At that time, we need to assist our client to fine tune and tweak the script written for the monitor.

Common things we need to do is slow down button clicking or add retries in certain strategic places (like login procedures). Why? Because production WebRTC services sometimes receive 502 when people try to login, connect or start sessions. Real users would simply refresh the page by clicking F5 or retry clicking a button.

In some cases, our clients would go about hunting these bugs and fix them. In others, we’d build these retry mechanisms into the script used by the monitor.

The thing is though, that when a WebRTC session fails, it can fail a lot before it even started. Or it can work nicely, but screen sharing fails. Or screen sharing will work but PSTN dial-in won’t. Being able to define the most important WebRTC scenarios and synthetically monitor for them gives you an end-to-end solution.

#3 – Be the first to know

You need to be the first to know when there is an issue. That issue can be with the login, directory service, session initialization, media quality or any other problem that might arise.

If you are operating a contact center, then calls take place at certain times of the day (office hours). Understanding potential failures before they happen simply by running a monitor prior to a Monday morning shift starting the day would give you more time to resolve issues.

If you have millions of calls taking place a day on your system, then this might not be an issue for you – or more likely, your users would complain at the same time your service monitoring will notice a failure. In such a case, other reasons such as predictability would make more sense to using synthetic monitoring. This is doubly so since using predictable probes that create synthetic sessions should result consistent outcomes, as opposed to real users where you lack any control over their machine, location and network.

#4 – Simplicity

There’s something to be said about simple approaches for complex problems.

When users can’t connect to your service, do you know why that is? If they complain about quality, is it because of their device, network connection or your service? How do you even go about analyzing this?

WebRTC synthetic monitoring reduces a lot of the variables and brings predictability with it into the process. What you end up collecting and how you serve that to the IT person in charge is also quite important – there are so many metrics and parameters to look at with WebRTC that many don’t find their way around.

What we’re razor focused in testRTC is in making the analysis process as simple as possible to our clients. Letting them glean the insights they need with the least amount of effort on their part. Our upcoming release goes in that trend and is already being trialed by a few of our clients.

#5 – Debuggability

The monitor failed or alerted at an issue. Great. Now what? How do you make that alert an actionable one?

With passive monitoring of live users, there’s very little you can do in a lot of cases. Quality is a subjective thing that is affected quite a lot by the user’s own device and network. Move a meter or two farther away from your current position while in a call, and your Wifi connection might become unusable. In my house, using Wifi in the bedroom is quite the challenge. The living room and my home office? They’re guaranteed to give high network quality. At least up to the carrier. My desktop has its good days and bad days, depending on the number of Chrome tabs opened and the number of days since the last reboot.

If you run a synthetic monitor for WebRTC, then there are quite a few things at your disposal. Here are some that we’ve implemented in testRTC for our clients:

  • Collect all possible data, so developers can look at logs and figure out the issues. This includes WebRTC metrics, browser console logs, network events log, browser performance data and screenshots
  • Visualize the scenario and the metrics collected, keeping it simple at first glace with high level graphs and aggregations while enabling drill down to the minute details
  • Automate threshold on metrics, to make sure tests warn or fail on certain use cases and conditions that are suitable for you
  • Grab a screenshot at the time of failure, so you can see the moment the scenario fails
  • Execute the scenario again, so you can see the failure (since the scenario and probes are predictable, there’s a high likelihood the failure will occur again)
  • Join a running synthetic session via VNC, so you can see for yourself how the session progresses

#6 – No instrumentation

Synthetic monitoring requires no instrumentation of your service.

Since you end up using real browsers, running real scenarios, the only thing you’ll probably need is create certain users for running the monitor and that’s about it.

There’s no code you’ll need to inject into your service. No js file to include. No SDK to compile into your app.

That means it is faster to deploy to production than alternatives and the potential effect it has on your service due to the addition of external code is non-existent, since you’ve changed nothing in the code.

#7 – Privacy

A synthetic monitor collects synthetic metrics. It doesn’t sit on your live users, so there’s no live user data collection taking place. There’s also no real indication of the size of your deployment, the trajectory and growth of your service or anything similar associated with it.

We’ve seen reluctance of clients to share such data with cloud based services. These mostly stem from legal issues such as where the data gets collected and stored, but also from a business perspective of having a third party trusted with the day to day communications that takes place. In many cases, companies are happier having this part of the operation take place in-house.

With an active monitor, the only data collected and analyzed is the data generated by the browser of the active monitor itself and no one else. The users used by the active monitor are dummy users created for that purpose only.

#8 – Fixed investment

Talking about predictability… as your service grows, a WebRTC active monitor act in the same manner. This means your investment in running the monitor won’t be changing either. This is never the case with a passive monitor, where pricing is based on the size of the user base as well as the amount of traffic.

That means you can budget and plan ahead for longer periods of time at relatively low investment.

When will you need to grow your investment? When you want to deepen your analysis. This is done by deploying more monitors (to run from more geographic locations or to hit different data centers of your service), increasing the frequency of the monitors (to get alerted on issues earlier) or when you beef up monitors (by adding more probes to test larger video group calls for example).

testRTC’s active monitoring

If you are in need of better visibility of your WebRTC application, then by all means – explore passive monitoring and deploy it. But also check how active monitoring can improve your day-to-day operations and in the end, improve uptime and media quality for your users.

We’re here to help, so contact us for a demo.

24

How Many Sessions Can a Kurento Server Hold?

Here’s a question we come across quite often at testRTC.

You decided to self develop your own service. Manage your own media servers. And now that time comes to understand your ongoing costs as well as decide on the scale out scheme – at what point do you launch/spawn a new server to take up some of the load from your current media servers farm? How many users can you cram into a single media server anyway?

We decided to check just that, doing it with the help of WebRTC.ventures who worked with us on the setup.

For the purpose of these set of sizing experiments, we picked up Kurento, one of the most versatile open source media servers out there today. We selected a few key scenarios, and WebRTC.ventures installed the server and configured it for us.

We then used our testRTC probes to understand how many users can we cram on the server in each scenario.

Simple scenario sizing is one step in the process. If you are serious about your service, then check out our best practices to stress testing your WebRTC application.

Get the best practices guide

Why Kurento?

There are a couple of reasons why we picked Kurento for this one.

  1. Because many use it out there, and we’ve been helping customers understand and debug it when they needed to
  2. It is versatile. We could try multiple scenarios with it with relative ease and little programming (although that wasn’t our part of the project)
  3. It does media processing beyond just routing media. We wanted to see how this will affect the numbers, especially considering the last reason below
  4. It’s the first of a few media servers we’re going to play with, so stay with us on this one

The Scenarios

For the Kurento service, we picked up 3 different scenarios we wanted to test:

  1. 1:1 video calls. A typical doctor visitation or similar scenario, where two participants join the same session and the session gets recorded (two separate streams, one for each participant).
  2. 4-way group video calls. The classic scenario, in an MCU configuration. Kurento decodes and encodes all media streams, so we’re giving it quite a workout
  3. Live broadcast. A single person talking to a large group of viewers.

For scenarios (1) and (2) our question is how many concurrent sessions can the Kurento server hold.

For scenario (3) our question is how many viewers for a single broadcast can the Kurento server hold.

The Setup

To set things up for our test, we did the following:

  • We went for a simple AWS t2.medium machine, but quickly had to switch to a more capable machine. We ended up with a c4.2xlarge instance (8 vCPU, 15 GB RAM) on AWS
  • We had it monitored via New Relic, to be able to check the metrics (but later decided to forgo this approach and just use top with root access directly on the machine)
  • We also had an easy way to reset the Kurento server. We knew that rattling it too much between tests without a reset would affect our results. We wanted a clean slate each time we started

The machine was hosted in Amazon US-East.

testRTC probes were coming in from a different cloud vendor, East and West US locations.

We didn’t do any TURN related stuff – so our browser traffic hit the Kurento server directly and over UDP.

The Process

For each scenario, we’ve written a simple test script that can scale nicely.

We then executed the test script in its minimal size.

For 1:1 video calls and broadcasts we used 2 probes and for the 4-way group video call we started with 4 probes.

We ran each test for a period of 4-5 minutes, to check the stability of the media flow.

We used that as the baseline of our results and monitored to see when adding more probes caused the media metrics to start faltering.

1:1 Video Calls

The above screenshot is what you’ll see if you participated in these sessions. There’s a picture in picture view of the session, where the full screen area is the remote incoming video and the smaller window holds our local view.

Baseline

Kurento’s basic configuration limits bitrate of calls to around 500kbps. This can be seen from running a single session in our high level chart:

And here’s the stats on the channels of one of the two probes in this baseline test run:

Now that we have our baseline, it was time to scale things up.

30 Probes (=15 sessions)

When we went up to 30 probes, running in 15 parallel 1:1 video sessions, we ended up with this graph:

While the average bitrate is still around 500kbps, we can see that the min/max bands are not as stable.

If we look at the packet loss graph, things aren’t happy (the baseline had no packet losses):

This is where we went for the “By probe” tab, looking at individual bitrates across the probes:

What we can see immediately is that 4 probes out of 30 didn’t get the full attention of the Kurento media server – they got to send and receive less than 500kbps.

If we switch to the packet loss by probe, we see this:

A couple of things that come to mind:

  1. Kurento degrades quality to specific sessions and not across the board. Out of 30 users, 22 got the expected results, 4 had lower bitrates and another 4 had packet losses
  2. There’s correlation here. When Probe #04 exhibits reduction in bitrate, Probe #3 reports incoming packet losses

From here, we can easily go down the path of drilling down to the probes that showed issues. I won’t do it now, as there’s still a lot to cover.

22 Probes (=11 sessions)

It stands to reason then that lowering the capacity to 22 probes should give us pristine results.

Here’s what we’ve seen instead:

We still have that one session that goes bad.

20 or 18?

When we went down to 18 or 20 probes, things got better.

With 20 the issue is that we couldn’t really reproduce a good result at all times. Sometimes, the scenario worked, and other times, it looked like the issues we’ve seen with the 22 probes.

18 though seemed rather stable when tested a couple of times:

Depending on the service you’re offering, I’d pick 18. Or even go down to 16…

4-Way Group Video Calls

The above is a screen capture of the 4-way group video call scenario we’ve analyzed.

In this case, each probe (browser) sends out video at a resolution of 640×360 and receives a video resolution of 800×600.

The screenshot doesn’t show the images getting cropped, so we can assume the Kurento media server takes the following approach to its pipeline:

That’s lots of processing needed for each probe added, which means we can expect lower scaling for this scenario.

Baseline

Our baseline this time is going to need 4 probes.

Here’s high the high level video graph looks like:

Not as stable as our 1:1 video calls, but it should do for what’s coming.

Note that each probe still has around 500kbps of video bitrate.

I’ll skip the drill down into the results of a specific probe metrics and take this as our baseline.

20 Probes (=5 sessions)

Since 1:1 video sessions didn’t go well above 20, we started there and went down.

Here’s how 20 probes look like:

Erratic.

Checking packet losses and bitrates by probe yielded similar results to the bad 1:1 sessions. Here’s the by probe bitrate graph:

Going down to 16 probes (=4 sessions) wasn’t any better:

I’ve actually looked at the bitrates and packet losses by probe, and then decided to map them out into the sessions we had:

This paints a rather grim picture – all 4 sessions hosted on the Kurento server suffered in one way or another. Somehow, the bad behavior wasn’t limited to one session, but showed itself on all of them.

Down to 12 Probes (=3 sessions)

We ended up with 12 probes showing this high level bitrate graph:

It showed some sporadic packet losses that were spread across 3 different probes. The following shows the high level by probe bitrate graph:

There’s some instability in the bitrates and the packet losses which will need some further investigation, but this is probably something we can work with and try and optimize our service to run well.

Live Broadcast

The above screenshot shows what a viewer sees on a live broadcast scenario that we’ve set up using Kurento.

We’ve got multiple testRTC probes joining the same broadcast, with the first one acting as the broadcaster and the rest are just viewers.

Baseline

Our baseline this time is going to need 2 probes. A broadcaster and a viewer.

From now on, we’ll be focusing on what the viewers experience – a lot more than what happens to the broadcaster.

We’re still in the domain of 500kbps for the video channel:

One thing to remember here – outgoing media happens only for our broadcaster probe and incoming media happens for all the other probes.

30 Probe (=29 viewers)

We started with 30 probes – assuming we will fail miserably based on our previous tests, and got positively surprised:

Solid bitrate for this test.

Climbing up

We’ve then started moving up with the numbers.

50, 60 and 80 probes went really well.

Got our appetite, and jumped towards 150 probes.

And ended up with this high level graph:

There wasn’t any packet loss to indicate why that drop with the broadcaster at around 240 seconds, so I switch to the “By probe” view.

This showed that things were starting to deteriorate somewhat:

We’re sorting the results just for this purpose – you can see there’s a slight decline in average bitrate across the probes here – something that is a lot less apparent for smaller test sizes. There was no packet loss.

We’ve tried going upwards to 200, but then 12 probes didn’t even connect properly:

Going down to a 100 yielded some connection errors in some of the probes as well. Specifically, I saw this one:

This indicates we’ve got a wee bit of an issue here that needs to be solved before we can continue our stress tests any further. Most probably in the signaling layer of our server. It is either unstable when we place so many viewers at once against it, or just doesn’t really handle the load well enough.

Results Summary

The table below shows the various limits we’ve reached in our rounds of sizing tests:

Scenario Size
1:1 video calls 18 users in 9 parallel sessions
4-way group video calls 3 rooms of 4 users each
Live broadcast 1 broadcaster + 80-150 viewers

What did we learn?

  1. Stress testing for sizing purposes is fun. I actually enjoyed going through the results and running a couple of tests of my own (I didn’t write the scripts or run the initial tests – I delegated that to our support engineer)
  2. Different scenarios will dictate very different sizing. With more time, I’d start working out on finding the bottlenecks and optimizing them – I’m sure more can be squeezed out of a Kurento machine
  3. Once set up and written intelligently, it’s really easy to rerun the tests and change the number of probes used

Next Steps

Once we got to the sweet spot in each scenario, the next thing to do would probably to run it more than once.

We usually setup a testRTC monitor to run once every 15 minutes to an hour for a couple of days on such a scenario, just to make sure we’re seeing stable results more than once.

Other than that, this needs to be tested under different network conditions, varying load factors, etc.

Check out our best practices for stress testing WebRTC applications. It is relevant even if you are not using testRTC

Get the best practices guide

I’d like to thank WebRTC.ventures for the assistance in setting this one up. If you are looking for a capable vendor to custom build your WebRTC application – check them out.

11

How do WebRTC Media Servers Behave on Packet Loss?

Differently from each other.

Whenever I see people comparing WebRTC media servers, they tend to focus on scale:

– How many sessions can you cram in parallel?

– How many streams can you serve from a single machine?

– How much bitrate can you pump out?

All of these are very important questions – they end up in your sizing calculation that then go into your pricing model for your service. Oh, and we did cover this a bit here when talking about handling WebRTC browsers synchronization at scale.

Now that our new version is taking shape (still in staging, so if you want access – ping us), it is time to play a bit with a few new toys we’ve added for our beloved community of sadists (you may know them as test engineers, but the good ones are sadists – they like inflicting pain upon digital products and services).

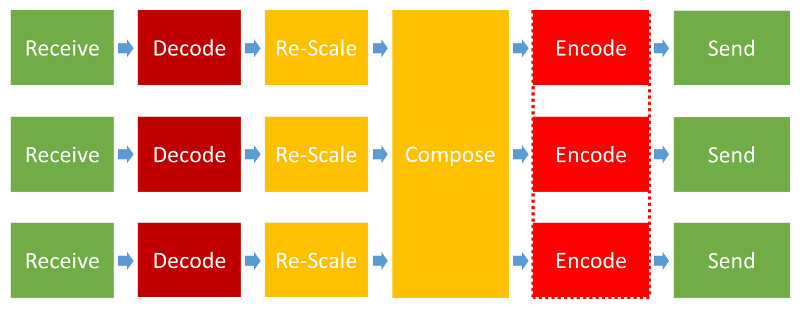
What I am talking about here is a combination of two script commands we have:

  1. rtcEvent() – place a vertical event in the graphs
  2. rtcSetNetworkProfile() – change network profiles in runtime

You’ll see how it looks in a second.

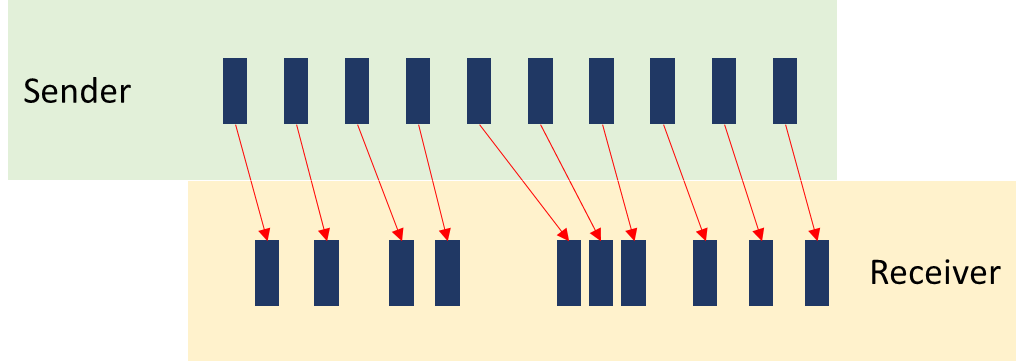
What Packet Loss Does?

Packet loss is bad.

You don’t control it. And it can happen at any time. Come and go as it pleases.

The moment you have packet loss, there will be some degradation in the quality of the media. Lost packets means lost data. Means can’t playback something. It might be minor. It might be important.

Next thing that happens? WebRTC (or most other VoIP products for that matter) will start lowering bitrates. Why? Because it assumes there’s congestion on the network, and it is trying to play nice with everyone.

But what happens once that packet loss is gone? Does things go back to normal? And if they do, then how fast will that happen?

My Experiment

I decided to devise a simple enough experiment to get some answers here. I chose the following steps:

  1. Connect to a service
  2. Run for a full minute
  3. Set packet loss to 10% for a full minute
  4. Go back to normal – no packet loss
  5. Wait two minutes

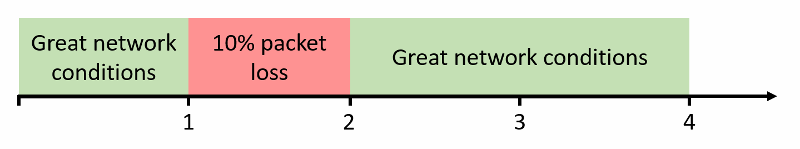
That’s it. What I am interested in is less of what happens during the second minute, but more what happens in the last two minutes, and how that is different than what we have in the first minute of the session.

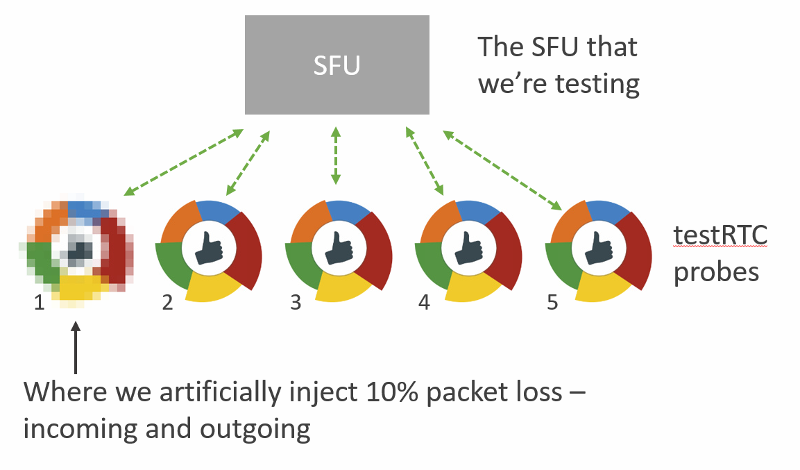
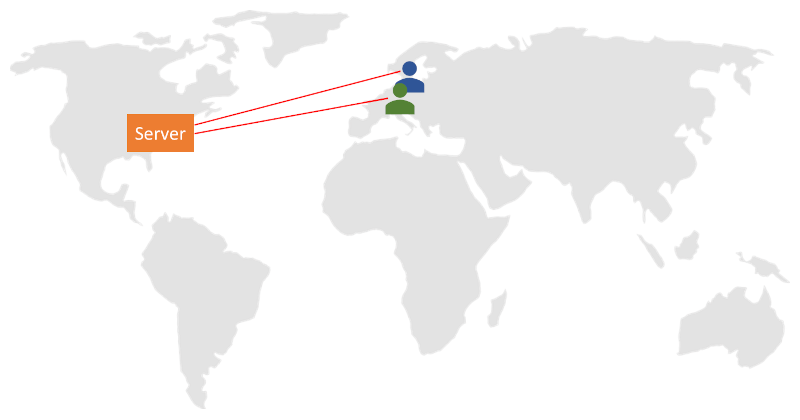
In general, I decided to place 5 users in the same session, to get that media server working a bit. And I also decided to focus on the SFU kind.

The services I tinkered with are:

  1. AppRTC, just as a baseline for this exercise
  2. Janus, an open source media framework, that can act as an SFU
  3. Jitsi Videobridge, an open source SFU
  4. mediasoup, a relatively new open source SFU
  5. SwitchRTC, a commercial SFU
  6. appear.in, a service that recently added its own self-developed SFU (in beta at the moment)

If you are looking for Kurento or other SFUs – they weren’t included not because I didn’t want to, but because there was no readily available installation out there that I could just use.

I’ll be happy to add more SFUs to the comparison, so give us a shout out if you want to run such an analysis.

Let the fun begin.

AppRTC – My Favorite Baseline

For our baseline, I decide to use AppRTC.

This time, I had to use only 2 browsers, as AppRTC doesn’t support any group calling capabilities.

What it does do is offer the vinyl WebRTC experience.

I started with writing a simple script to fit my needs:

var roomUrl = process.env.RTC_SERVICE_URL + "testRTC" + process.env.RTC_SESSION_IDX + '?vsc=VP8';

var agentType = Number(process.env.RTC_IN_SESSION_ID);
var recuperationTime = 60; // in seconds

client
   .rtcInfo(roomUrl)
   .rtcProgress('open ' + roomUrl)
   .url(roomUrl)
   .waitForElementVisible('body', 60000)
   .pause(2000)
   .click('#confirm-join-button')
   .waitForElementVisible('#videos', 20000)
// Minute 1
   .pause(recuperationTime * 500)
   .rtcScreenshot('Phase 1')
   .rtcProgress('Phase 1')
   .pause(recuperationTime * 500);

// Minute 2
   if (agentType === 1) {
   client
       .rtcEvent('10% Packet Loss start', 'global')
           .rtcSetNetworkProfile('custom', 'packet loss', 10, 'both', 'both'); // 10% packet loss
   }

client
   .pause(recuperationTime * 500)
   .rtcScreenshot('Phase 2')
   .rtcProgress('Phase 2')
   .pause(recuperationTime * 500)

   if (agentType === 1) {
    client
       .rtcSetNetworkProfile('') // back to pristine network conditions
       .rtcEvent('10% Packet Loss End', 'global');
   }

// Minute 3-4
client
   .pause(recuperationTime * 1000)
   .rtcScreenshot('Phase 3')
   .rtcProgress('Phase 3')
   .pause(recuperationTime * 1000);

A few things to note here:

  1. All test scripts on this post can be found on our github account. Easiest way to use them is to import them into your testRTC account
  2. I decided to force VP8 here. VP9 is erratic a bit in its bitrate so I wanted to go for VP8 – hence the addition of ‘?vsc=VP8’ in the first line of this script (check out all of AppRTC’s parameters here)
  3. When the second minute is up, the first probe in each session will generate a global rtcEvent and set packet loss in both directions to 10% (look at lines 23-27)
  4. After an additional second is over, the first probe in each session will generate another global rtcEvent and remove all packet loss and network constraints that might have been used (look at lines 35-39)

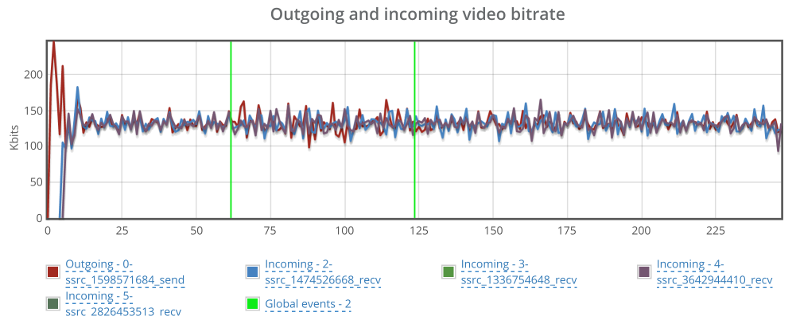
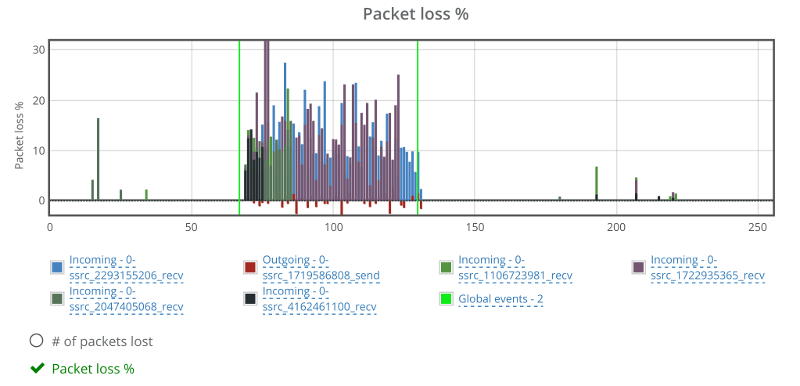
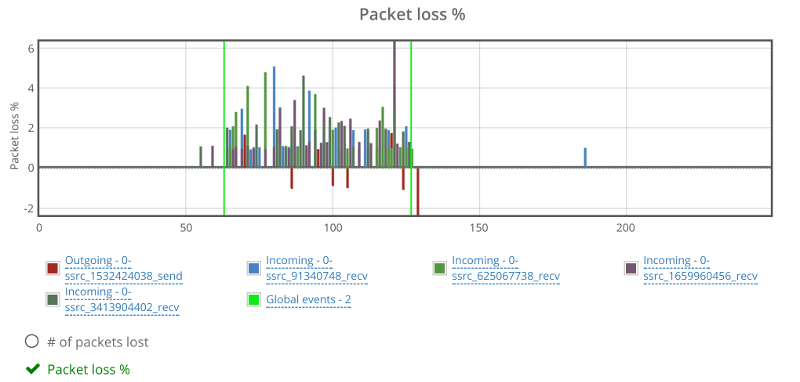
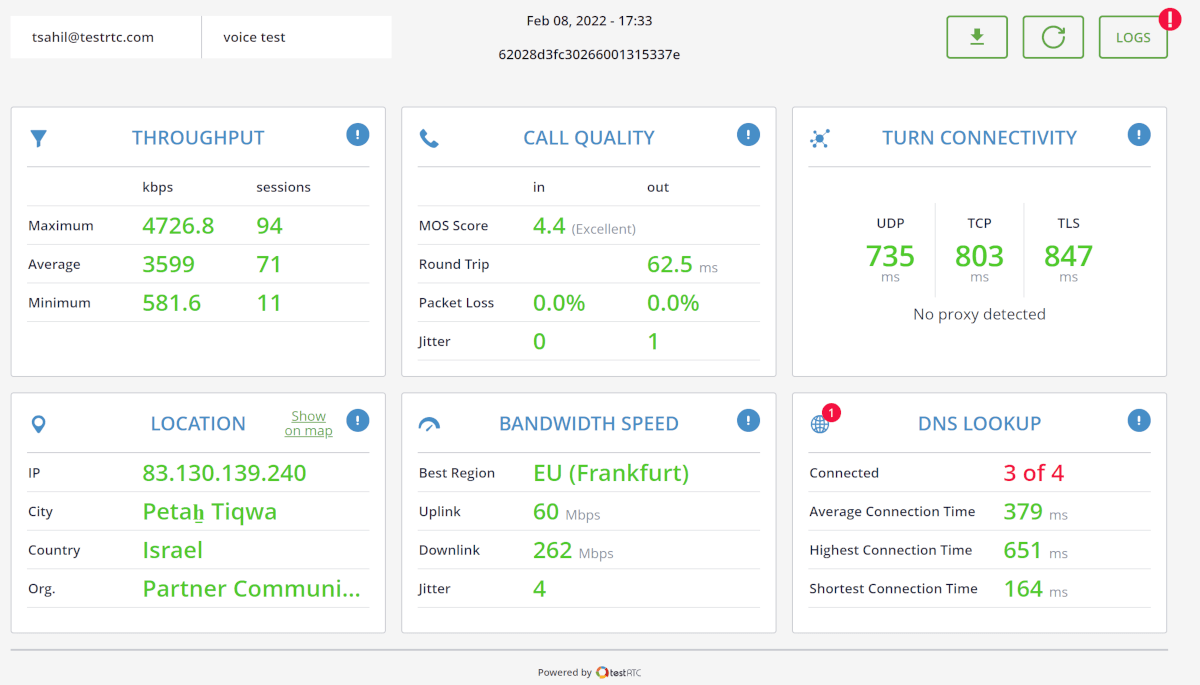
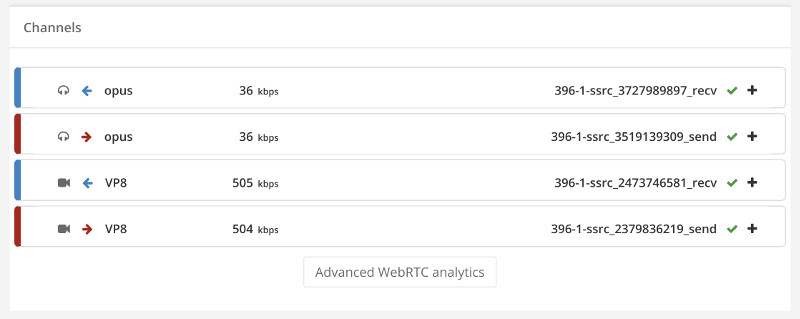
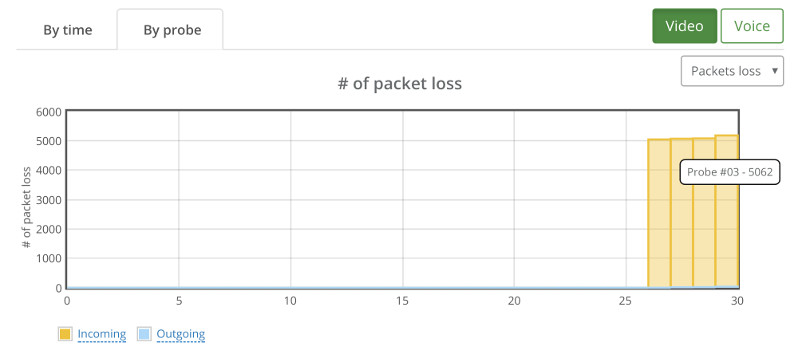
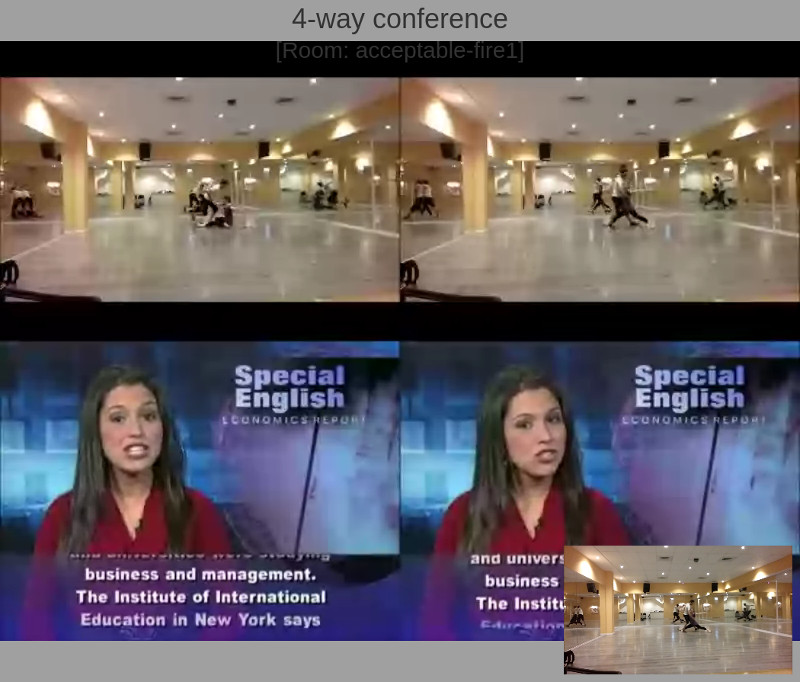
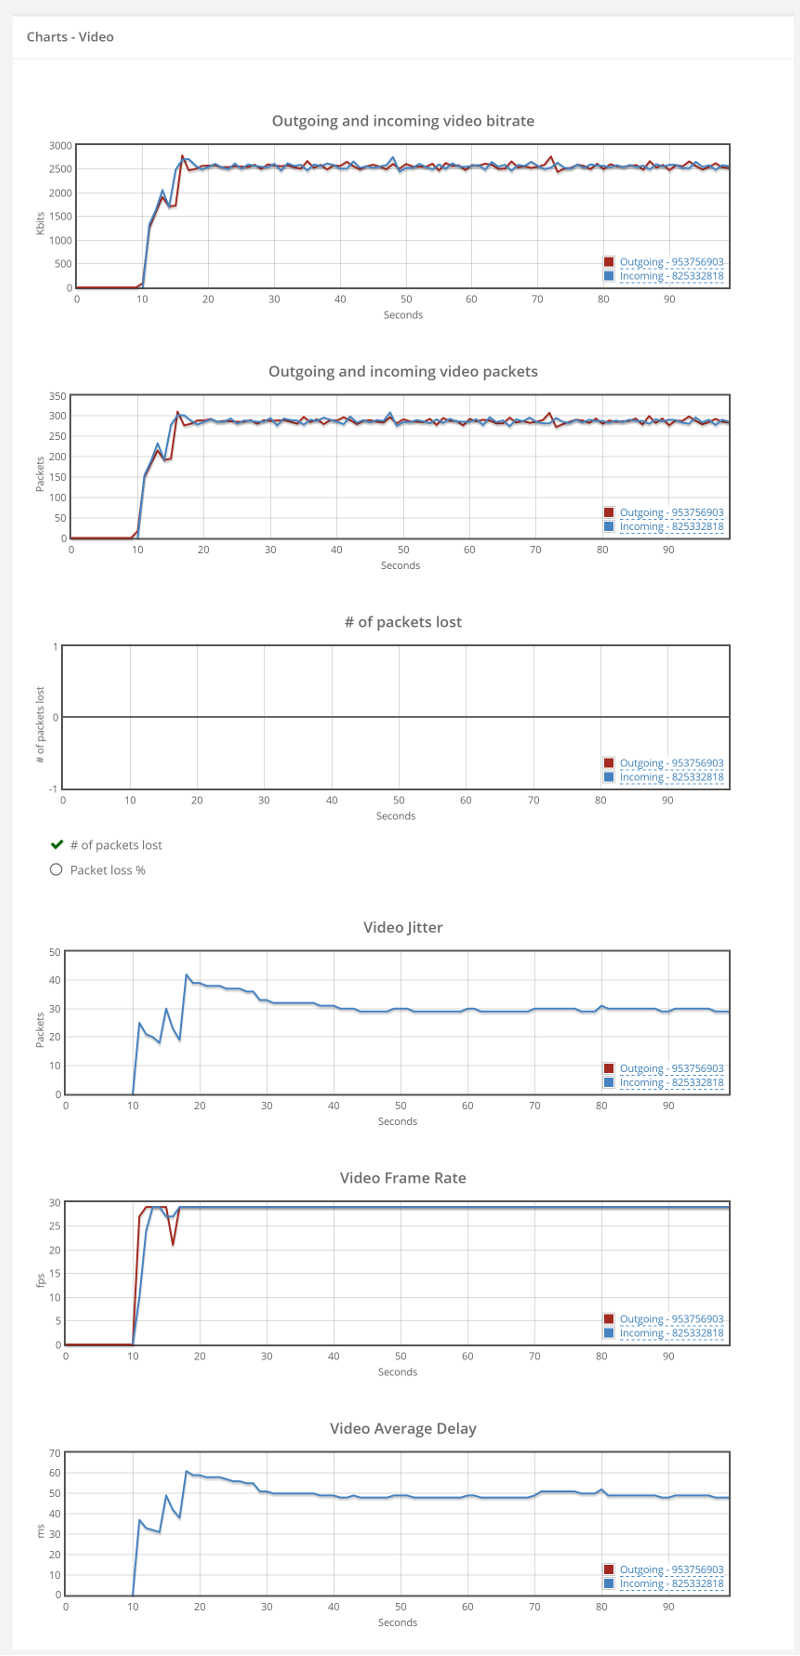
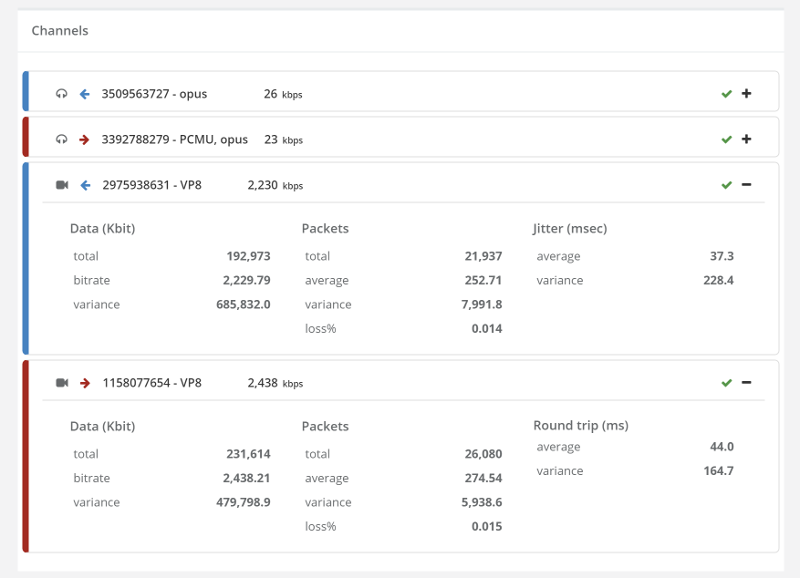
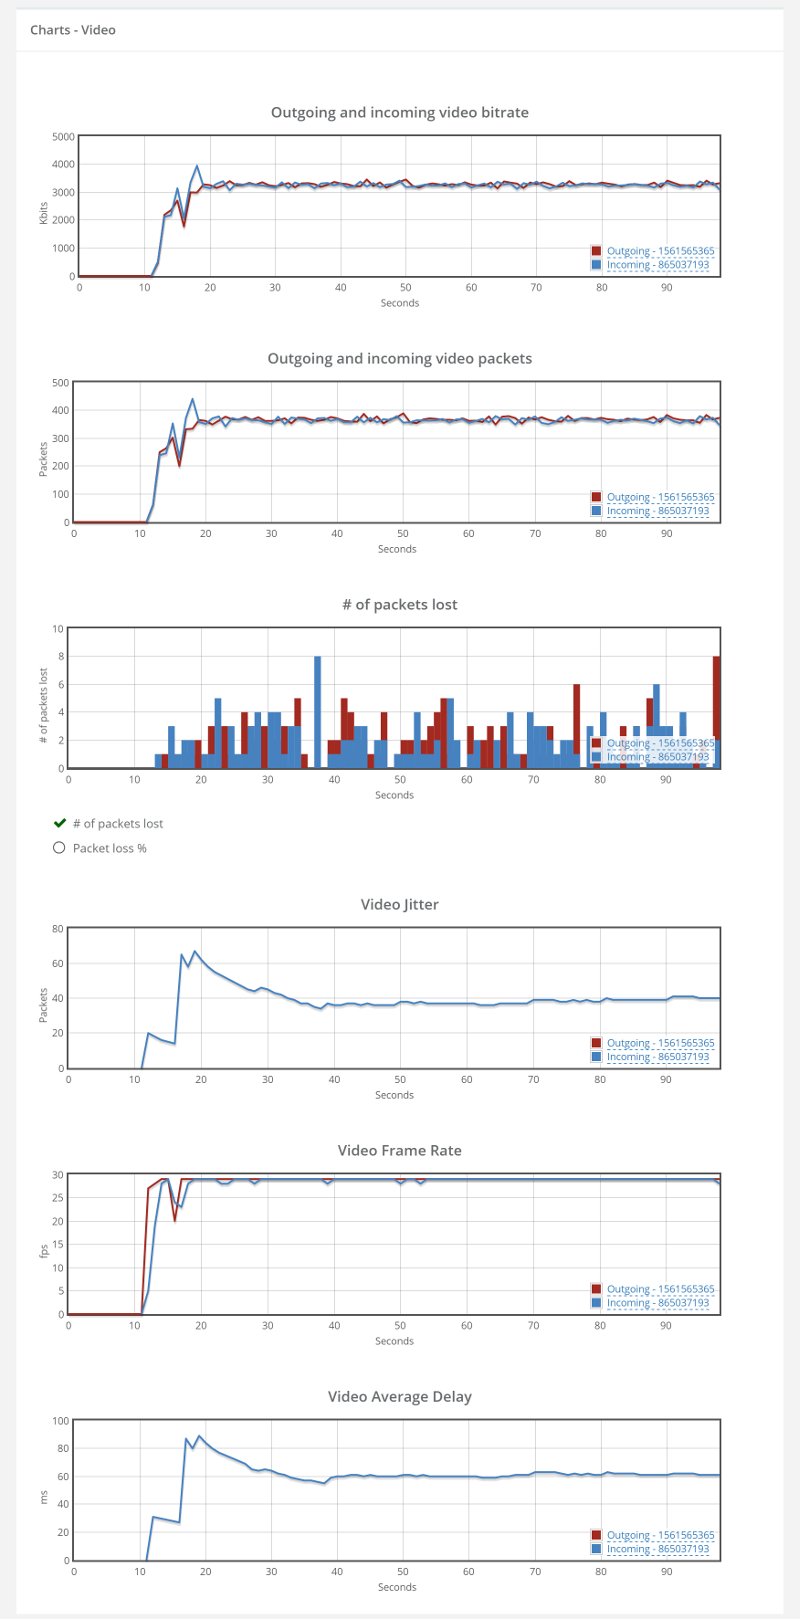
Running that using testRTC yields these results once you drill into one of these sessions:

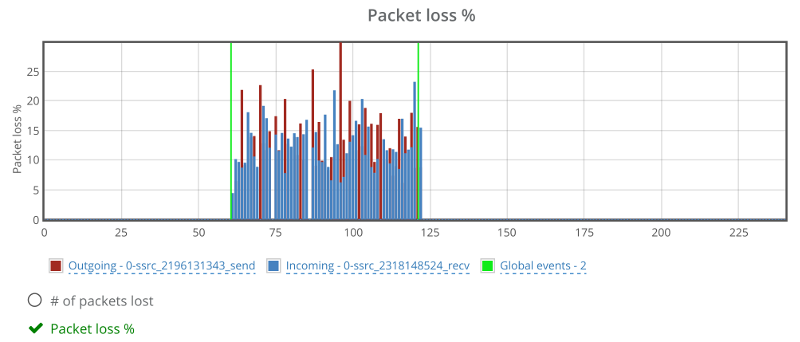
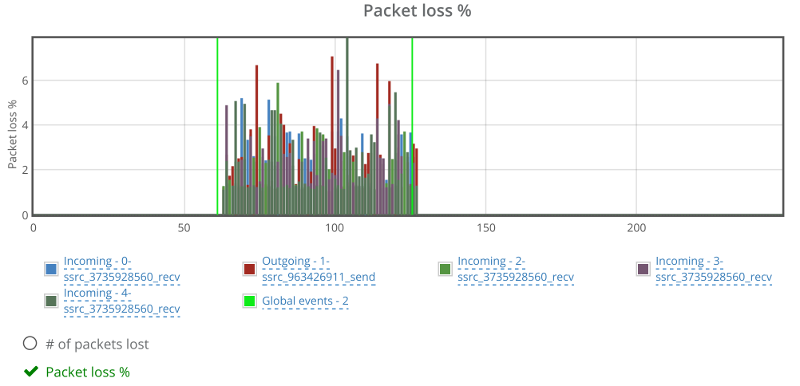
Above you see two things:

  1. The green vertical lines – these are the result of the rtcEvent() calls
  2. The blue and red bars, showing incoming and outgoing packet loss percentage, which averages at 10%

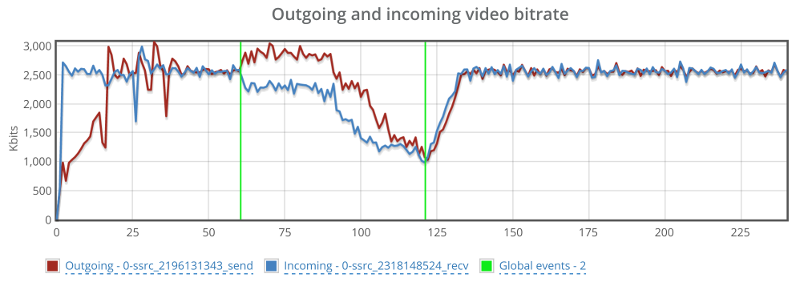
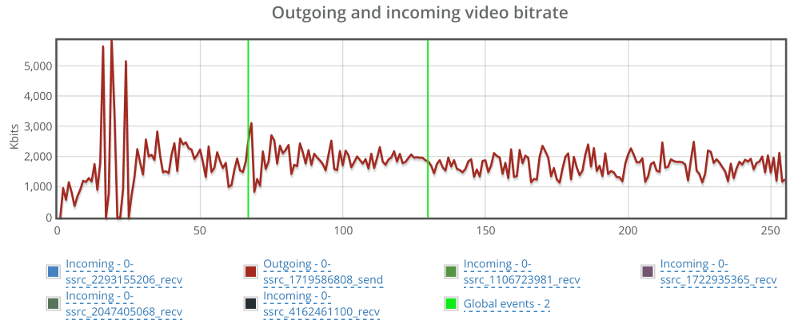
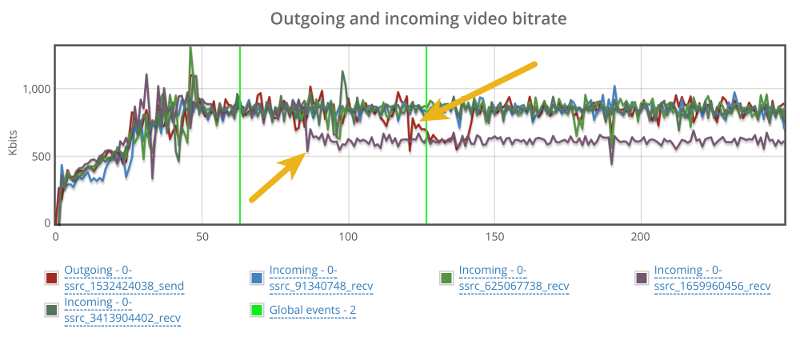
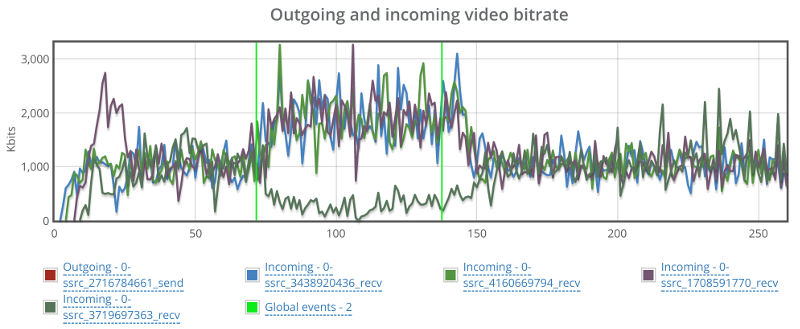
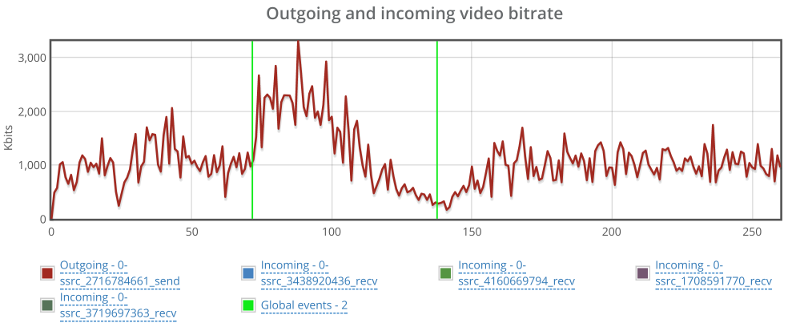
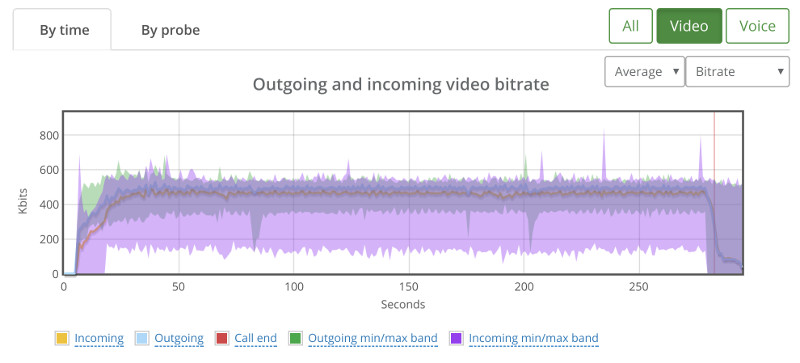
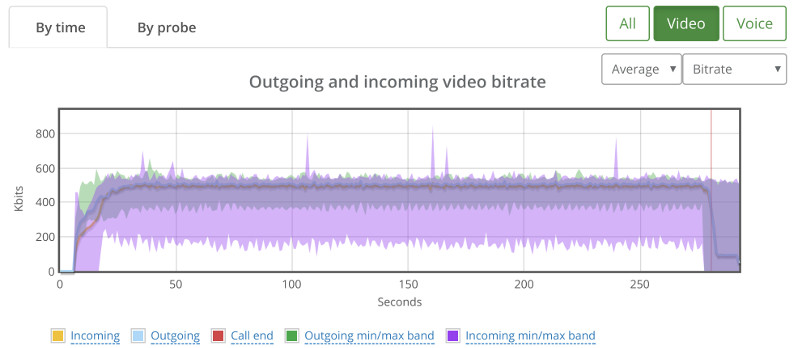
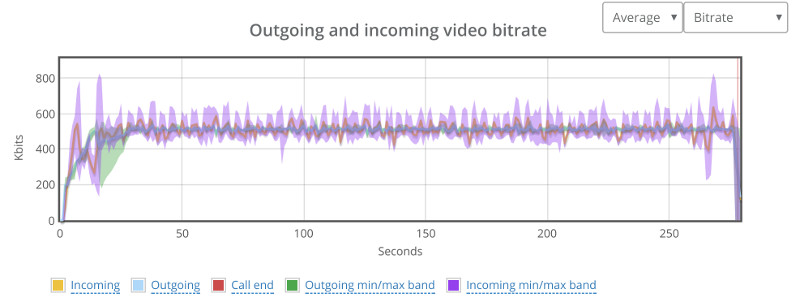
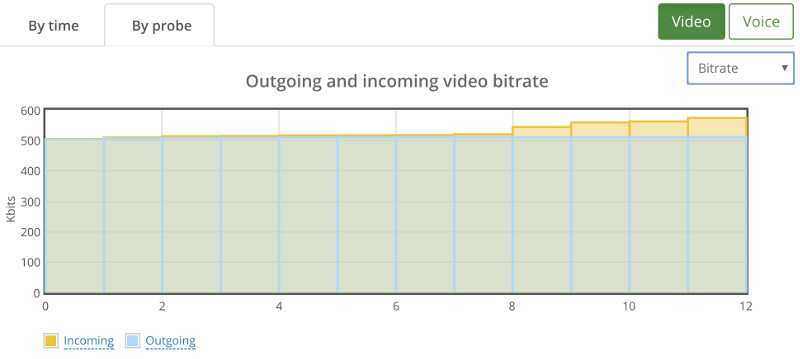
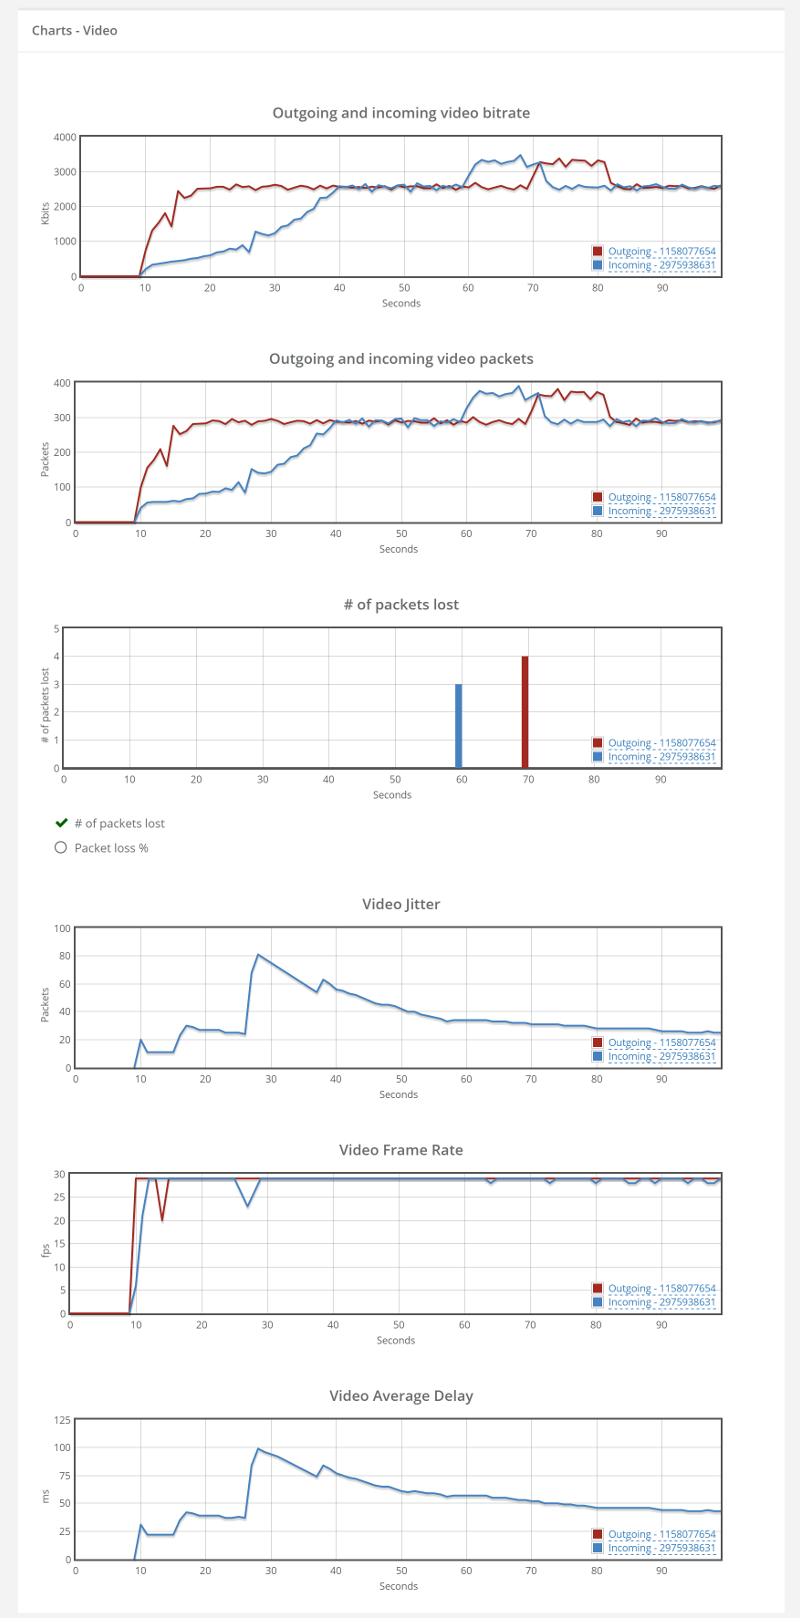
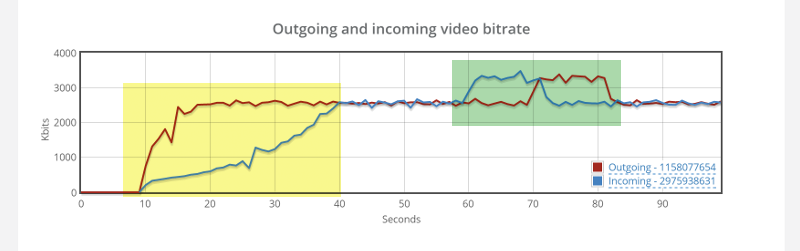
Above you see the video bitrate graph, with the two horizontal lines on it.

Notice how the outgoing bitrate tries going up in the beginning and then drops from 2.5mbps to 1mbps in 60 seconds?

The other thing that interest me is the time it takes for WebRTC/AppRTC to get back to 2.5mbps. And that’s somewhere in the range of 15-20 seconds.

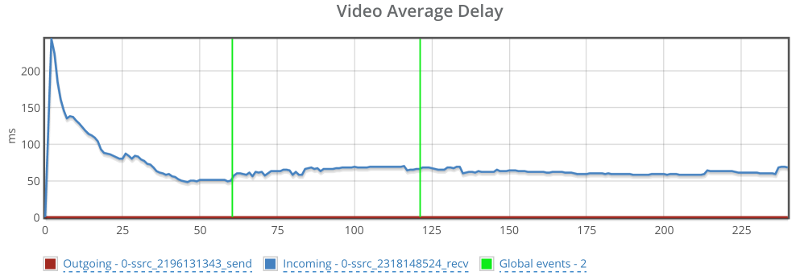
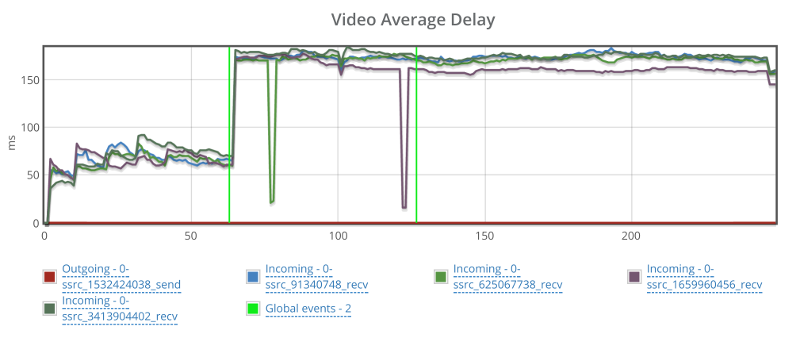
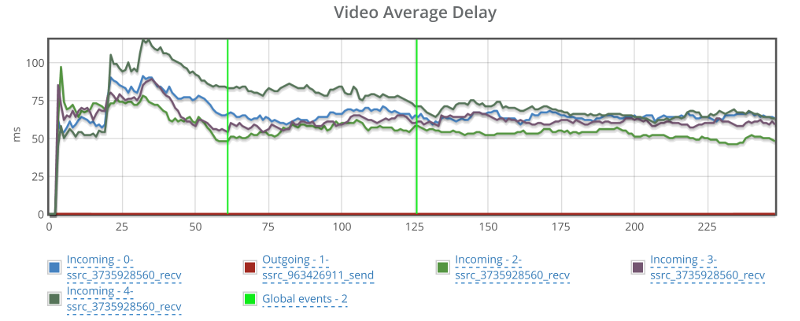
Oh, and because I know you’ll be interested in this – also remember this screenshot of the video average delay we had:

Before we move on to the media servers – remember that what I tried doing with AppRTC is provide a baseline. And the baseline here is “picture perfect”. I didn’t really expect any of the SFUs that I’ve used to be able to match AppRTC with its metrics.

Janus

Janus is an open source media server created and maintained by Meetecho.

They have an online demo running that supports a simple video room.

So we just hooked our script on top of that to get the results we needed. We aimed for 5 browsers in a single room – which will be the norm from now on in this article.

The Janus demo has somewhat of a single room, and I had to end up with a J3rry user in there, though he seemed harmless with no camera or bitrate in my session.

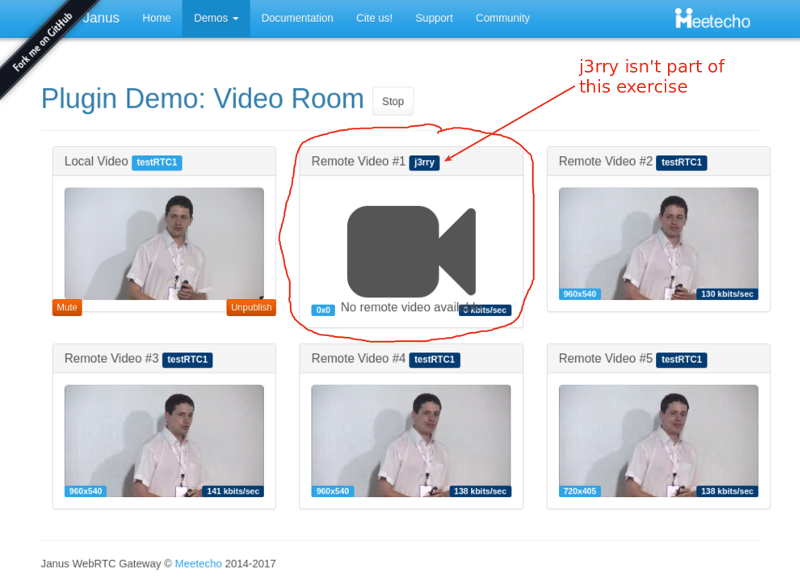
You can see above that the bitrates are rather low – around 140 kbps for each video stream coming into this room. And that’s even before I started adding packet loss.

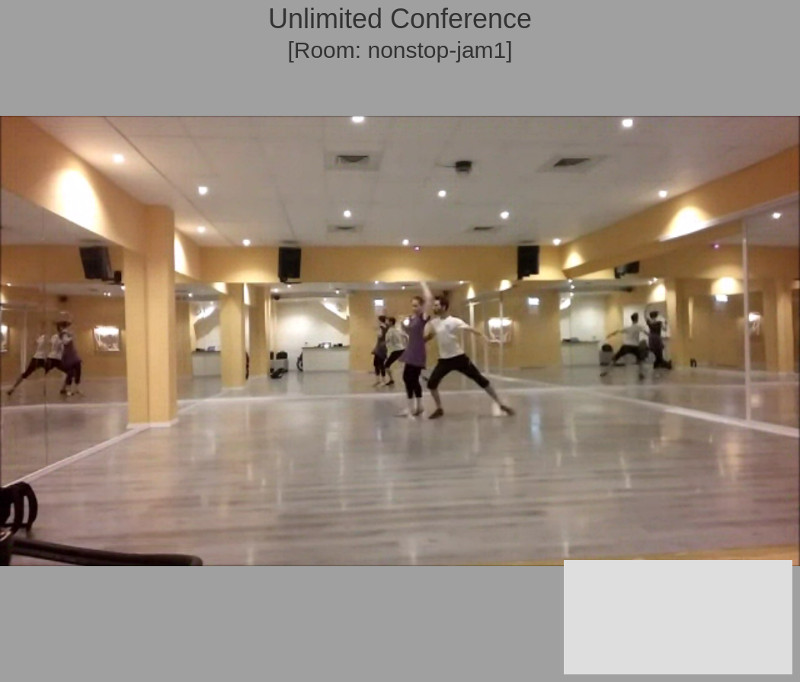
During packet loss and after it, we “lost” two participants. Here’s a screenshot taken a minute after I stopped packet loss altogether:

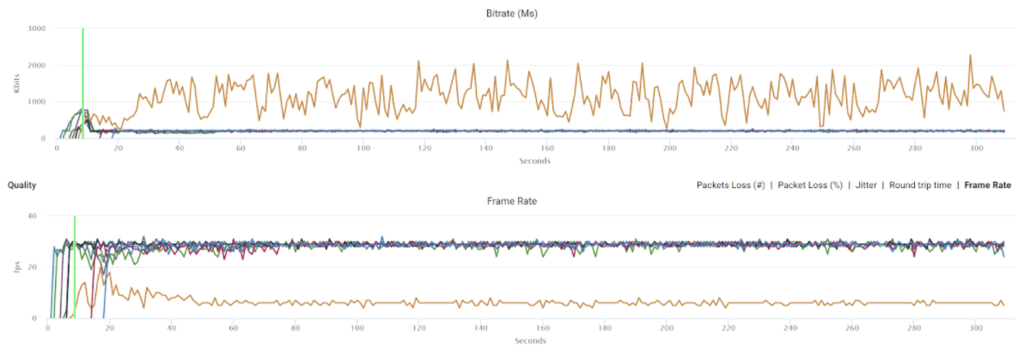
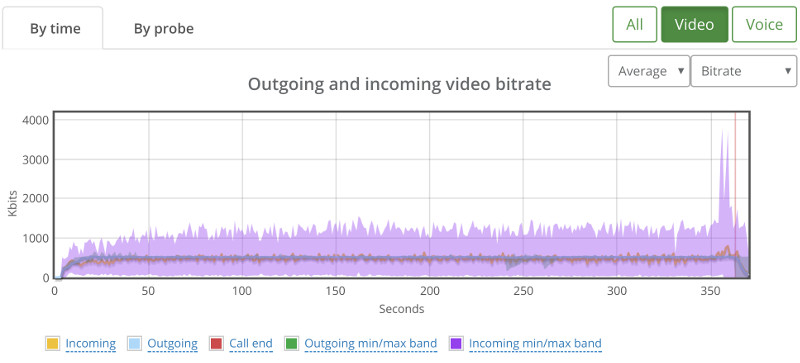
The graphs in testRTC show a grim picture:

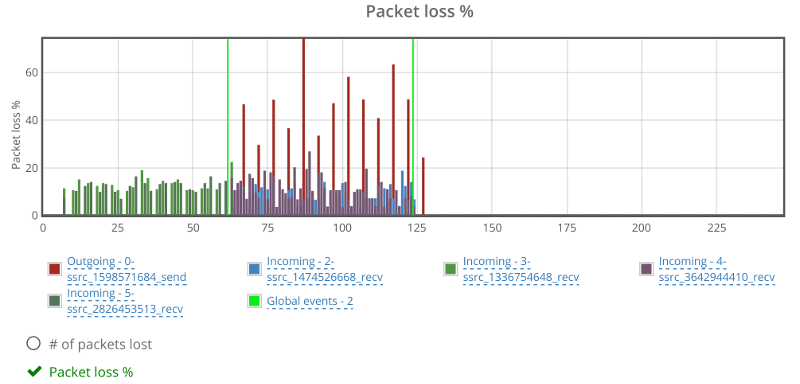
Janus reports packet losses at higher intervals than what WebRTC does, which is why we see the spikes on the outgoing reporting that go up to 50% and more. The weird thing is the two incoming channels that show around 10% of packet loss as well. Which is weird – more about this later.

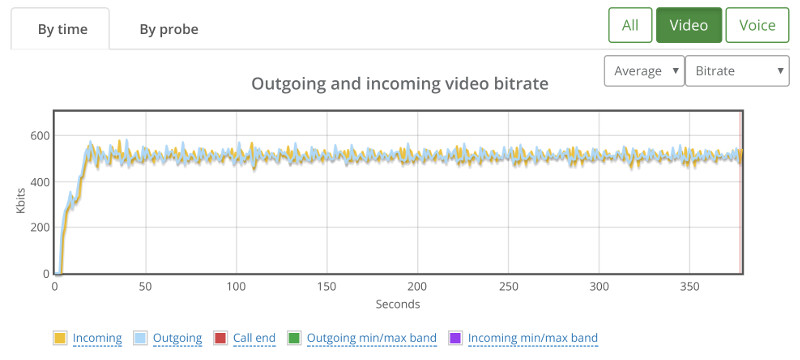
Here’s how video bitrates look like for some of the streams (one outgoing and two incoming):

No change even though we have packet loss.

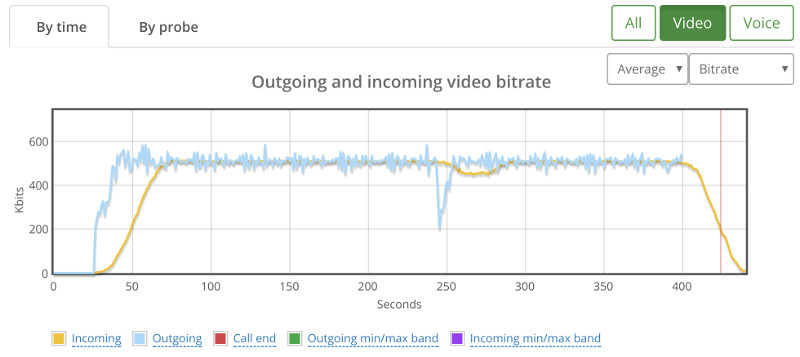
And here’s what happens in the two other incoming streams:

Apparently, these two incoming streams are the ones showing packet loss from the start. They somehow decided to drop to 0 the moment we cranked up the artificial packet loss from 0 to 10% – but never recuperated from it.

Looking at the average delay for the video…

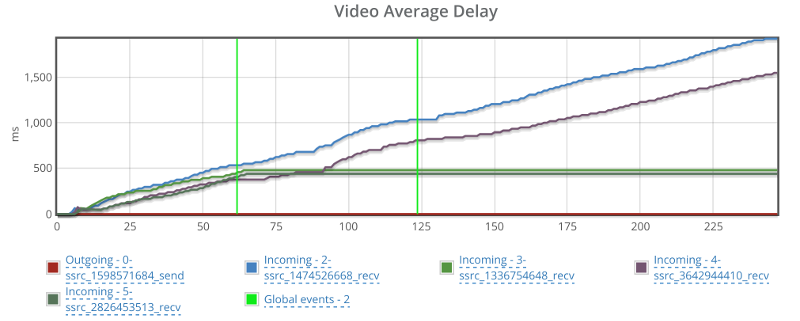
Things can’t be good, but seems like this has nothing to do with my packet loss shenanigans.

It might be Janus and it might just be the demo machine. If I could, I’d reboot it and start all over again.

Jitsi

For me the Jitsi Videobridge is where I go first to run demos and tests on an SFU with testRTC:

  • It is out there
  • It is easy to automate
  • And I am a creature of habit…

To run our test here, we’ve directed 5 of our probes into a single room on the Jitsi meet online service/demo.

After a few attempts, I decided it would be better to disable simulcast, using this prefix to the URL: ‘#config.disableSimulcast=true’. I didn’t do it because simulcast is a bad thing, but because it made analyzing the results much harder for what I had in mind.

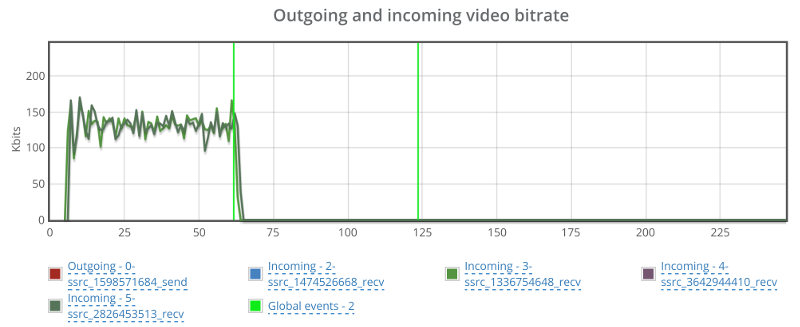
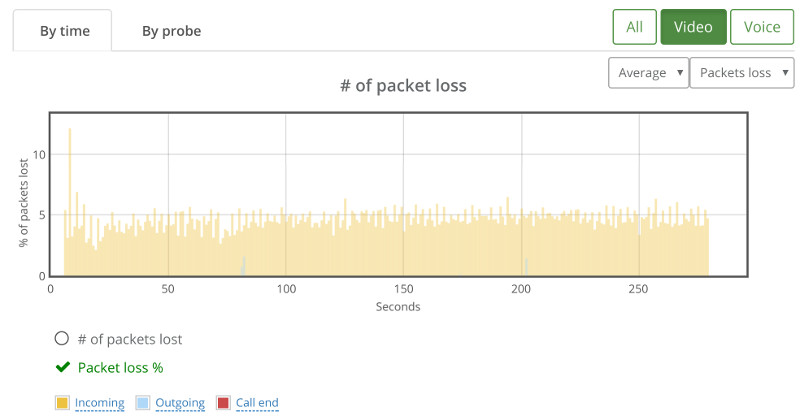
If we look at the packet loss graph, it will tell a similar story to what we’ve seen so far:

While there are some packet losses out of the one minute killzone I created, they are negligible (or at least sporadic). That negative values you see for packet losses in the red color? They are reports of the browser’s outgoing stream from the machine we induced packet loss on. This is most probably related to a Chrome bug (HT to Philipp Hancke).

I’ve split the video bitrate graphs here into two graphs – the outgoing one and the incoming ones since they tell two separate stories.

This one caught me by surprise – the outgoing bitrate shows no signs of a change due to packet loss. I wonder what Jitsi is doing (or not doing) to have packet loss ignored in such a way. So I decided to look at it from the receiving end of one of the other four browsers in the same session:

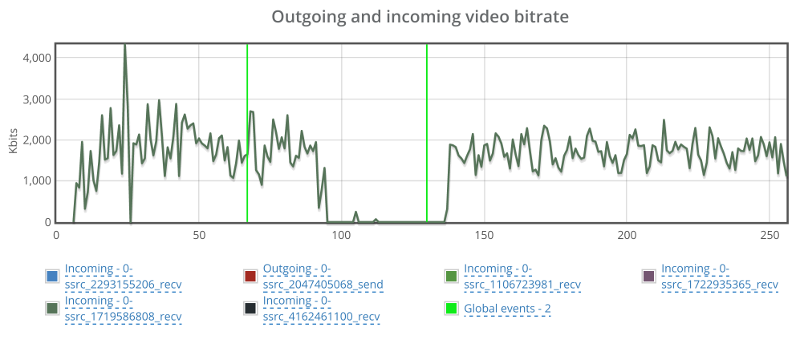
Bitrate drops to 0 for a duration of almost a full minute before coming back up.

Back to the browser with the trashed network, let’s see what happens to the incoming video streams:

Things drop down from around 2mbps to almost 0 on all incoming channels, taking around 40-60 seconds to get back to normal.

One last glance before we move on – check out video average delay:

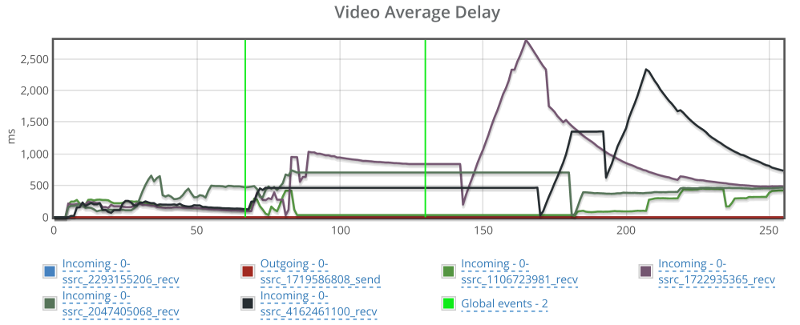
Jitsi had some hard time recuperating from that packet loss.

It should be noted that I’ve played around with Jitsi before their recent updates – especially the ones including adaptivity.
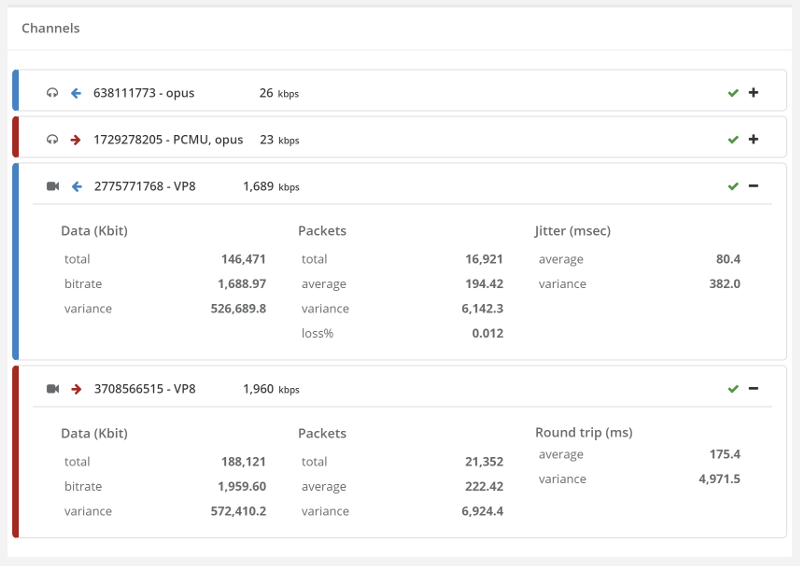
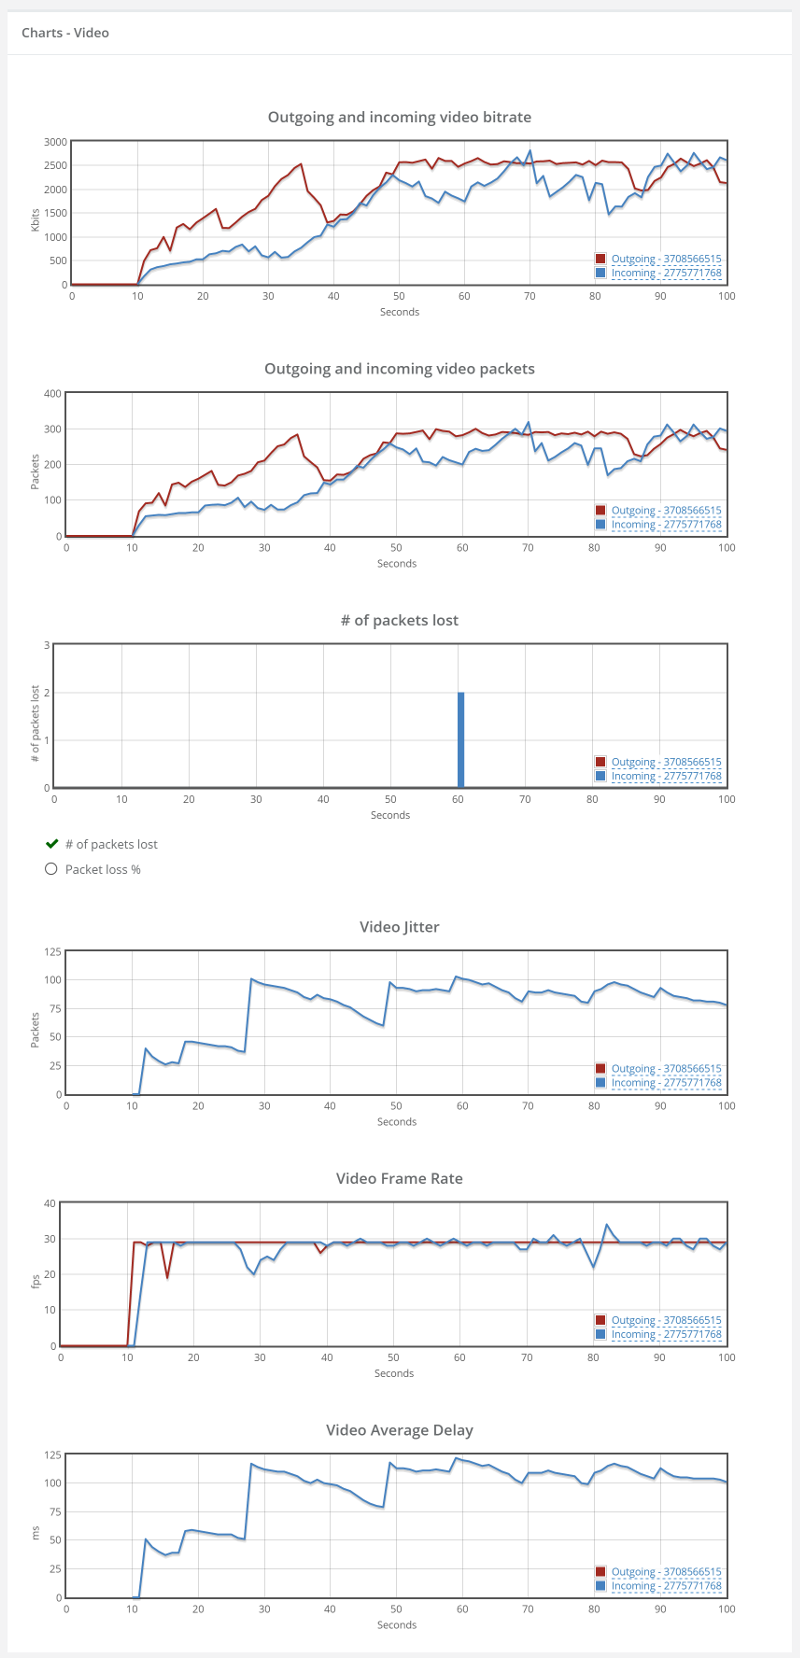
Mediasoup

mediasoup is a rather new player in the open source SFU space. It is built in C++ as a Node.js module. After a quick Twitter chat, Iñaki Baz Castillo was kind enough to configure it to my needs (specifically, allowing for more bandwidth on the online demo).

Starting as always with packet loss:

The graph seems fine. Percentages are low because of the way packet losses are reported back from the media server. Probably some FEC / retransmissions are involved as well (this would be the case with many of the media servers out there).

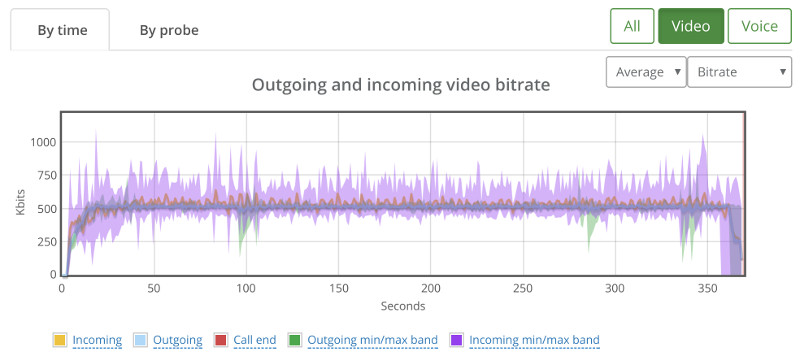
Looking at the video bitrate, we see an interesting picture:

There’s a hiccup in the outgoing bitrate (the red line), but that for some reason takes place close to the end of the 60 seconds packet loss window.

There’s also a reduction in incoming bitrate for one of the video stream. It starts around 20 seconds into the packet loss zone, but it doesn’t recover even when we remove the packet losses.

Video delay is also a bit problematic:

It starts off nicely, goes up when packet losses start and never recuperates.
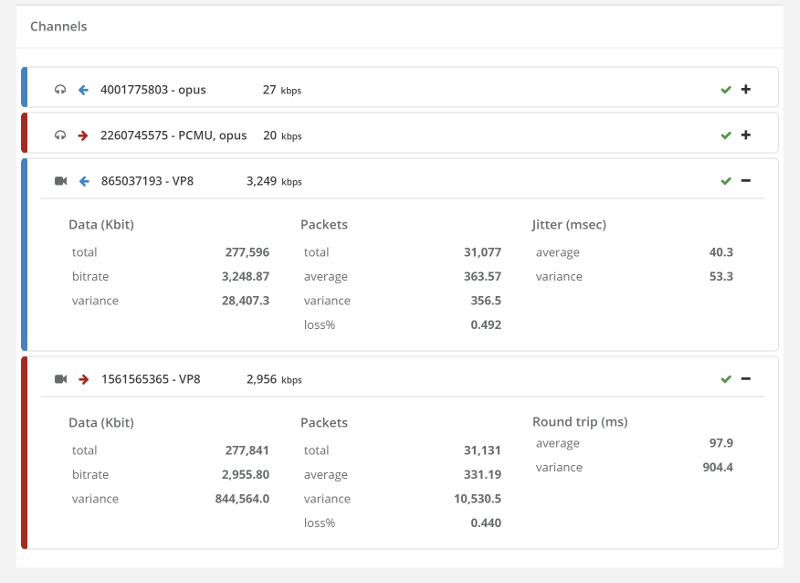
SwitchRTC

Moving on from open source to commercial, there’s SwitchRTC.

It started by me asking for a 2mbps bitrate limit. Now, the way this was set up and without simulcast, it meant the browser is going to need to encode 2mbps and decode 4 streams of 2mbps each. This turned out to be a bit too much for the way we configure our machines (and frankly – probably too much for almost any use case you plan on deploying when it comes to assuming what your typical customer may have).

The end result of it was graphs that went all over the place – each stream and each browser tried hard to compete on resources that were limited, and it wasn’t really nice.

So we dialed back down to 1mbps bitrate limit.

As always, let’s first look at the packet loss graph:

Two things here to note:

  1. One of the incoming video streams has packet losses outside the packet loss zone. Not unheard of, but a bit off the charges compared to others. I think that is due to the data centers used by SwitchRTC for this demo
  2. There’s negative packet losses on the outgoing video stream. This is due to the way SwitchRTC handles packet loss reporting (or more likely filtering packet loss reporting)

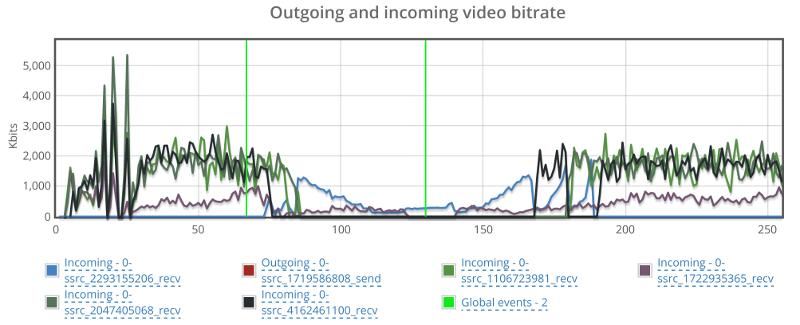
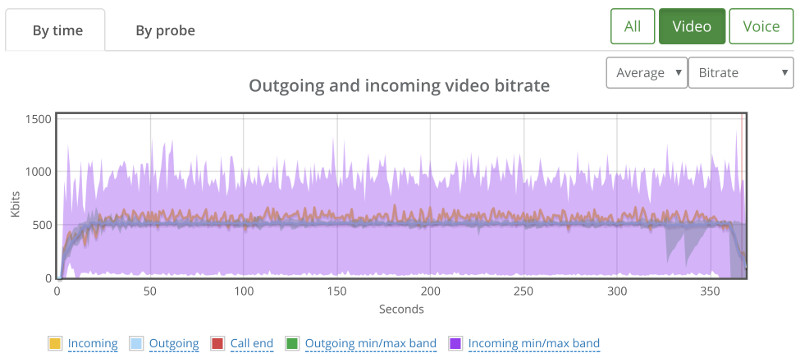
For bitrate, I took two screenshots. One for the incoming video streams and one for the outgoing video stream.

On the incoming stream we see an interesting phenomena.

When packet loss starts, bitrate picks up, most likely to overcome the packet loss. It makes sense, since we didn’t limit bitrates, so that seems like the correct strategy. Would be interesting to see what will happen if we limit bitrate as well.

The second thing, is that we have one of the incoming stream dropping down to almost zero and then picking up again. This is the same stream that shows high packet losses. I wonder what causes that.

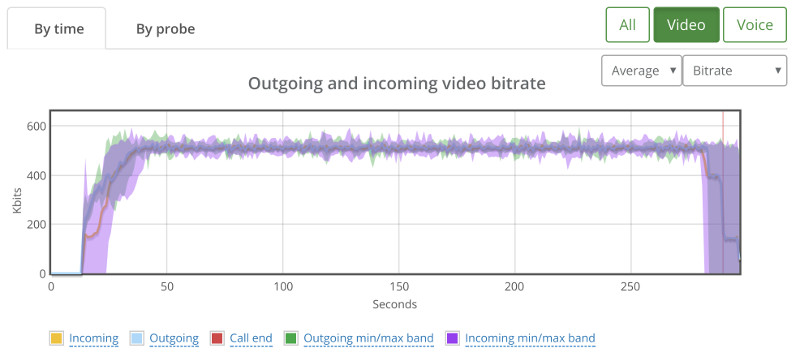
The graph above shows the outgoing video stream. This is almost textbook behavior for the outgoing video. Once it notices there’s issues, it starts increasing bitrate to compensate, and when that fails – it drops down slowly. It is similar, though not as smooth as what you see with AppRTC.

appear.in

appear.in have a beta SFU, which Philipp Hancke was kind enough to let me use.

Now, appear.in isn’t a media server or a component you can use in your own service – it is a full service, which makes this comparison a bit unfair – checking demos and comparing them to a commercial service.

But then I wanted to check this one out, as it isn’t based on any external framework – it was self developed in house at appear.in

The results are interesting.

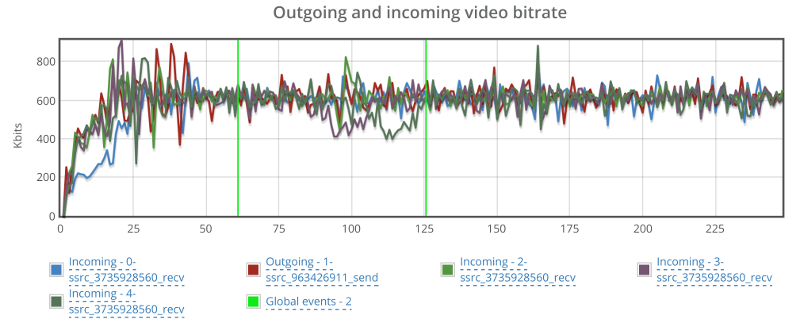
Packet loss graph looks rather nice, if a tad low in the percentage:

This shows how far appear.in goes in gauging and polishing the way they make use of network resources.

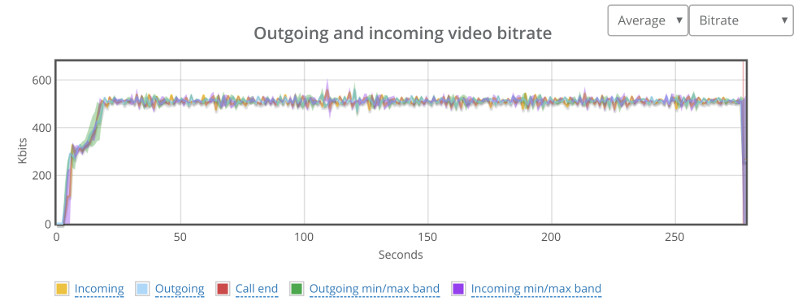
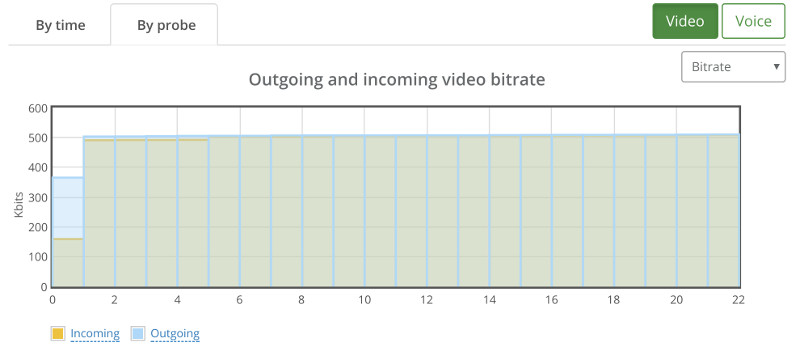
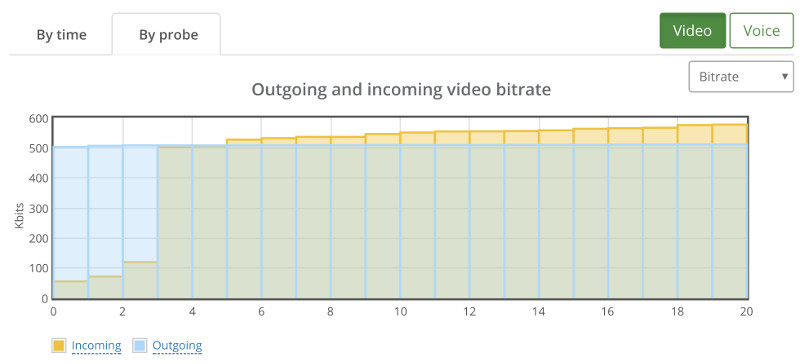
Video bitrate stays at the 600kbps vicinity – not showing any real effects from my additional packet loss:

Best part though is that the video delay graph doesn’t look erratic:

I am not sure how to compare these results to the rest. I will need more time to check this out – time that I just didn’t have available for this experiment of mine. I will leave it for some future tinkering.

Summing things up

Different media servers will act differently. Especially when putting them under different network conditions.

What I wanted to show here, is how you can use testRTC to goof around with whatever setting you want. Here are a few other ideas:

  1. Drop the network down to 0 bitrate. Wait a bit. Put it back up. Did media return? How quickly did it come up again?
  2. Limit bitrates to different levels. Check if your media server adapts things like resolutions and other interesting parameters to fit the needs
  3. Go down to 50 or 100 kbps. Does video persist or is the media server shutting it down in favor of audio?
  4. Limit bitrate and add a bit of packet loss at the same time (this would be closest to real life). See what happens then – how will the media server behave?
  5. Do the above while adding some load on the server. Does it start fidgeting or is it handling this nicely?

A few things to remember here:

This isn’t an apples to apples comparison

I haven’t taken each and every media server and installed it on my own on the same server configuration. I just used the online demos each of these vendors had. At times, asking for assistance and a bit of configuration from the vendor.

What was different:

  • The server(s) the media server was installed on
  • The configuration of the server, especially what max bitrate it allows

What was similar:

  • I tried disabling simulcast in all servers. Assume that’s a bad thing to do, but I wanted a level playing field on that front
  • The browser used. It was the same for all tests. This includes their version, the machine they were installed on, the network they used, their geographical location – everything
  • The scenario itself. I essentially executed the same scenario over and over again in front of different media servers

Where do we go from here?

Media servers are hard to develop. They are hard to tweak and optimize. And they are hard when it comes to making sizing decisions with them.

They are also pretty good. Most of the ones shown here are running in production services with live customers.

When you go tomorrow to pick the media server for your own project. Or when you want to plan how to size capacities per machine. Or if you want to check your media server in real life scenarios – we’ve got your back.

Check us out. I am sure we can be of help to you.

10

What happens when WebRTC shifts to TURN over TCP

You wouldn’t believe how TURN over TCP changes the behavior of WebRTC on the network.

I’ve written this on BlogGeek.me about the importance of using TURN and not relying on public IP addresses. What I didn’t cover in that article was how TURN over TCP changes the behavior we end up seeing on the network.

This is why I took the time to sit down with AppRTC (my usual go-to service for such examples), used a 1080p resolution camera input, configure my network around it using testRTC and check what happens in the final reports we get.

What I want to share here are 4 different network conditions:

Checking how TURN over TCP affects the network flow

#1 – A P2P Call with No Packet Loss

Let’s first figure out the baseline for this comparison. This is going to be AppRTC, 1:1 call, with no network impairments and no use of TURN whatsoever.

Oh – and I forced the use of VP8 on all calls while at it. We will focus on the video stats, because there’s a lot more data in them.

P2P; No packet loss; charts

Our outgoing bitrate is around 2.5Mbps while the incoming one is around 2.3Mbps – it has to do with the timing of how we calculate things in testRTC. With longer calls, it would average at 2.5Mbps in both directions.

Here’s how the video graphs look like:

P2P; No packet loss; graphs

They are here for reference. Once we will analyze the other scenarios, we will refer back to this one.

What we will be interested in will mainly be bitrate, packet loss and delay graphs.

#2 – TURN over TCP call with No Packet Loss

At first glance, I was rather put down by the results I’ve seen on this one – until I dug into it a bit deeper. I forced TCP relay by blocking all UDP traffic in our machines.

TURN over TCP; No packet loss; charts

This time, we have slightly lower bitrates – in the vicinity of 2.4Mbps outgoing and 2.2Mbps incoming.

This can be related to the additional TURN leg, its network and configuration – or to the overhead introduced by using TCP for the media instead of UDP.

The average Round trip and Jitter vaues are slightly higher than those we had without the need for TURN over UDP – a price we’re paying for relaying the media (and using TCP).

The graphs show something interesting, but nothing to “write home about”:

TURN over TCP; No packet loss; graphs

Lets look at the video bitrate first:

TURN over TCP; No packet loss; video bitrate

Look at the yellow part. Notice how the outgoing video bitrate ramps up a lot faster than the incoming video bitrate? Two reasons why this might be happening:

  1. WebRTC sends out data fast, but that same data gets clogged by the network driver – TCP waits before it sends it out, trying to be a good citizen. When UDP is used, WebRTC is a lot more agressive (and accurate) about estimating the available bitrate. So on the outgoing, WebRTC estimates that there’s enough bitrate to use, but then on the incoming, TCP slows everything down, ramping up to 2.4Mbps in 30 seconds instead of less than 5 that we’re used to by WebRTC
  2. The TURN server receives that data, but then somehow decides to send it out in a slower fashion for some unknown reason

I am leaning towards the first reason, but would love to understand the real reason if you know it.

The second interesting thing is the area in the green. That interesting “hump” we have for the video, where we have a jump of almost a full 1Mbps that goes back down later? That hump also coincides with packet loss reporting at the beginning of it – something that is weird as well – remember that TCP doesn’t lose packets – it re-transmits them.

This is most probably due to the fact that after bitstream got stabilized on the outgoing side, there’s the extra data we tried pushing into the channel that needs to pass through before we can continue. And if you have to ask – I tried a longer 5 minutes session. That hump didn’t appear again.

Last, but not least, we have the average delay graph. It peaks at 100ms and drops down to around 45ms.

To sum things up:

TURN over TCP causes WebRTC sessions to stabilize later on the available bitrate.

Until now, we’ve seen calls on clean traffic. What happens when we add some spice into the mix?

#3 – A P2P Call with 0.5% packet loss

What we’ll be doing in the next two sessions is simulate DSL connections, adding 0.5% packet loss. First, we go back to our P2P call – we’re not going to force TURN in any way.

P2P; 0.5% packet loss; charts

Our bitrate skyrocketed. We’re now at over 3Mbps for the same type of content because of 0.5% packet loss. WebRTC saw the opportunity to pump more bits to deal with the network and so it did. And since we didn’t really limit it in this test – it took the right approach.

I double checked the screenshots of our media – they seemed just fine:

P2P; 0.5% packet loss; screenshot

Lets dig a bit deeper into the video charts:

P2P; 0.5% packet loss; graphs

There’s packet loss alright, along with higher bitrates and slightly higher delay.

Remember these results for our final test scenario.

#4 – TURN over TCP Call with 0.5% packet loss

We now use the same configuration, but force TURN over TCP over the browsers.

Here’s what we got:

TURN over TCP; 0.5% packet loss; charts

Bitrates are lower than 2Mbps, whereas on without forcing TURN they were at around 3Mbps.

Ugliness ensues when we glance at the video charts…

TURN over TCP; 0.5% packet loss; graphsThings don’t really stabilize… at least not in a 90 seconds period of a session.

I guess it is mainly due to the nature of TCP and how it handles packet losses. Which brings me to the other thing – the packet loss chart seems especially “clean”. There are almost no packet losses. That’s because TCP hides that and re-transmit everything so as not to lose packets. It also means that we have utilization of bitrate that is way higher than the 1.9Mbps – it is just not available for WebRTC – and in most cases, these re-tramsnissions don’t really help WebRTC at all as they come too late to play them back anyway.

What did we see?

I’ll try to sum it in two sentences:

  1. TCP for WebRTC is a necessary evil
  2. You want to use it as little as possible

And if you are interested about the most likely ICE candidate to connect, then checkout Fippo’s latest data nerding post.

Are you following the WebRTC deprecation path?

I just had to share this one. You know how people complain about WebRTC breaking their services, and it being unstable?

It is partially true. What these people don’t tell you, is that oftentimes they just ignore all the warnings signs that are out there. In many of the cases, the service breaks simply because it wasn’t updated in time – and time was ample for it to be updated.

This “WebRTC deprecation” of feature and capabilities, as well as other browser features is a good thing – it is a way for the browser to get rid of excess junk (and vulnerabilities).

This week I worked with one of our customers, and bumped into this warning message that I just had to share:

WebRTC deprecation warning on Chrome

What you see above is a screenshot of the types of reports we put out.

One of the things we decided early on was to collect the browser console logs and analyze them. If there’s anything suspicious there – we just bubble it up for our users.

One of the classic warnings for services that are in their staging phase is that they have no favicon for their website, which you can see in the first warning. The thing that was new to me was the second warning in there:

The MediaStream ‘ended’ event is deprecated and will be removed in M54, around October 2016.

You know what? Knowing that enables the tester to file a bug, and the developer to complain (and curse the tester) and then fix this issue. Hopefully before deprecation kicks in

The interesting thing is that whenever a new release of Chrome comes out, the number of deprecation warnings rise in all services we test, and after awhile, these things get fixed and cleaned.

So what’s the takeaway?

  1. When you build your releases calendar and the patches, make sure to take into account the time needed to fix deprecation issues related to WebRTC – since it isn’t yet a standardized RFC, expect browsers to modify their APIs between versions
  2. Make sure to look at your browser’s console logs and clean them up. And while at it, why not automate this part as well and just use testRTC for the purpose?